Download to read offline
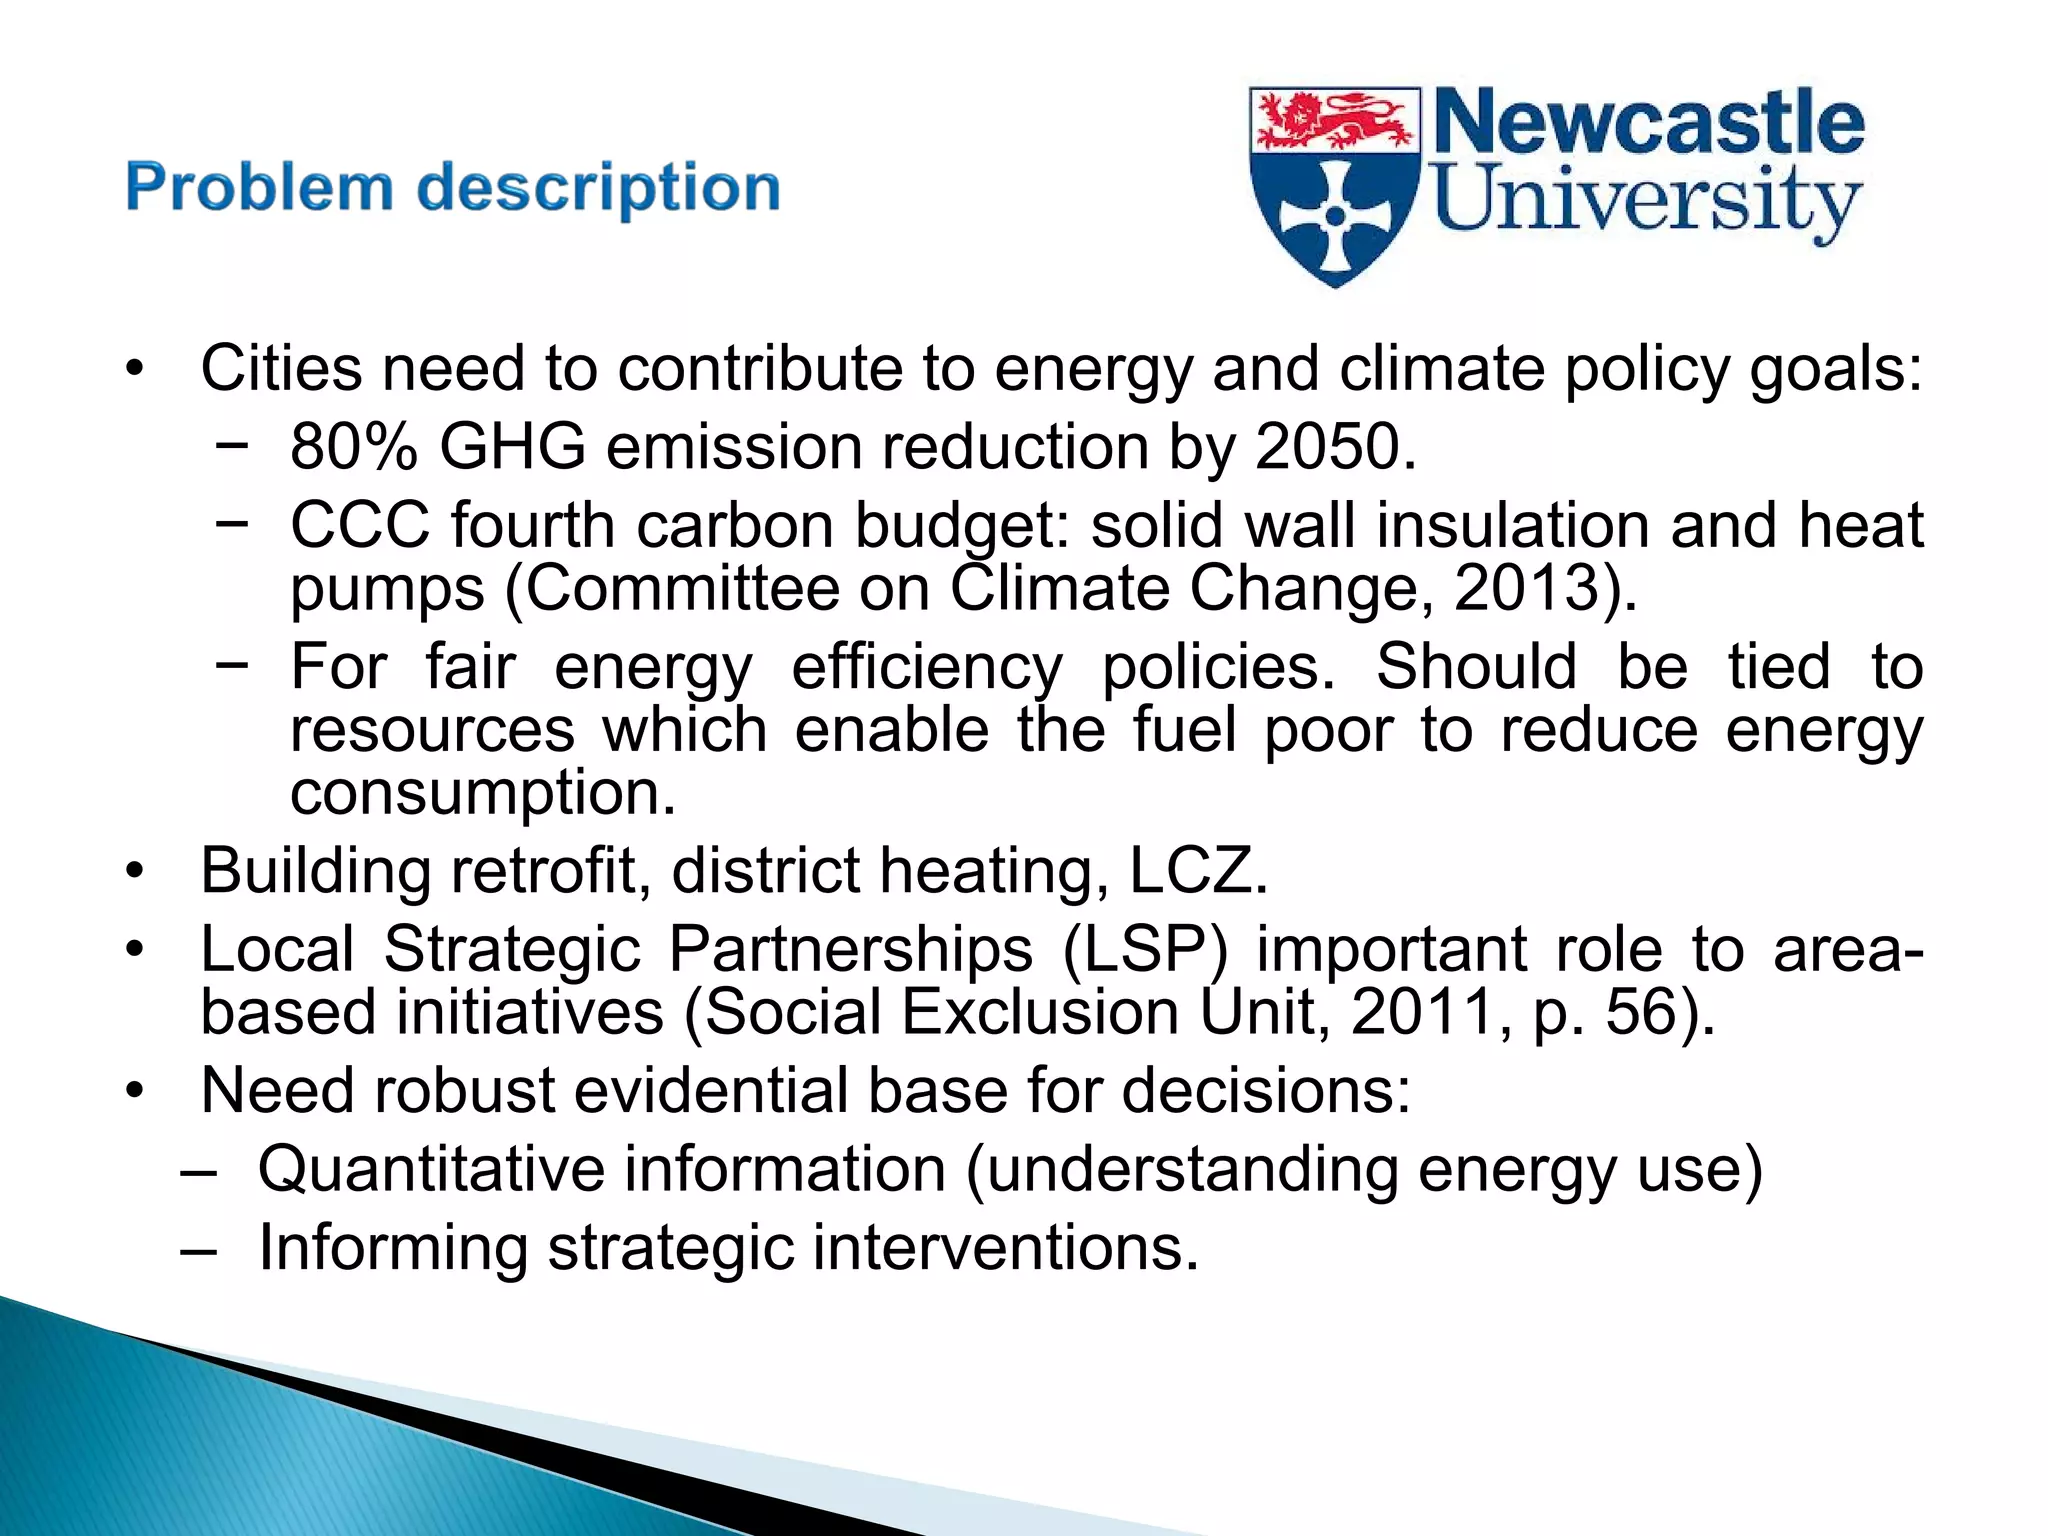
![Committee on Climate Change (2013) Reducing the UK’s carbon footprint and managing competitiveness risks. [Online]. Available
at: http://www.theccc.org.uk/wpcontent/uploads/2013/04/CF-C_Summary-Rep_Bookpdf.pdf.
Social Exclusion Unit (2011) A New Commitment to Neighbourhood Renewal - National Strategy Action Plan. [Online]. Available
at:
http://www.bristol.ac.uk/poverty/downloads/keyofficialdocuments/Neighbourhood%20Renewal%20National%20Strategy%20Repor
t.pdf.
Energy Saving Trust, Centre for Sustainable Energy and National Energy Agency (2005) WarmZones external evaluation [Online].
Available at: http://www.cse.org.uk/pdf/warm_zones_evaluation_full_final.pdf.
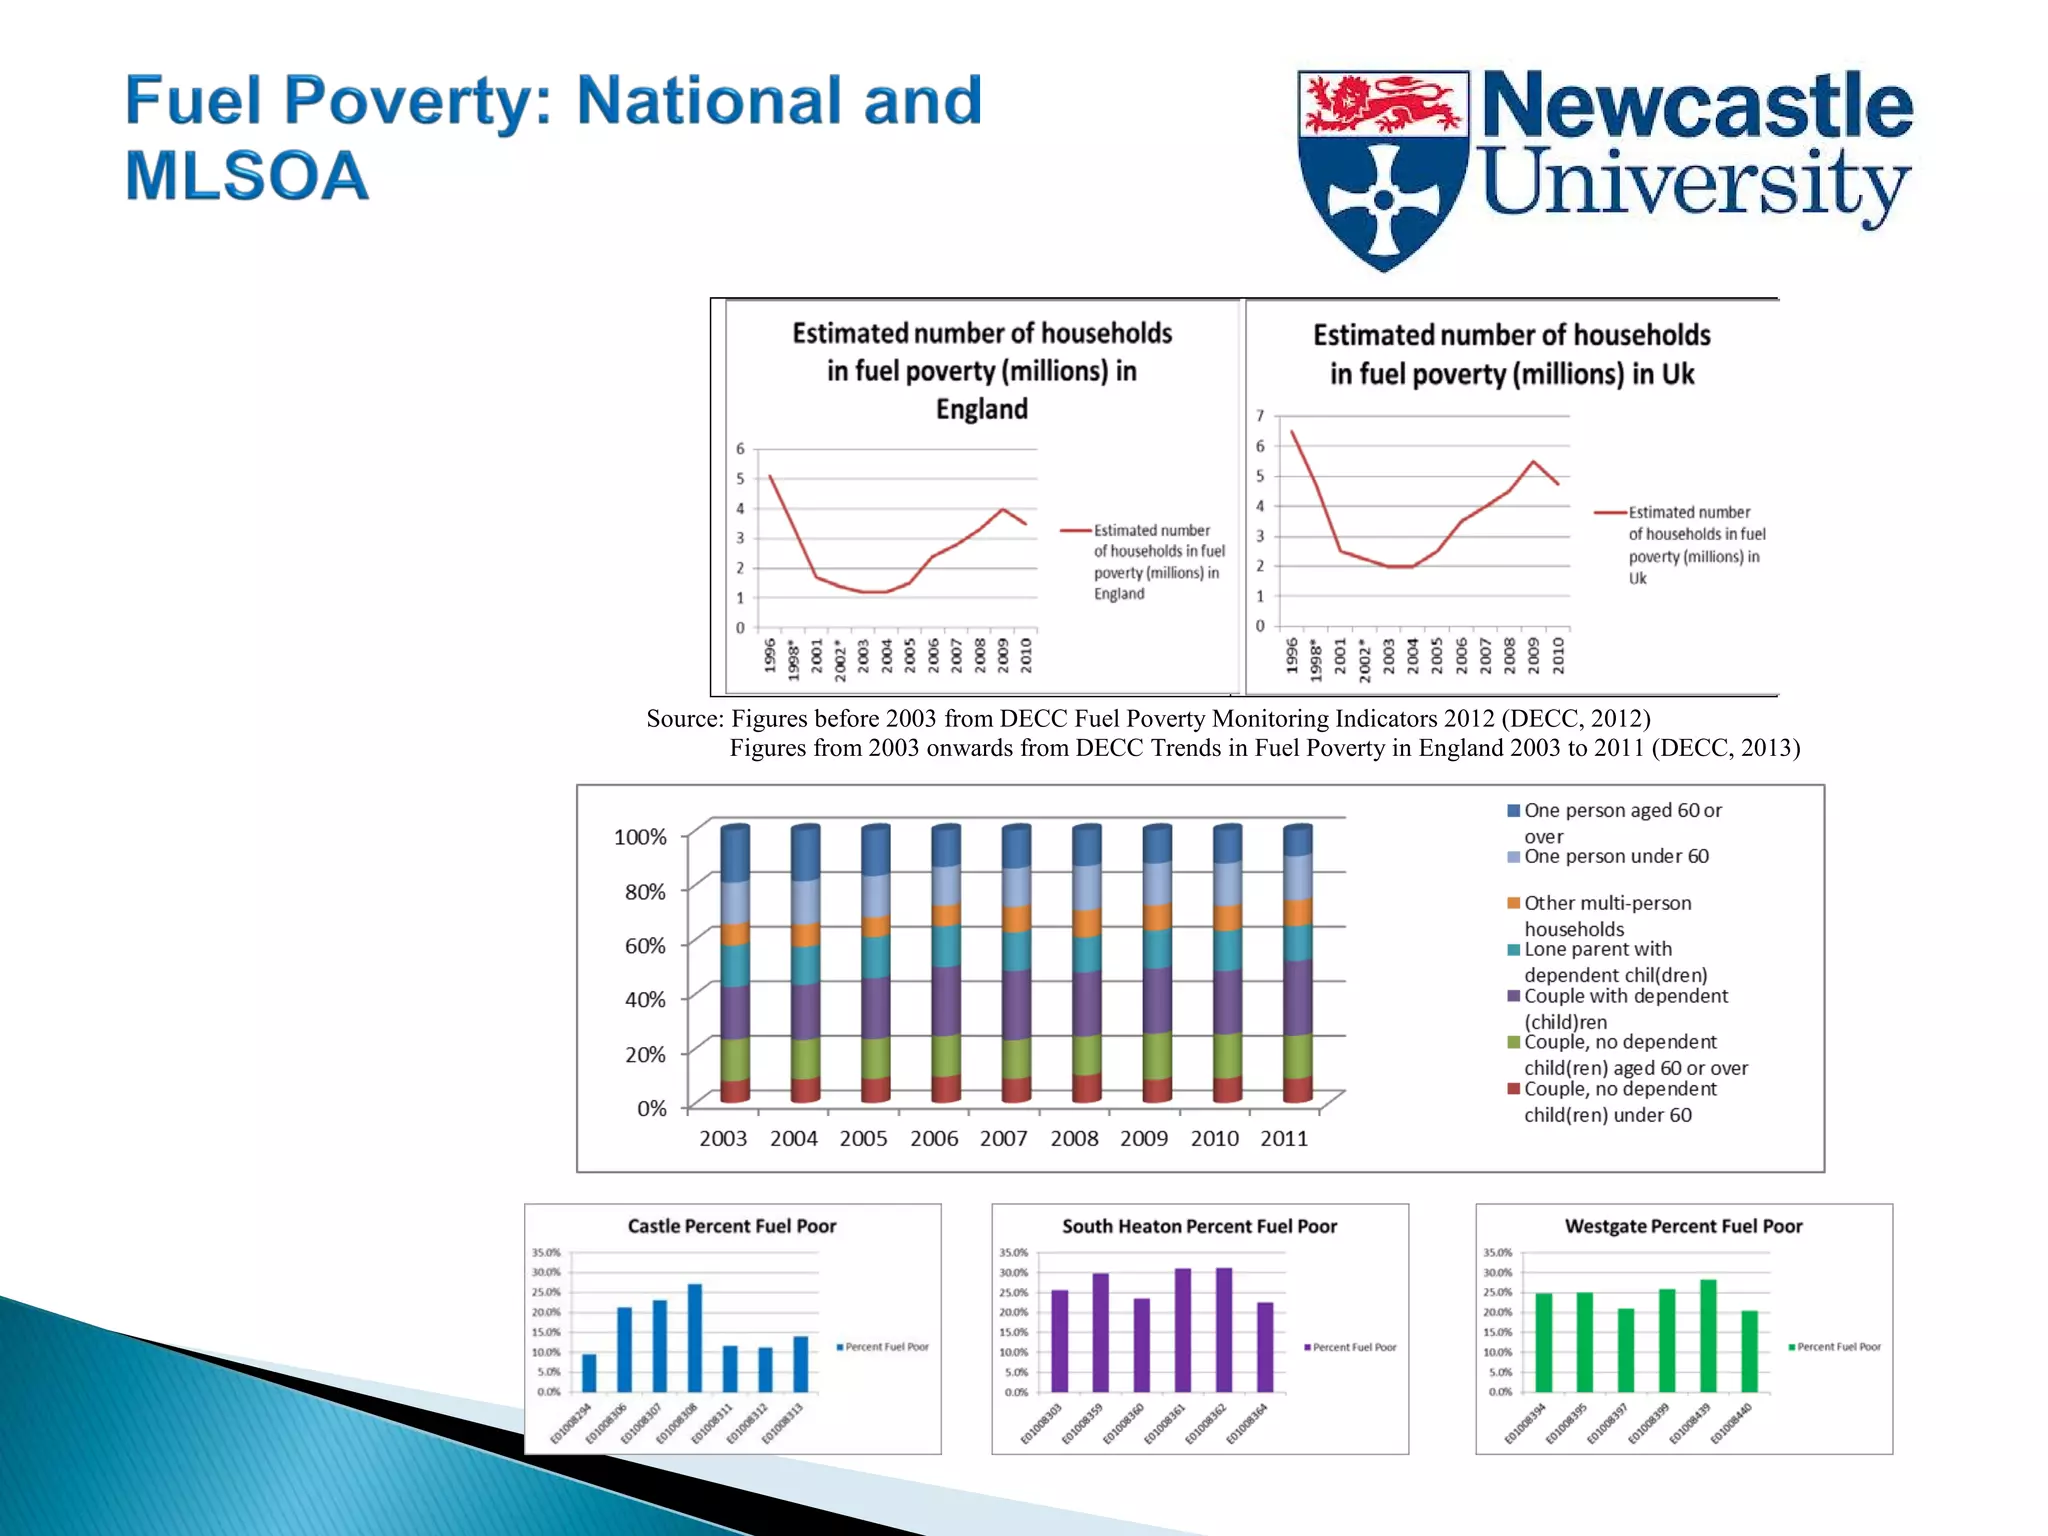
DECC (2012) Fuel poverty monitoring indicators 2012. [Online]. Available at:
https://www.gov.uk/government/uploads/system/uploads/attachment_data/file/66017/5272-fuel-poverty-monitoring-indicators-
2012.pdf.
DECC (2013) Trends in fuel poverty England: 2003 to 2011. [Online]. Available at:
https://www.gov.uk/government/publications/trends-in-fuel-poverty-england-2003-to-2011.](https://image.slidesharecdn.com/esriuktrack8newcastleuniversityspatial-150527103459-lva1-app6891/75/Esriuk_track8_newcastle_university_spatial-26-2048.jpg)

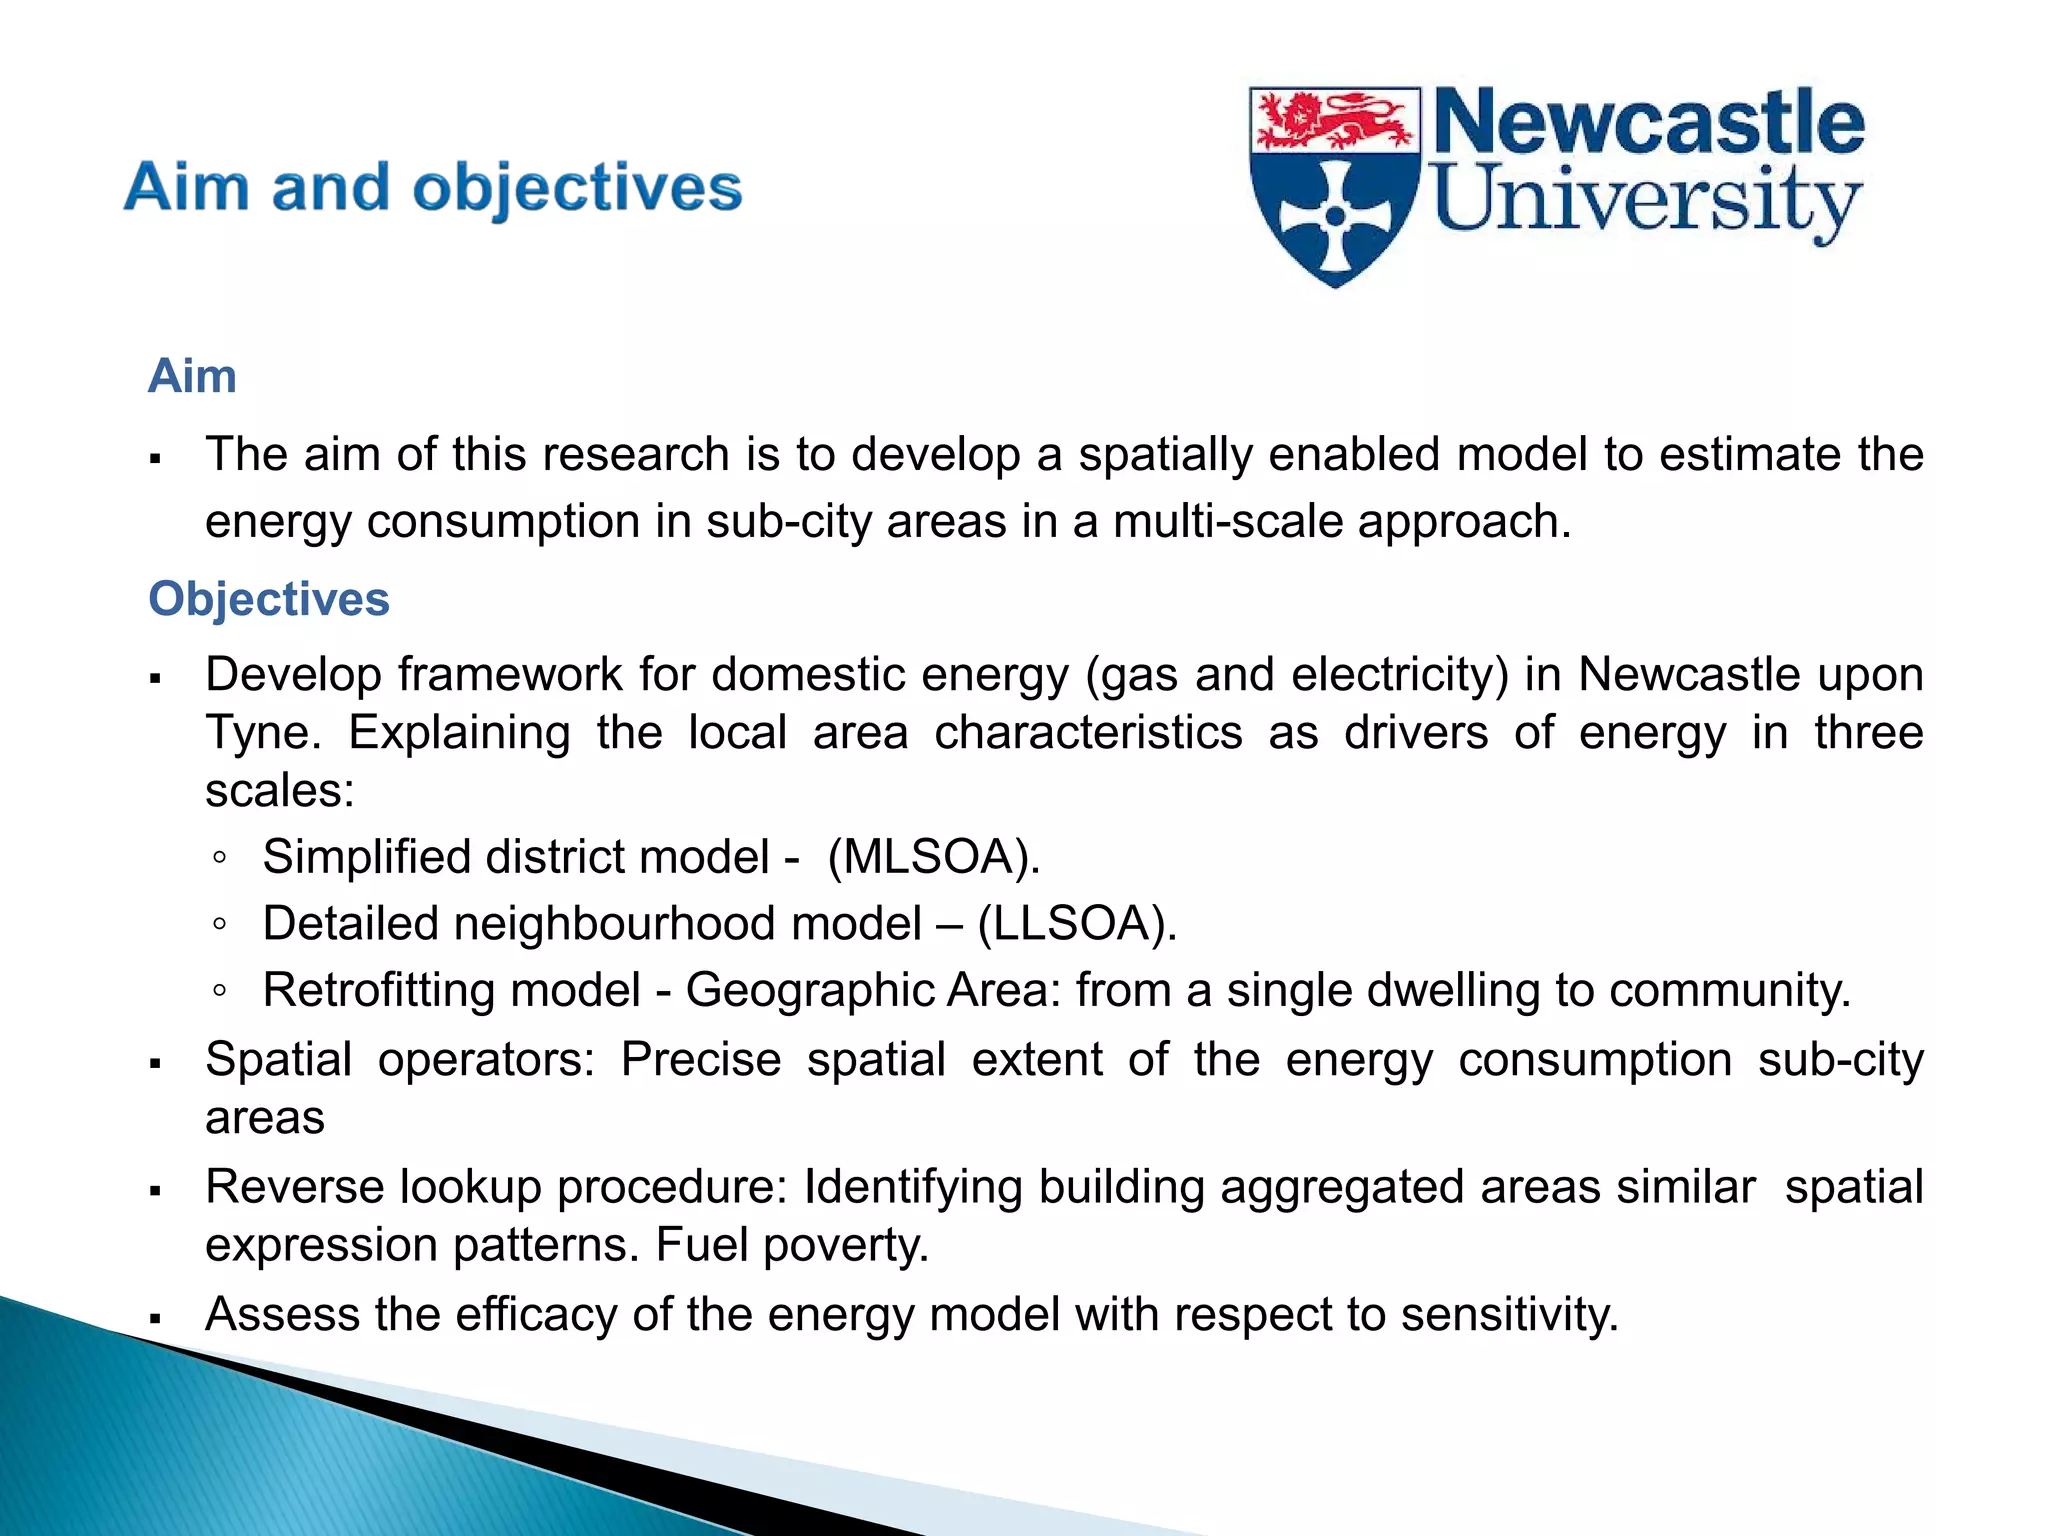
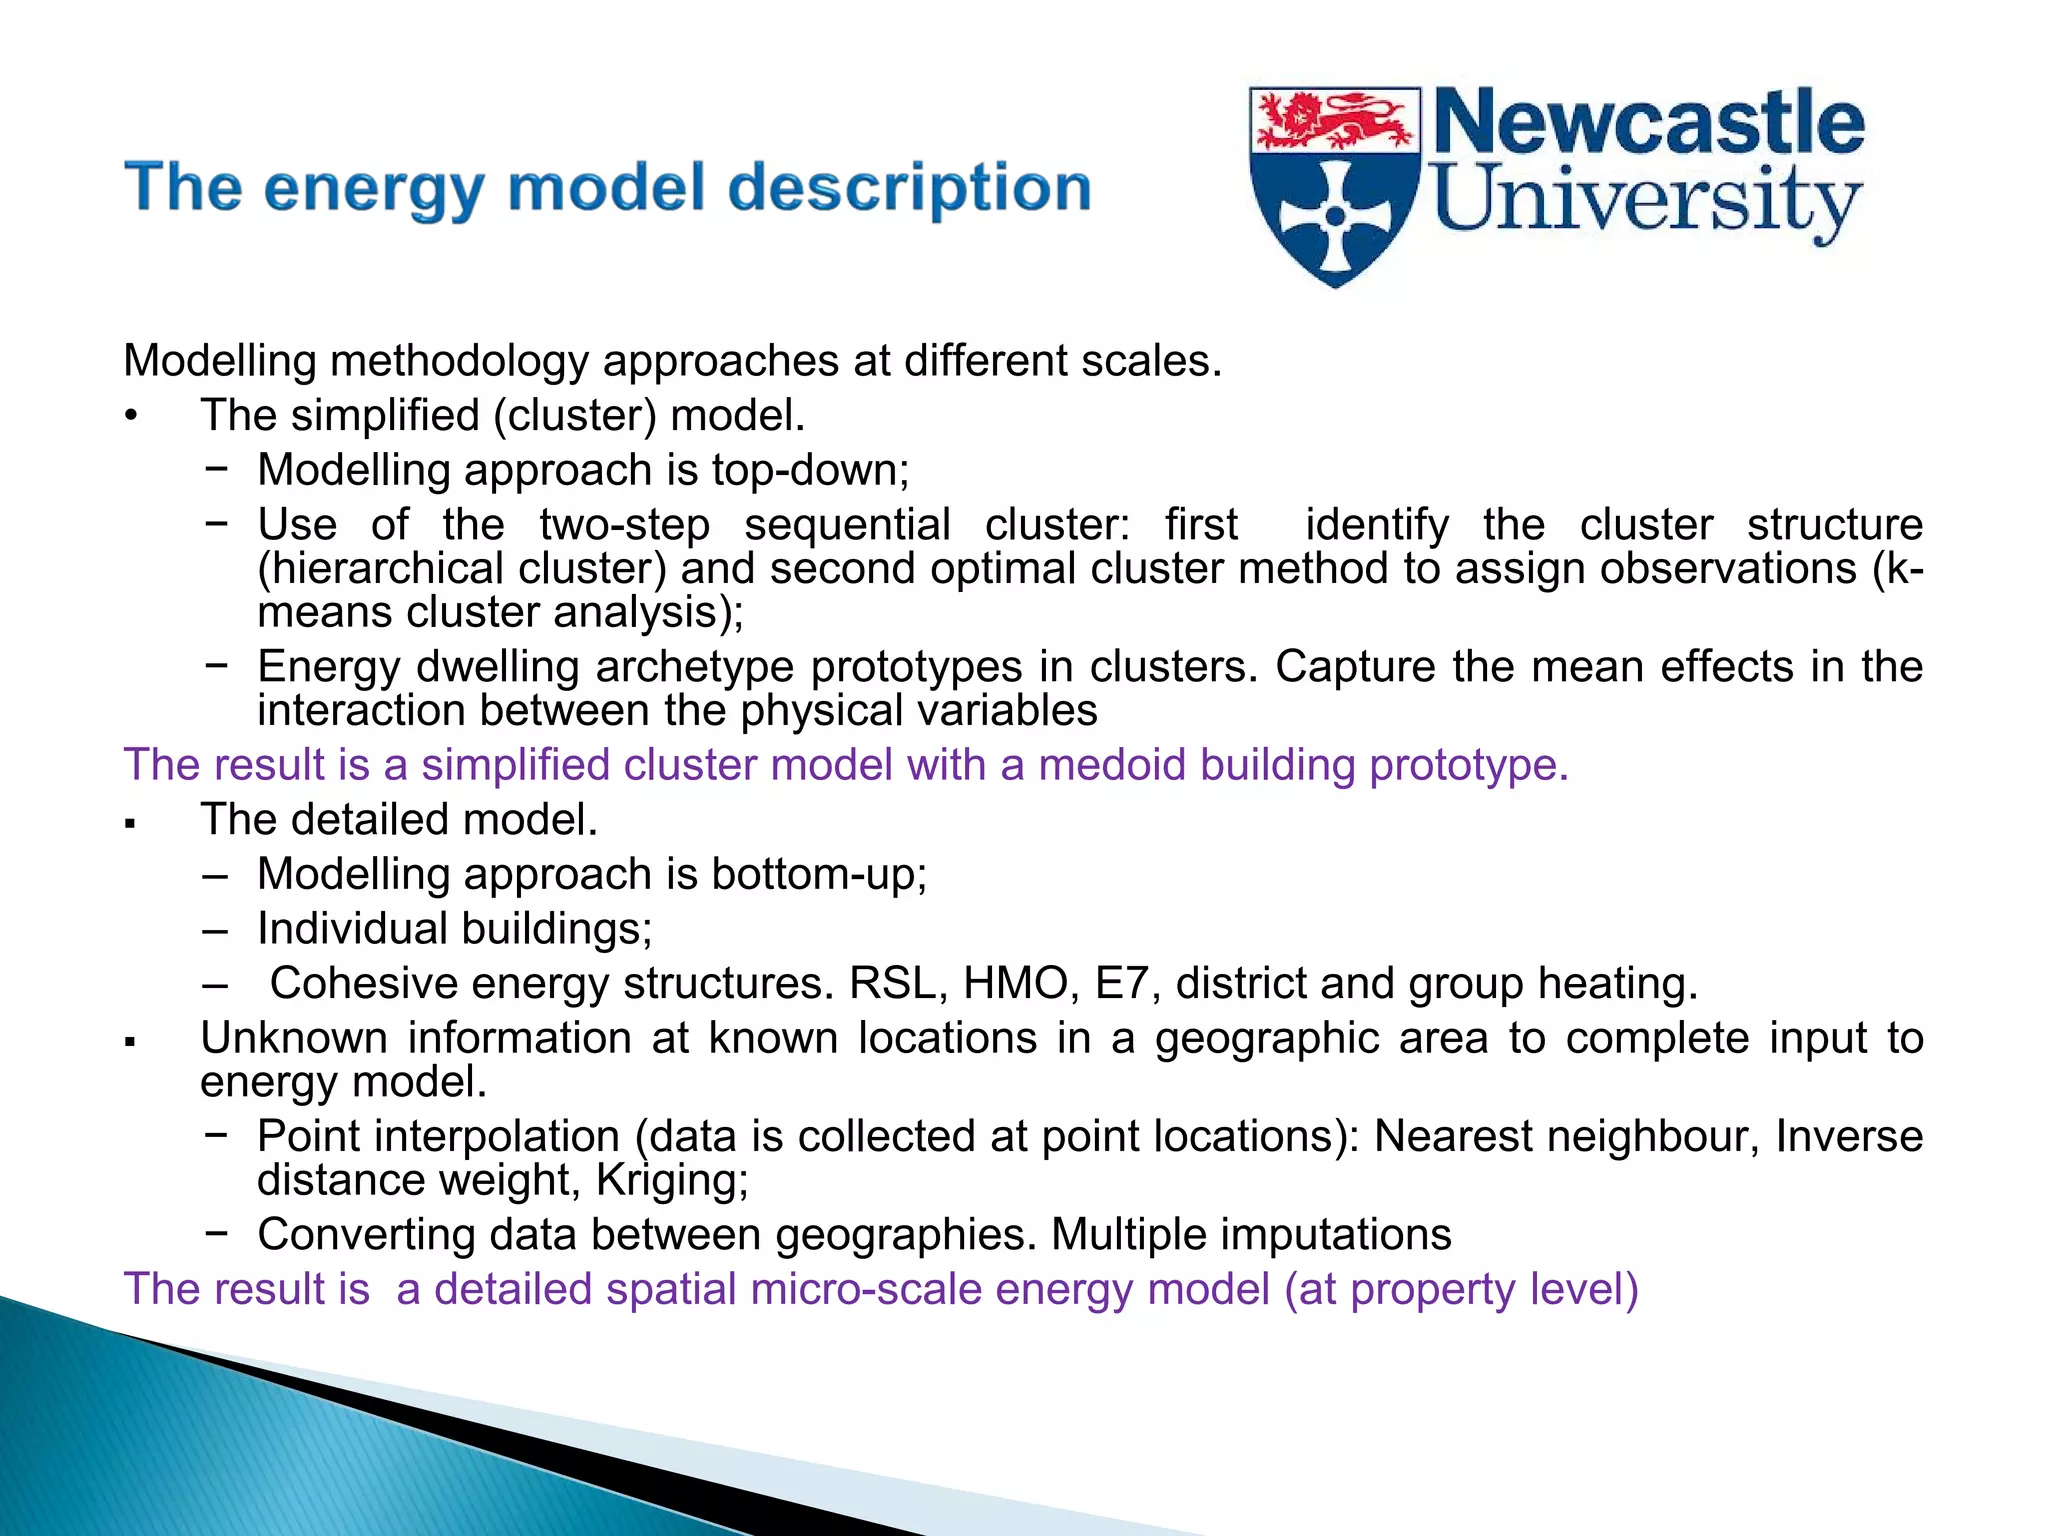
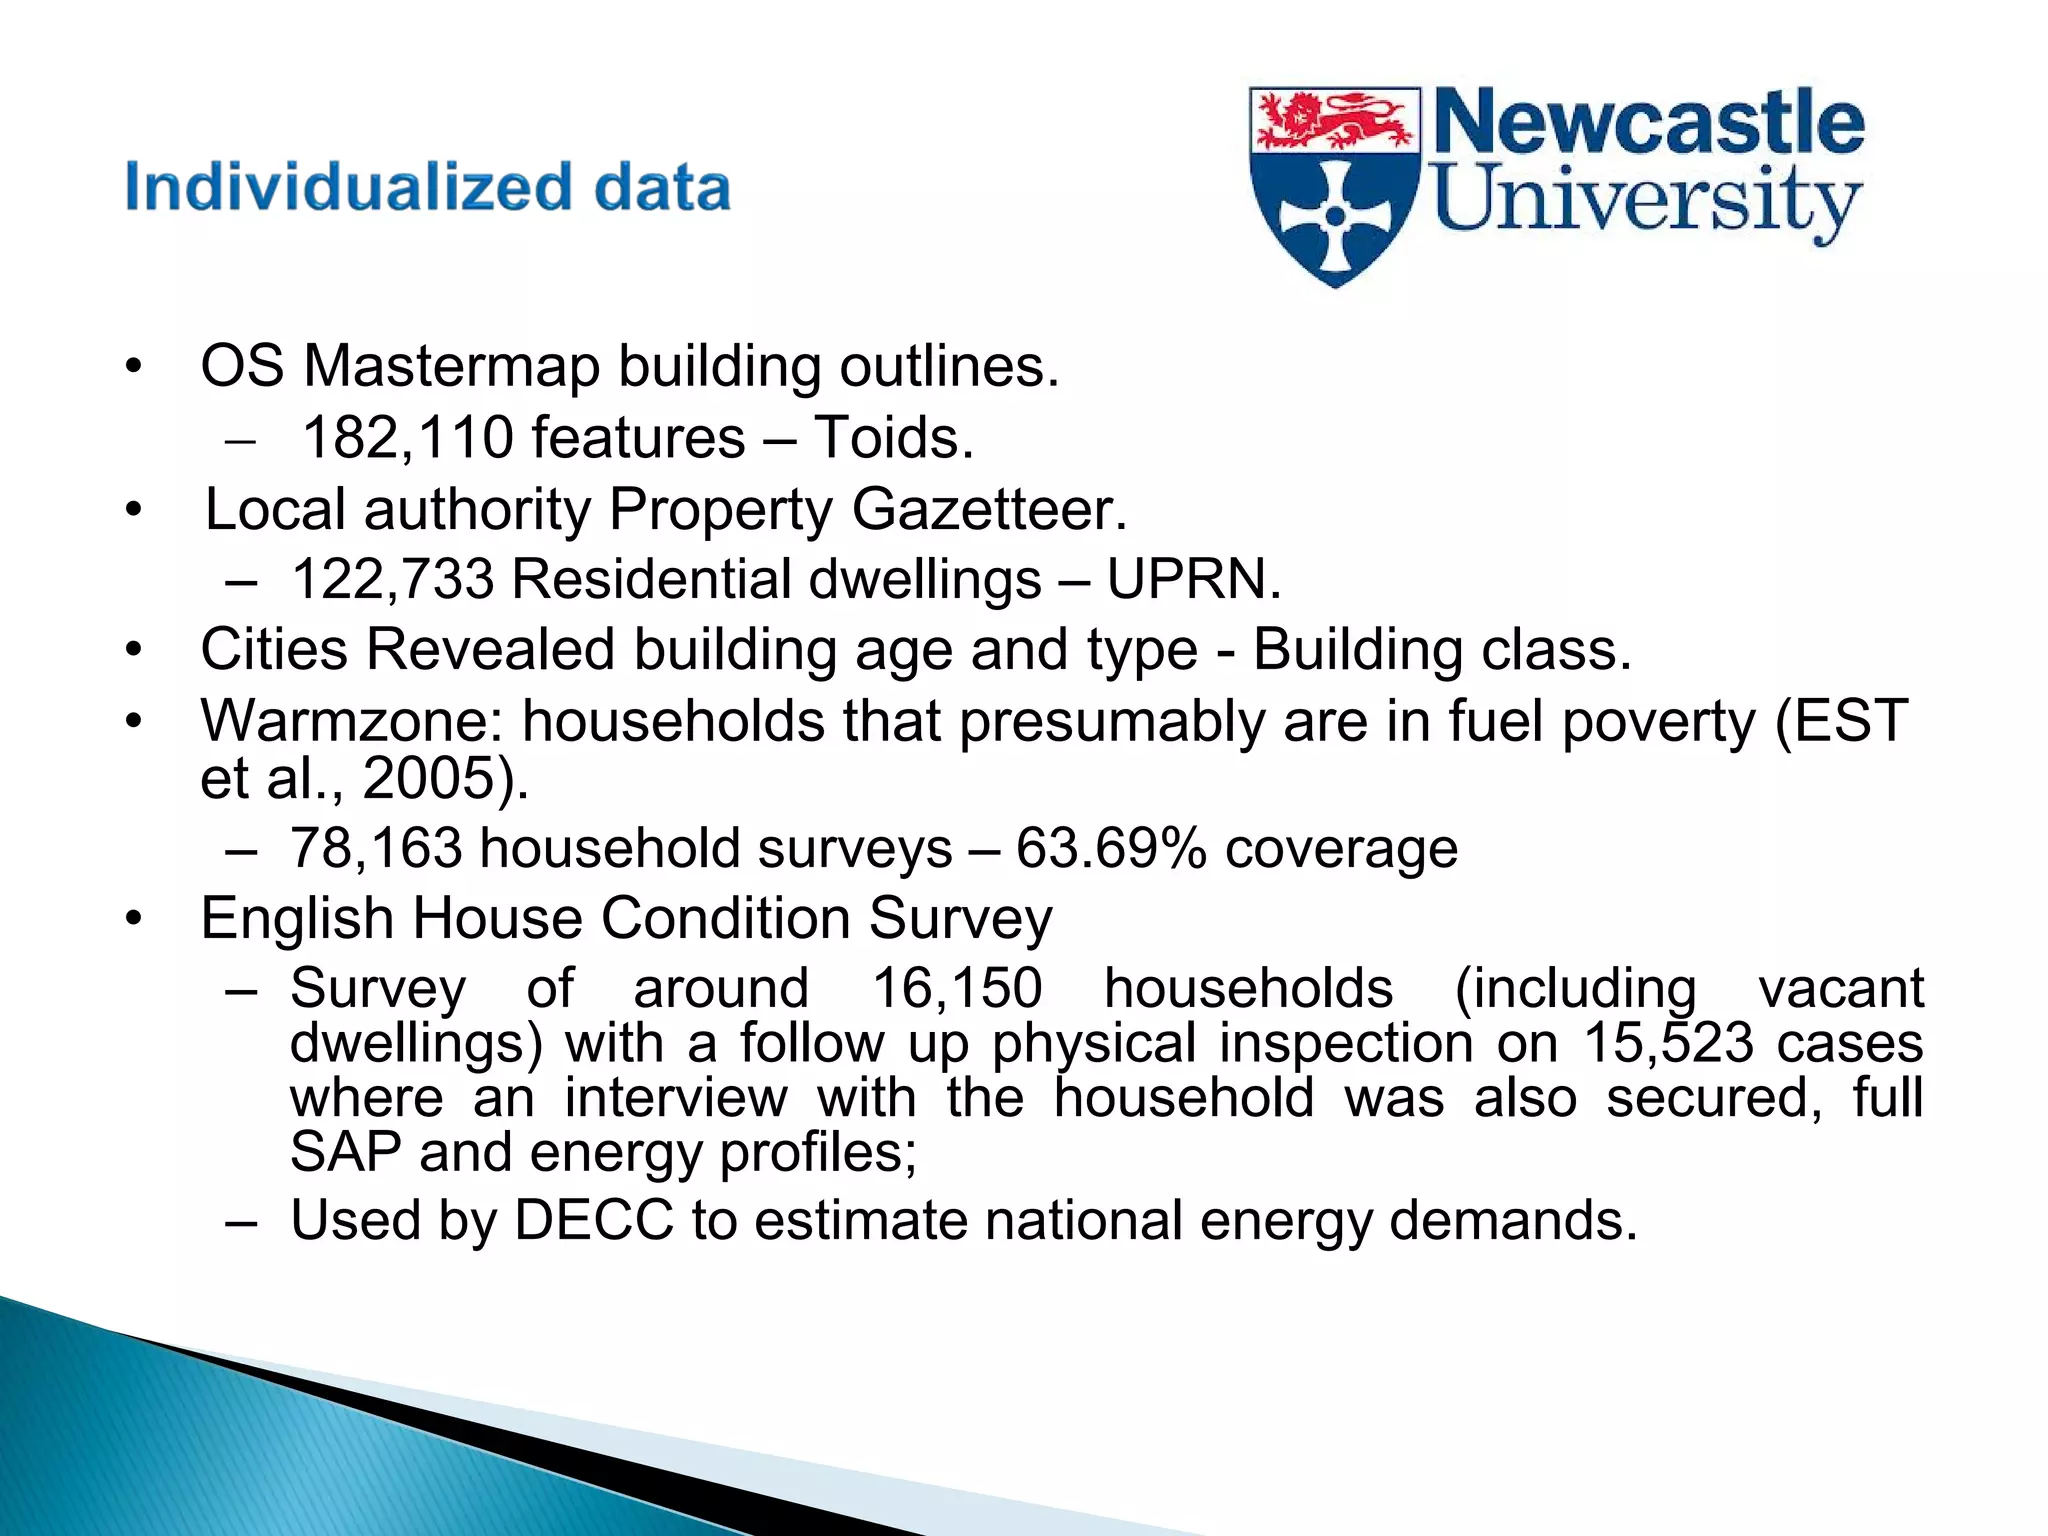
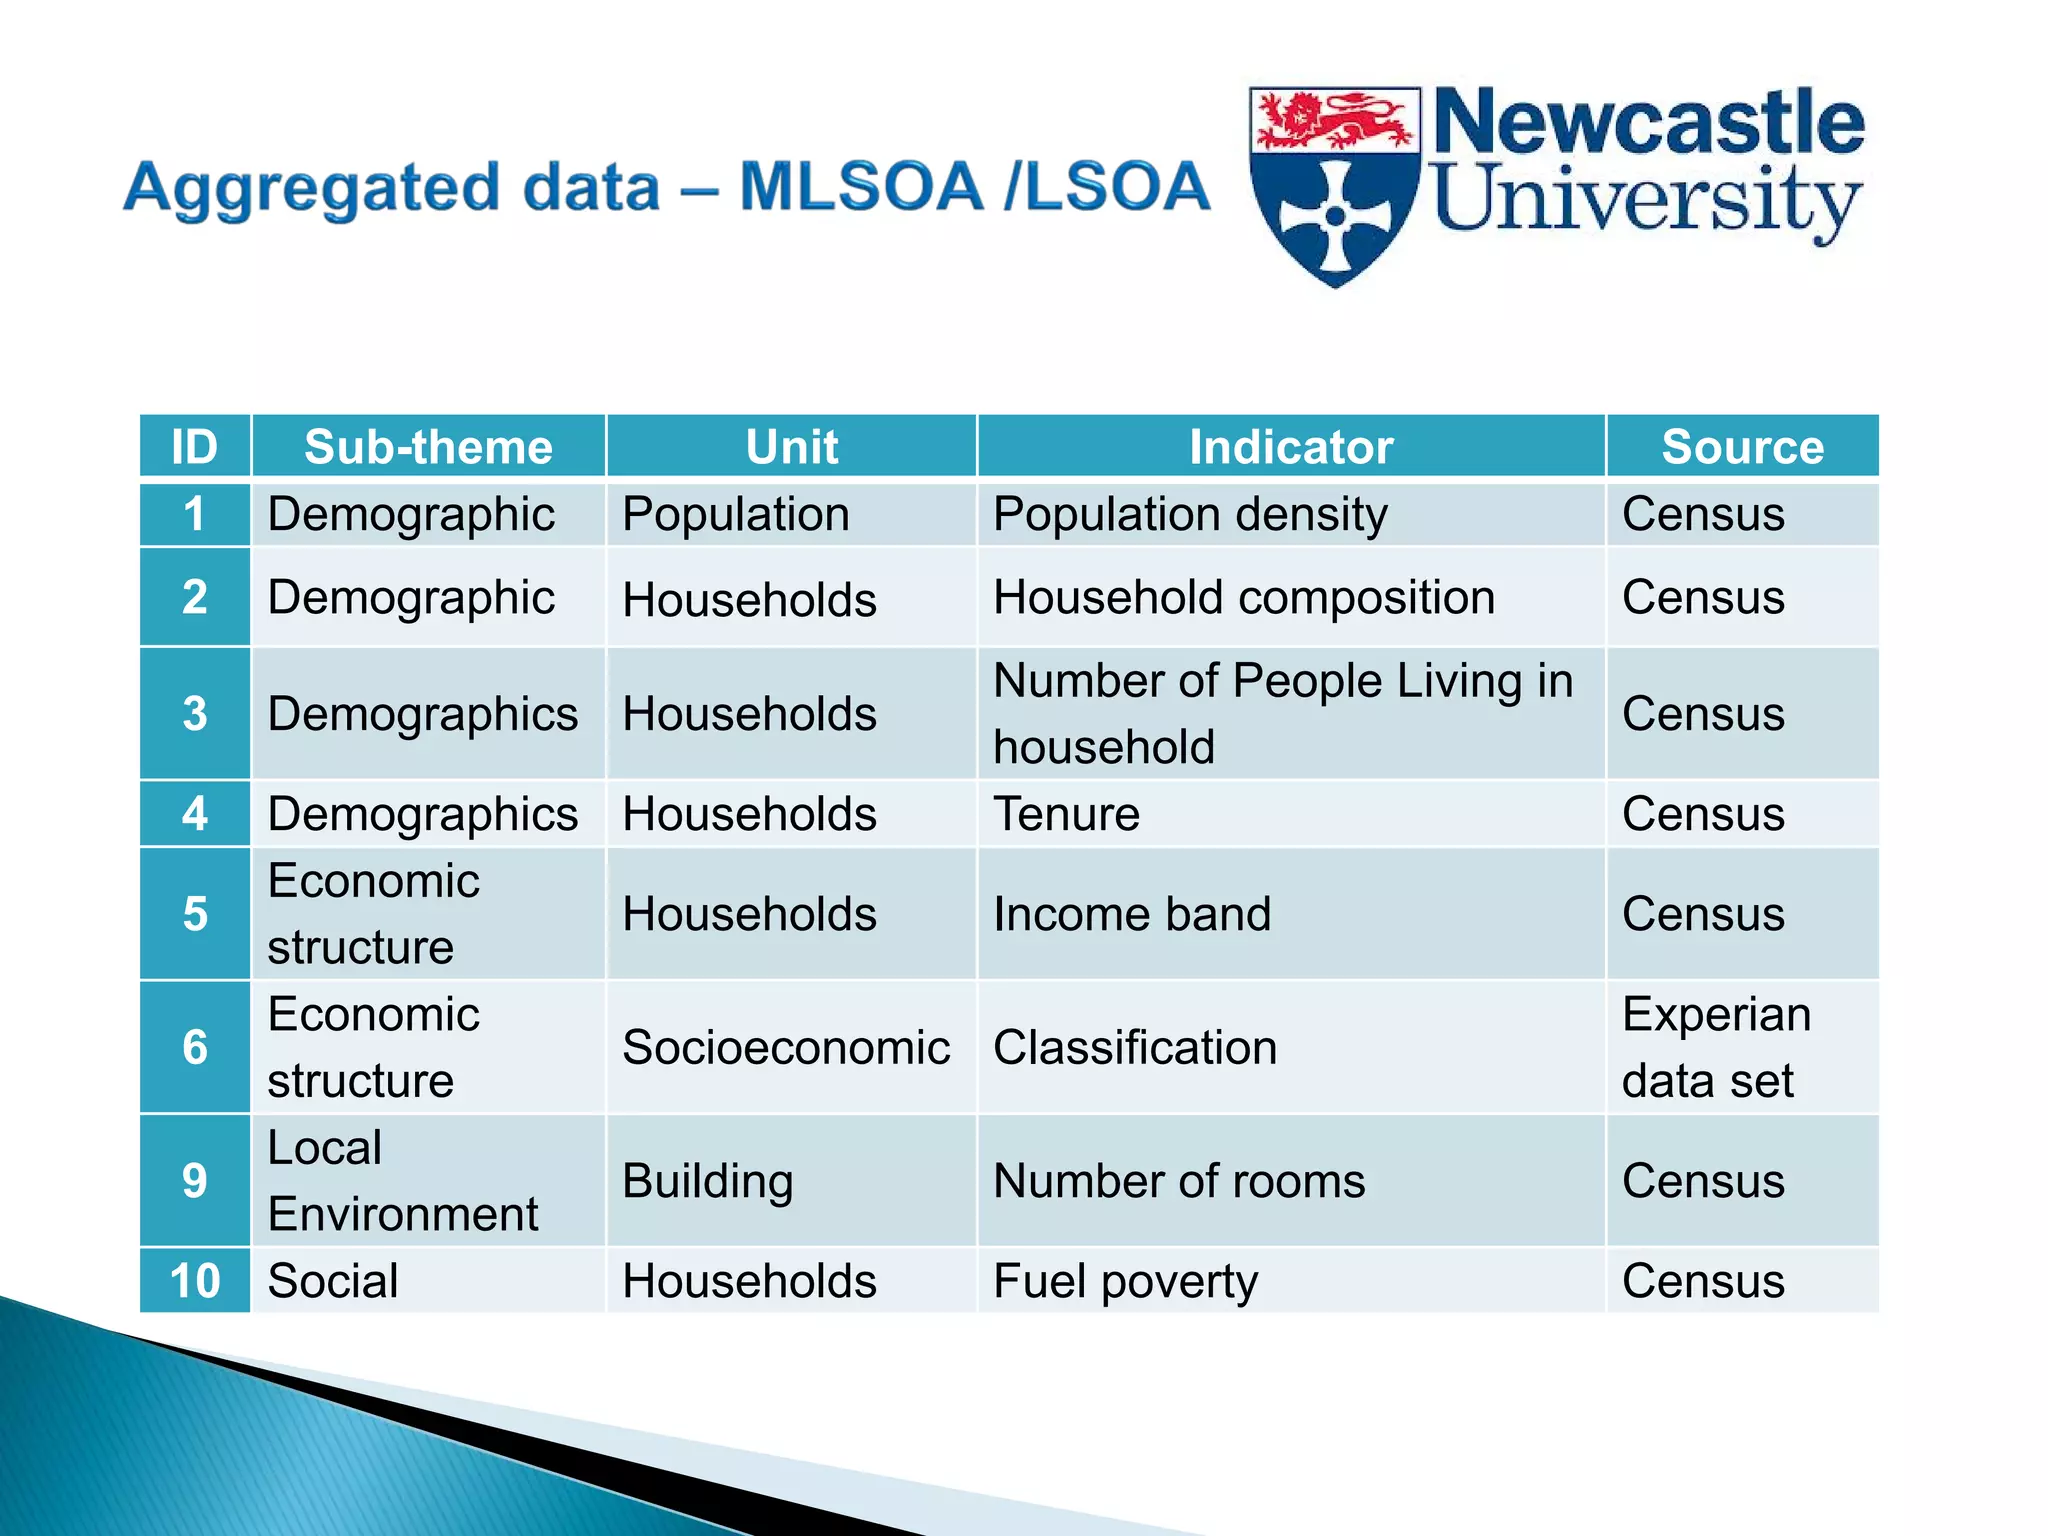
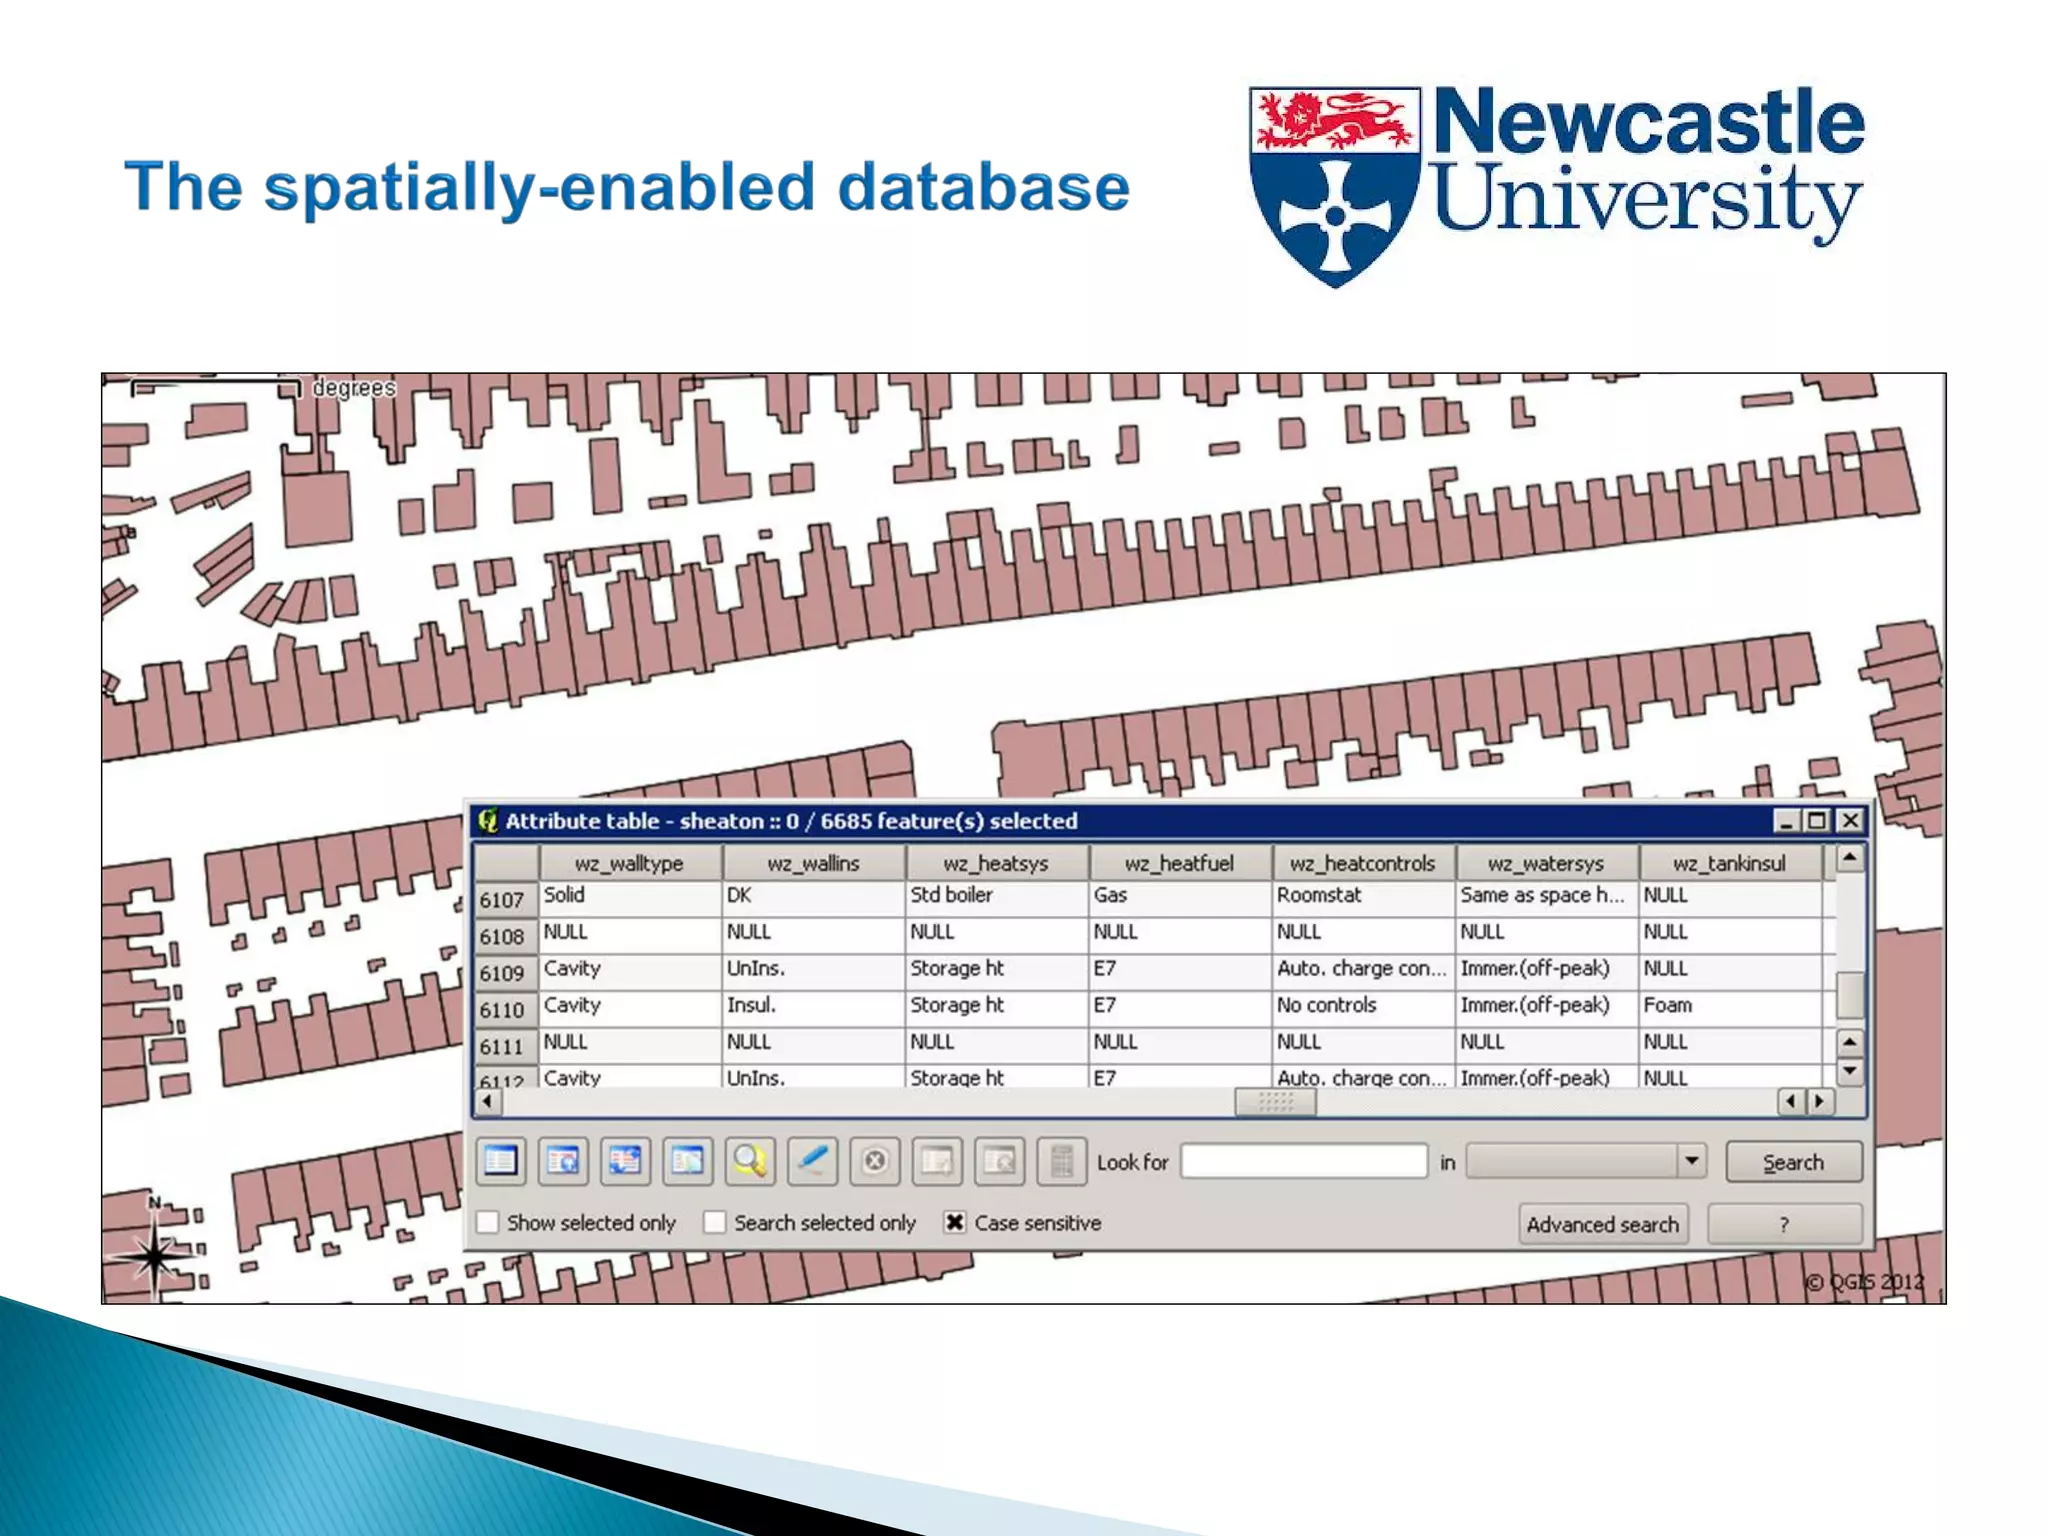
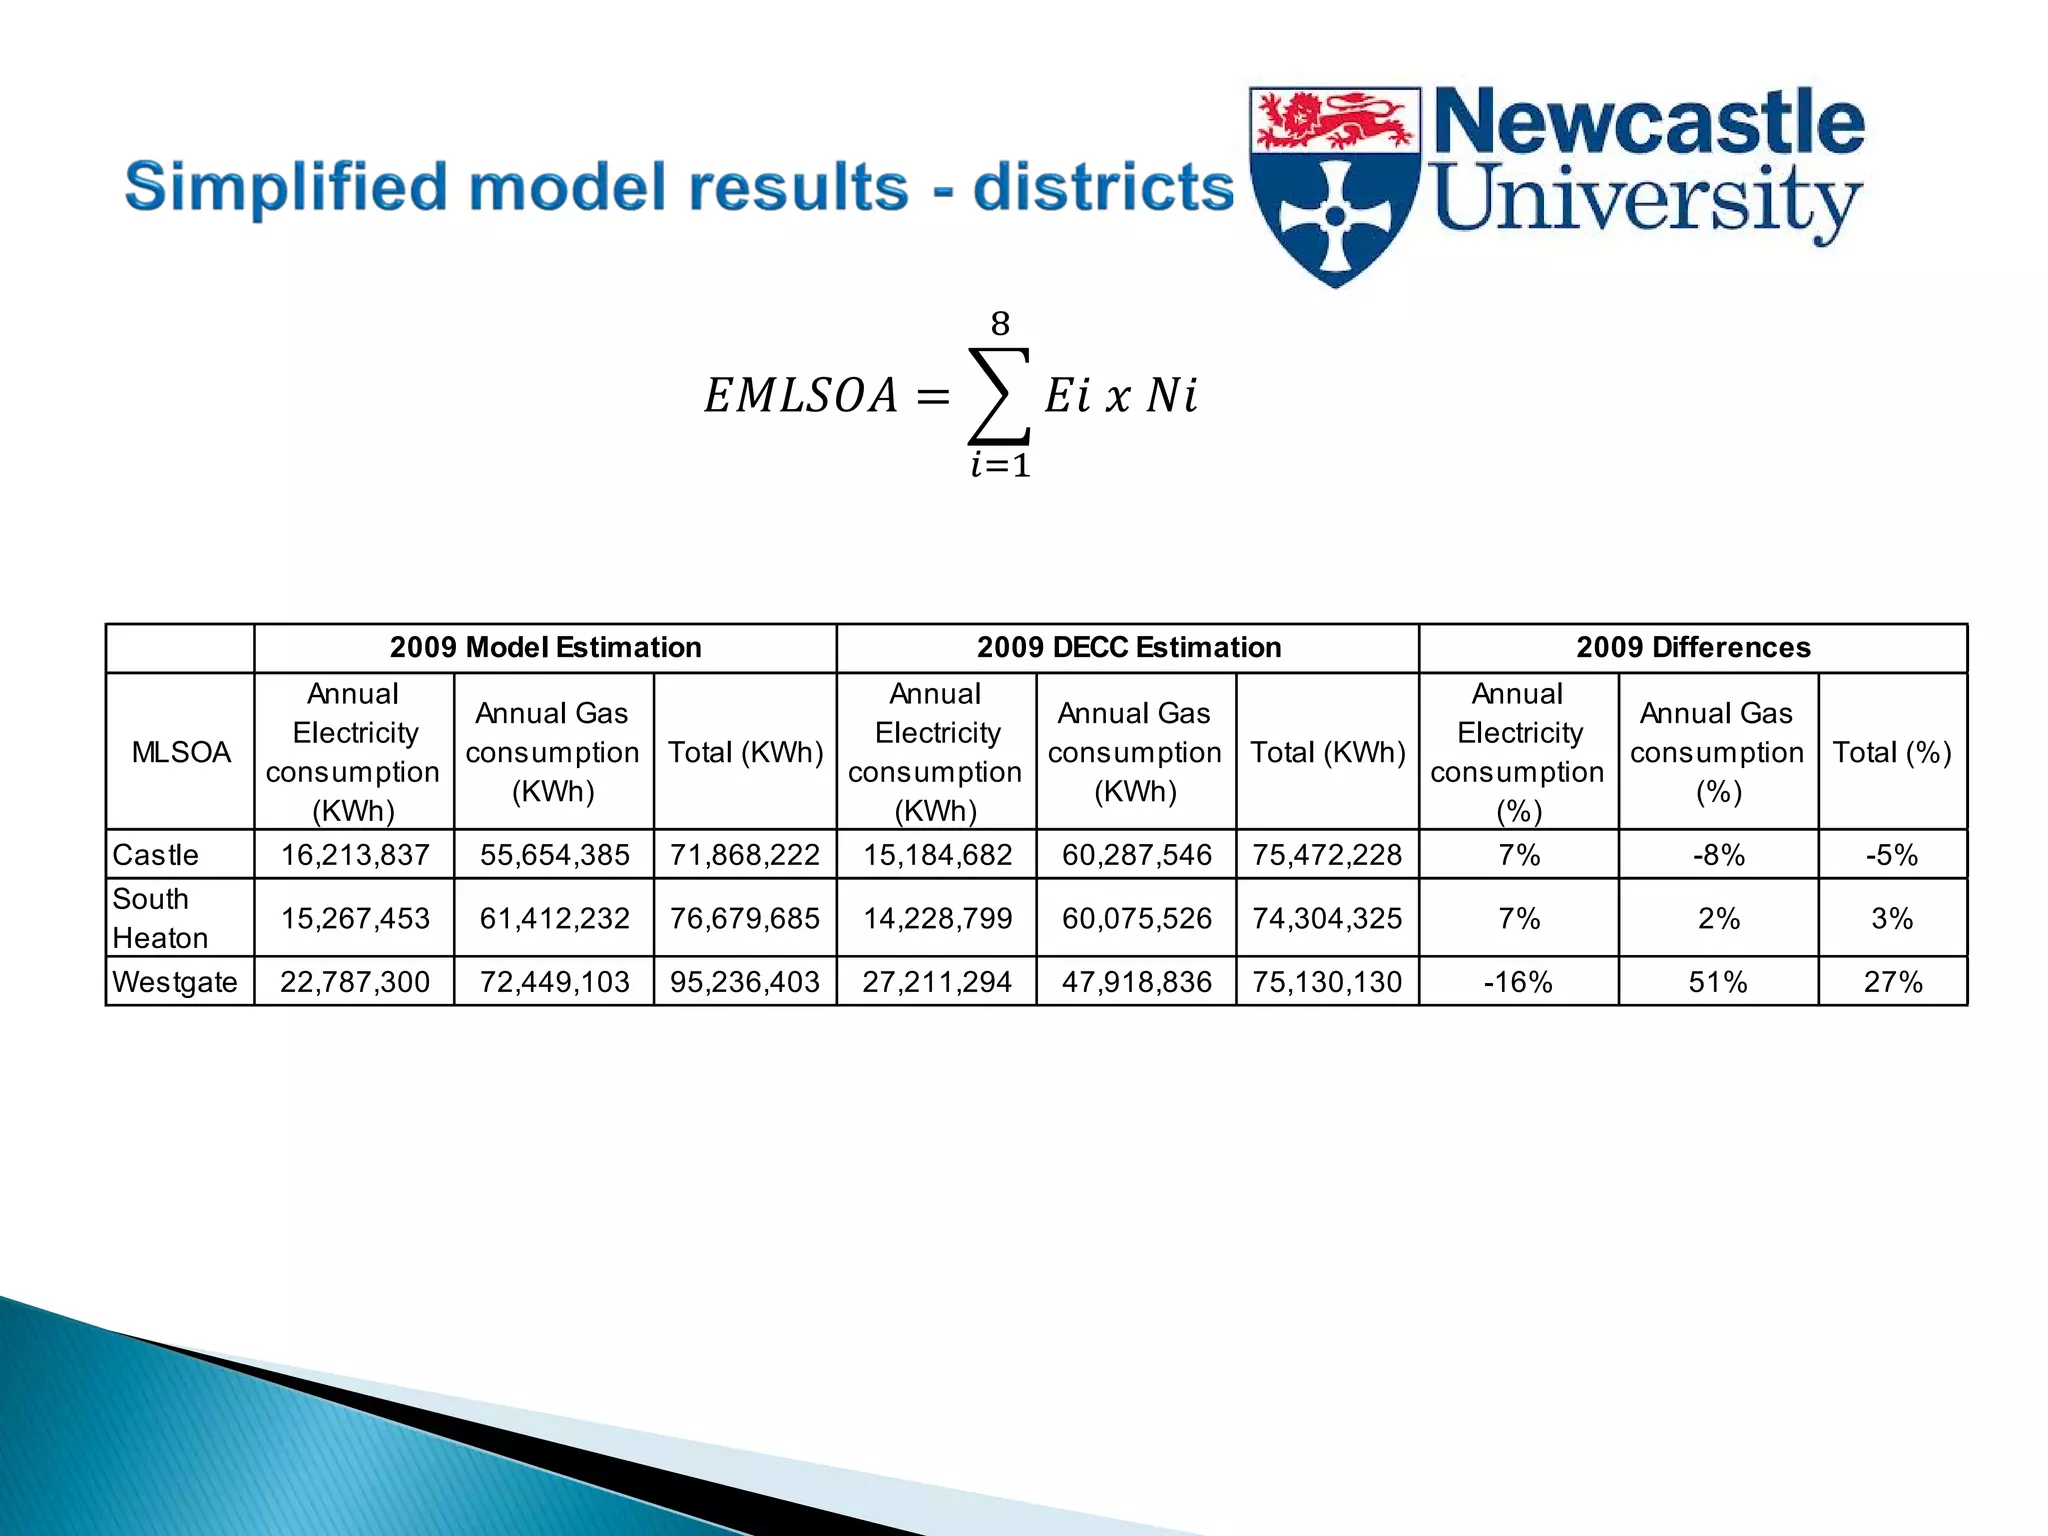
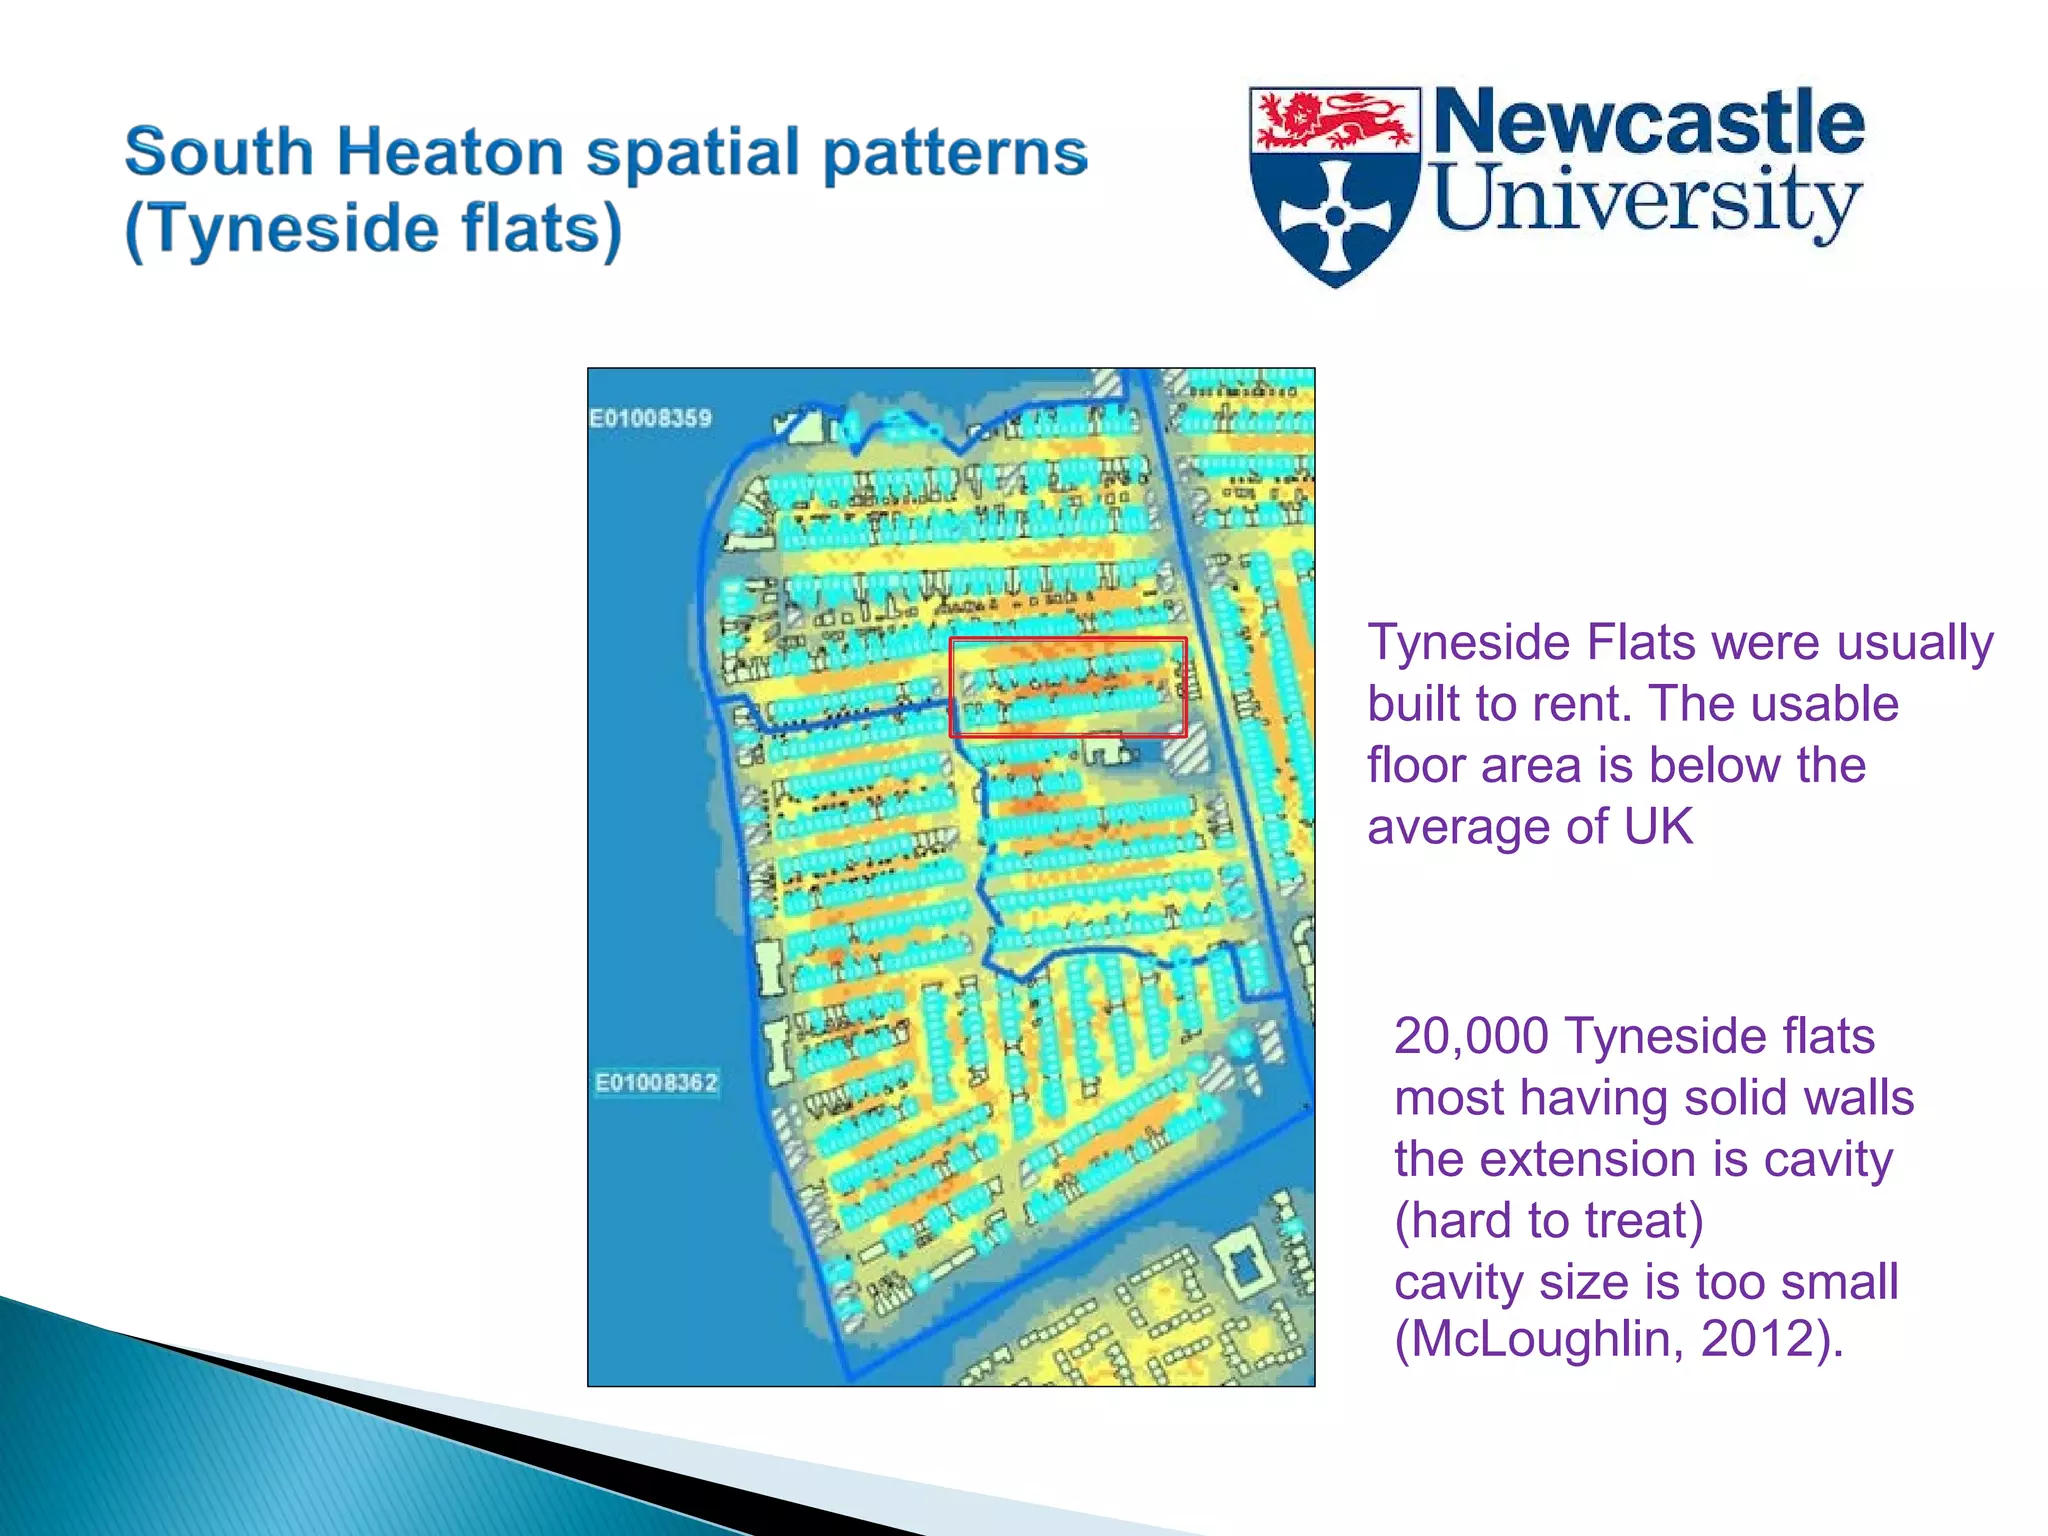
This document summarizes a PhD thesis on developing a spatially enabled model to estimate energy consumption in sub-city areas in Newcastle upon Tyne, England. The model estimates electricity and gas usage at multiple scales from districts down to individual properties. It analyzes factors like housing types, insulation levels, and socioeconomic characteristics that influence energy use. The model is evaluated against national energy estimates and shows varying accuracy depending on the homogeneity of the area studied. Insights from the analysis can help inform local energy and climate policies.


