Download to read offline
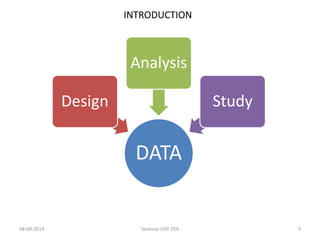
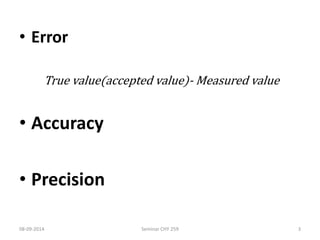
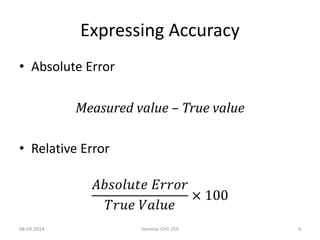
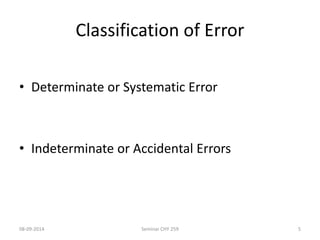
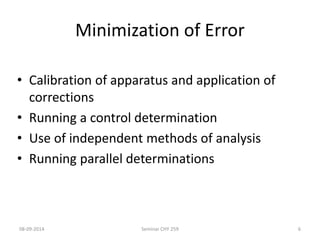
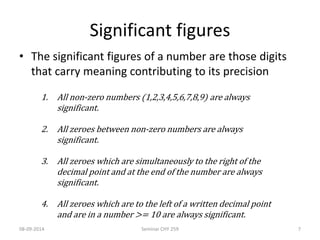
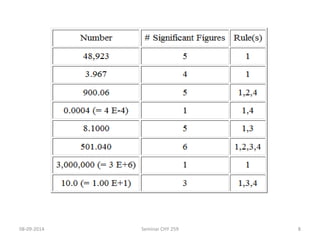
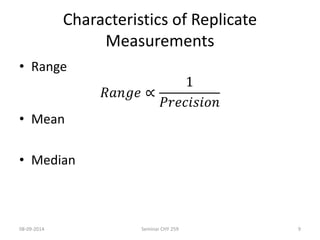
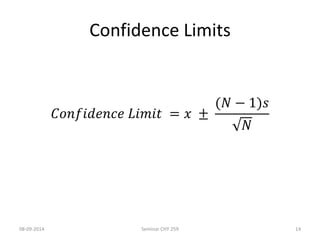
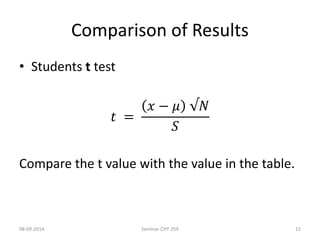
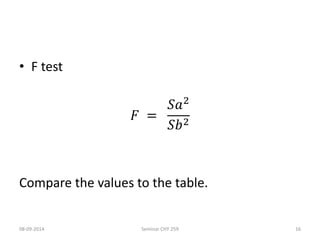


The document discusses error analysis and minimization, defining accuracy and precision, and classifying errors into determinate and indeterminate types. It outlines methods to minimize errors, such as calibration and parallel determinations, as well as statistical tools for data rejection and confidence limits. Additionally, it covers significant figures, characteristics of replicate measurements, and tests like Dixon's q test and the t-test for comparing results.