Download as PDF, PPTX

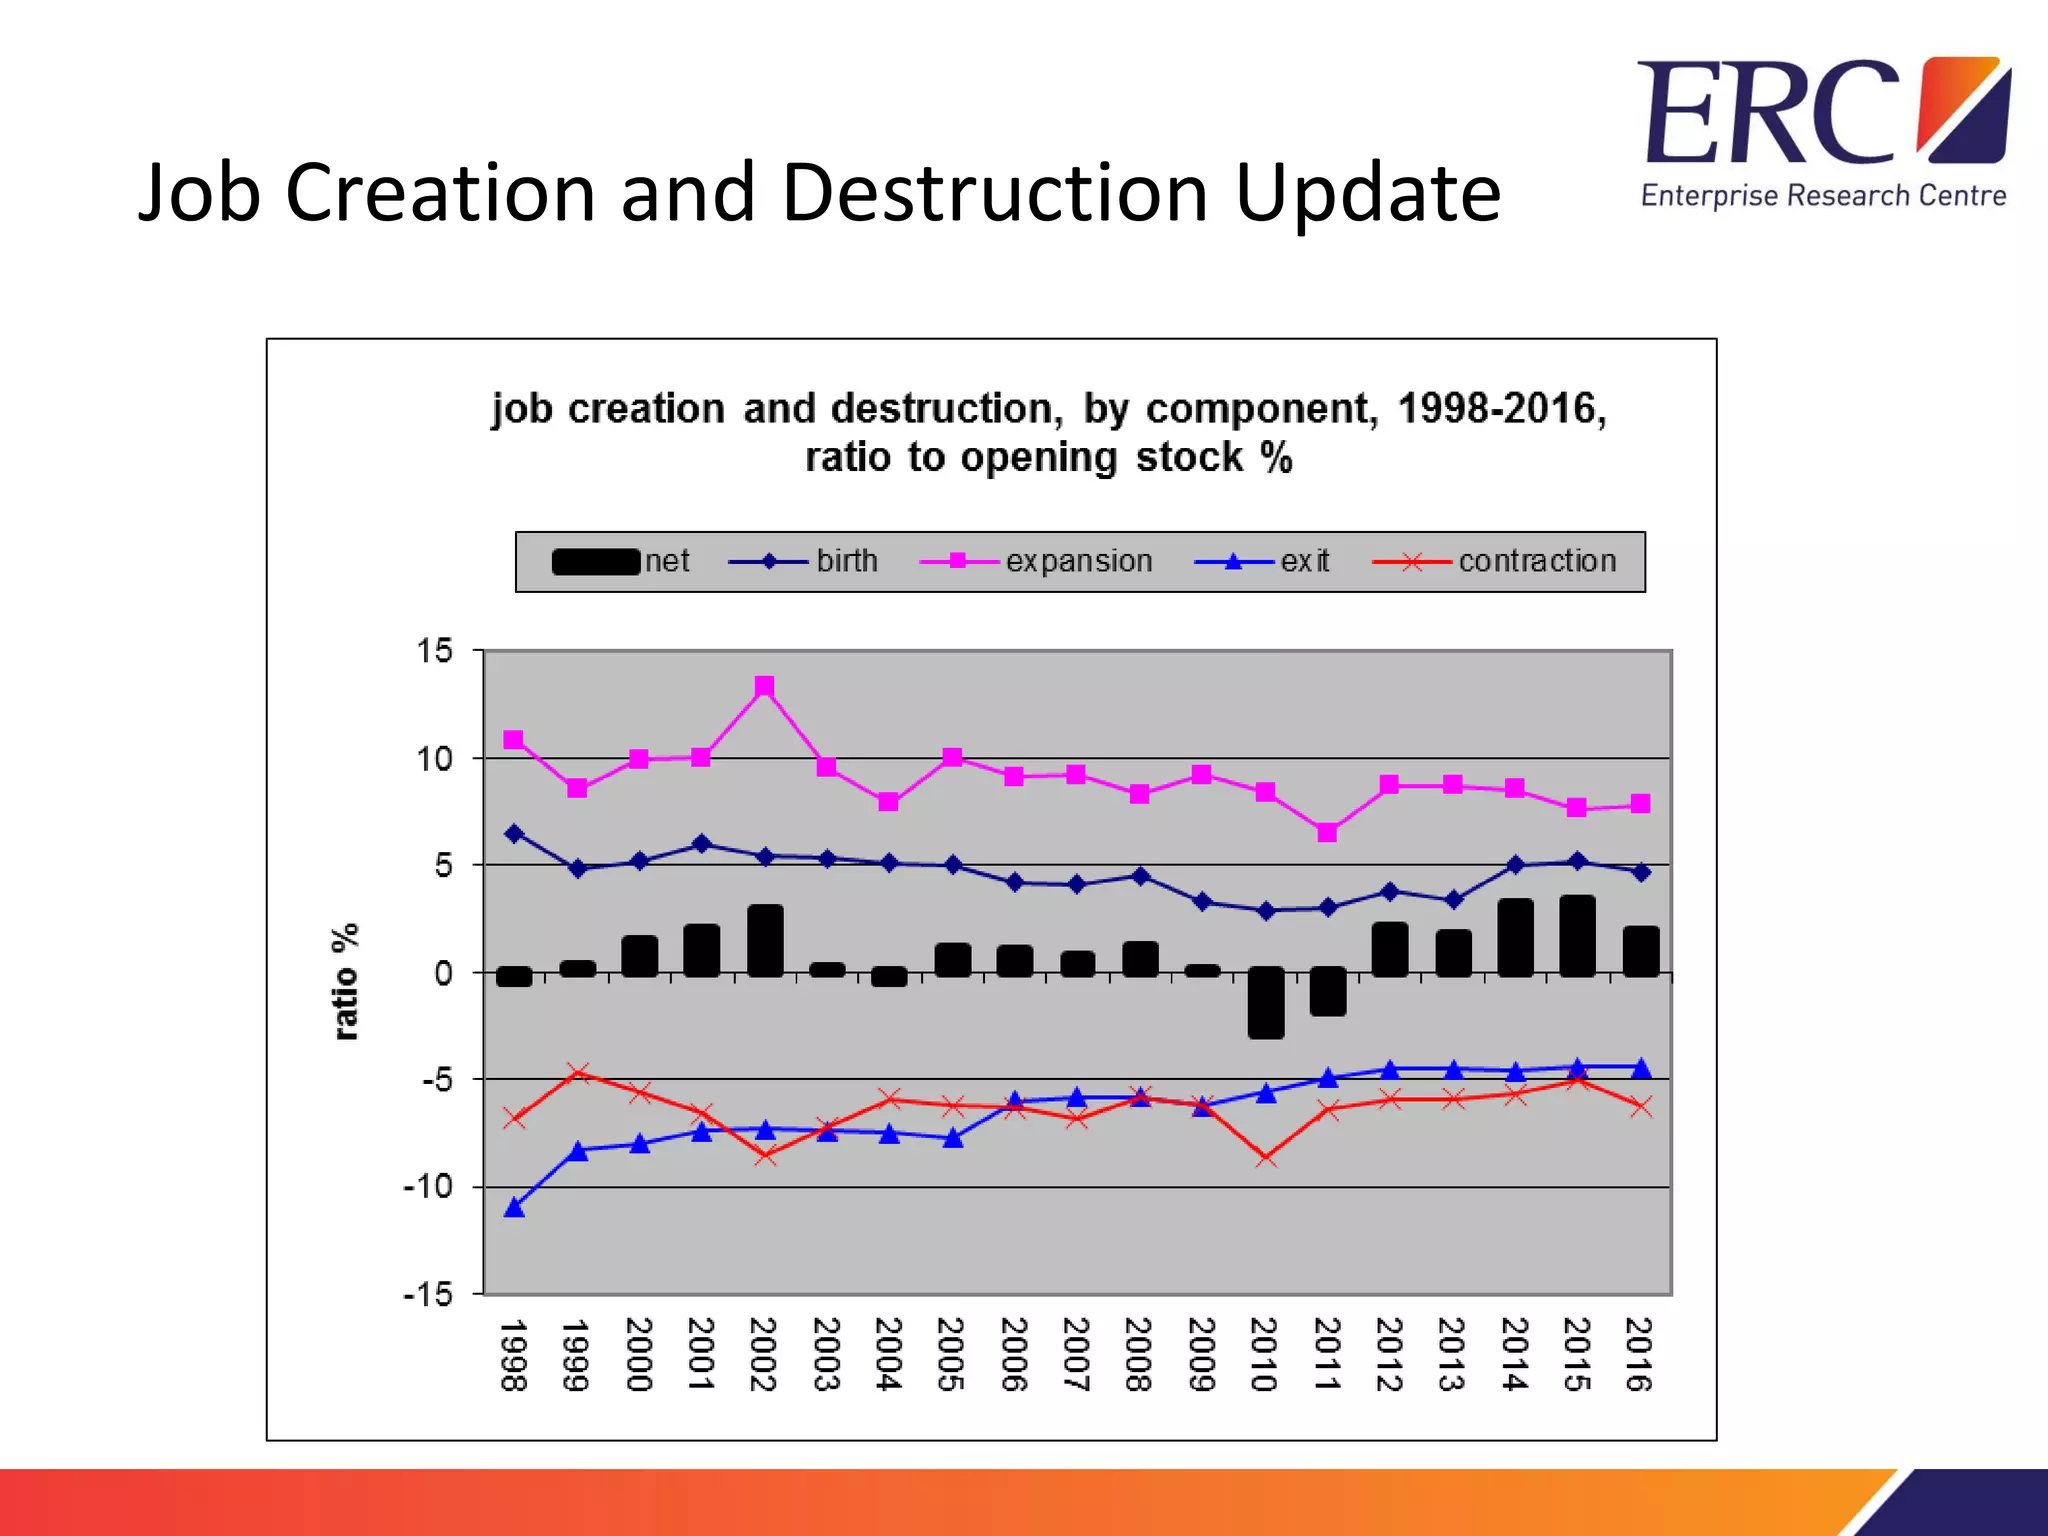
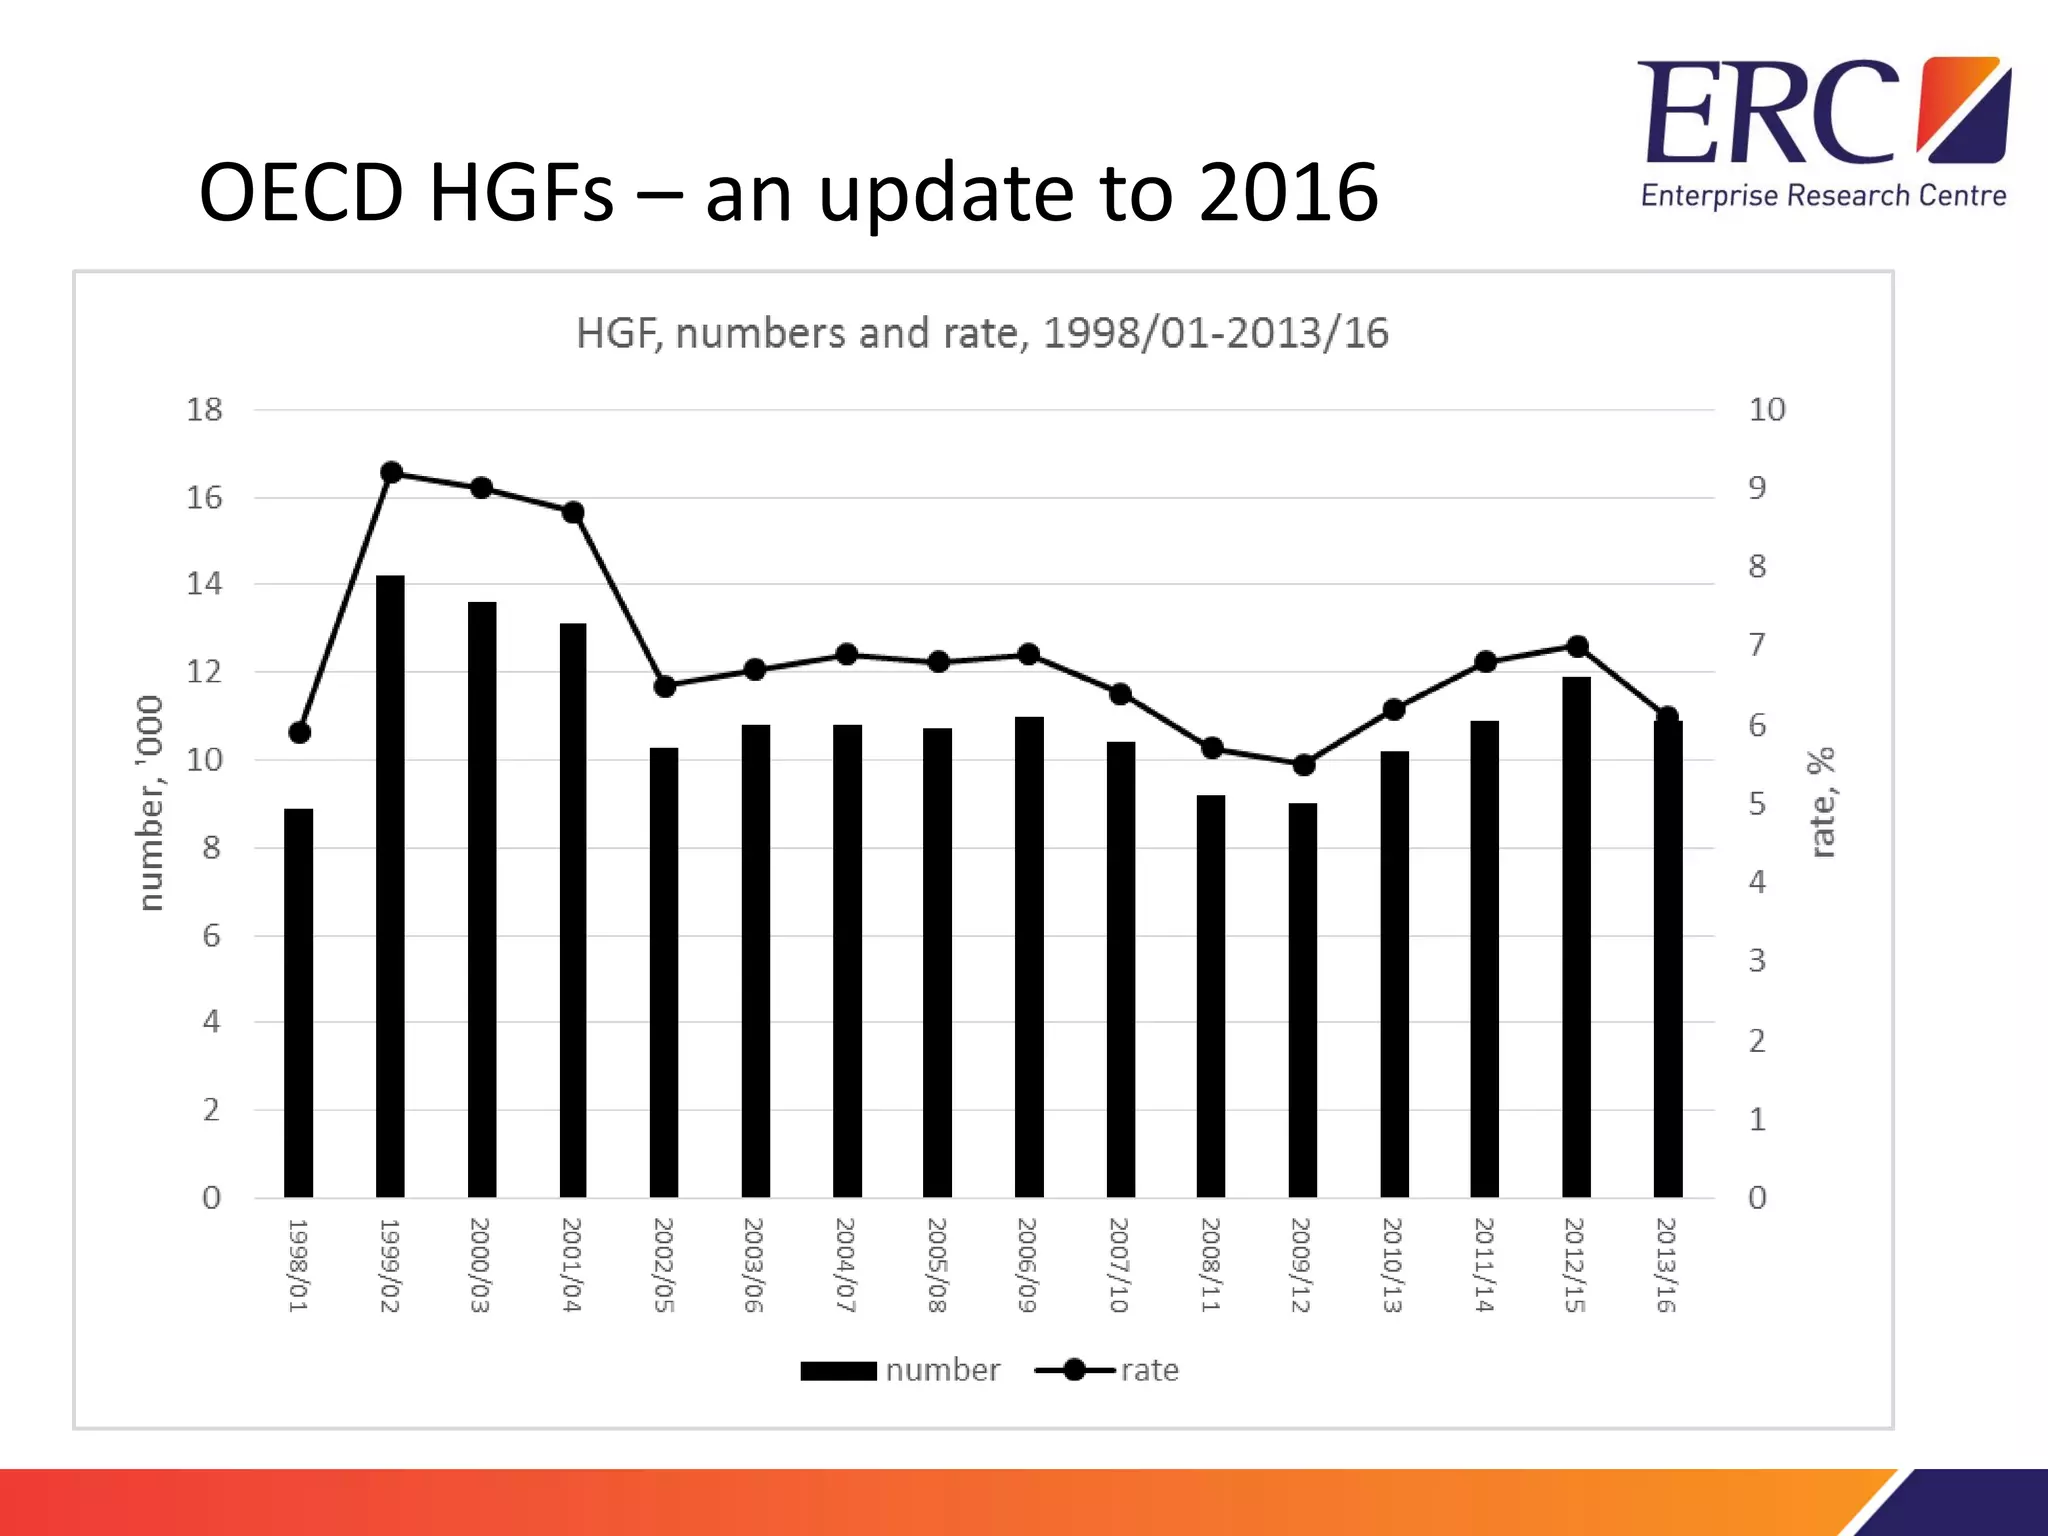
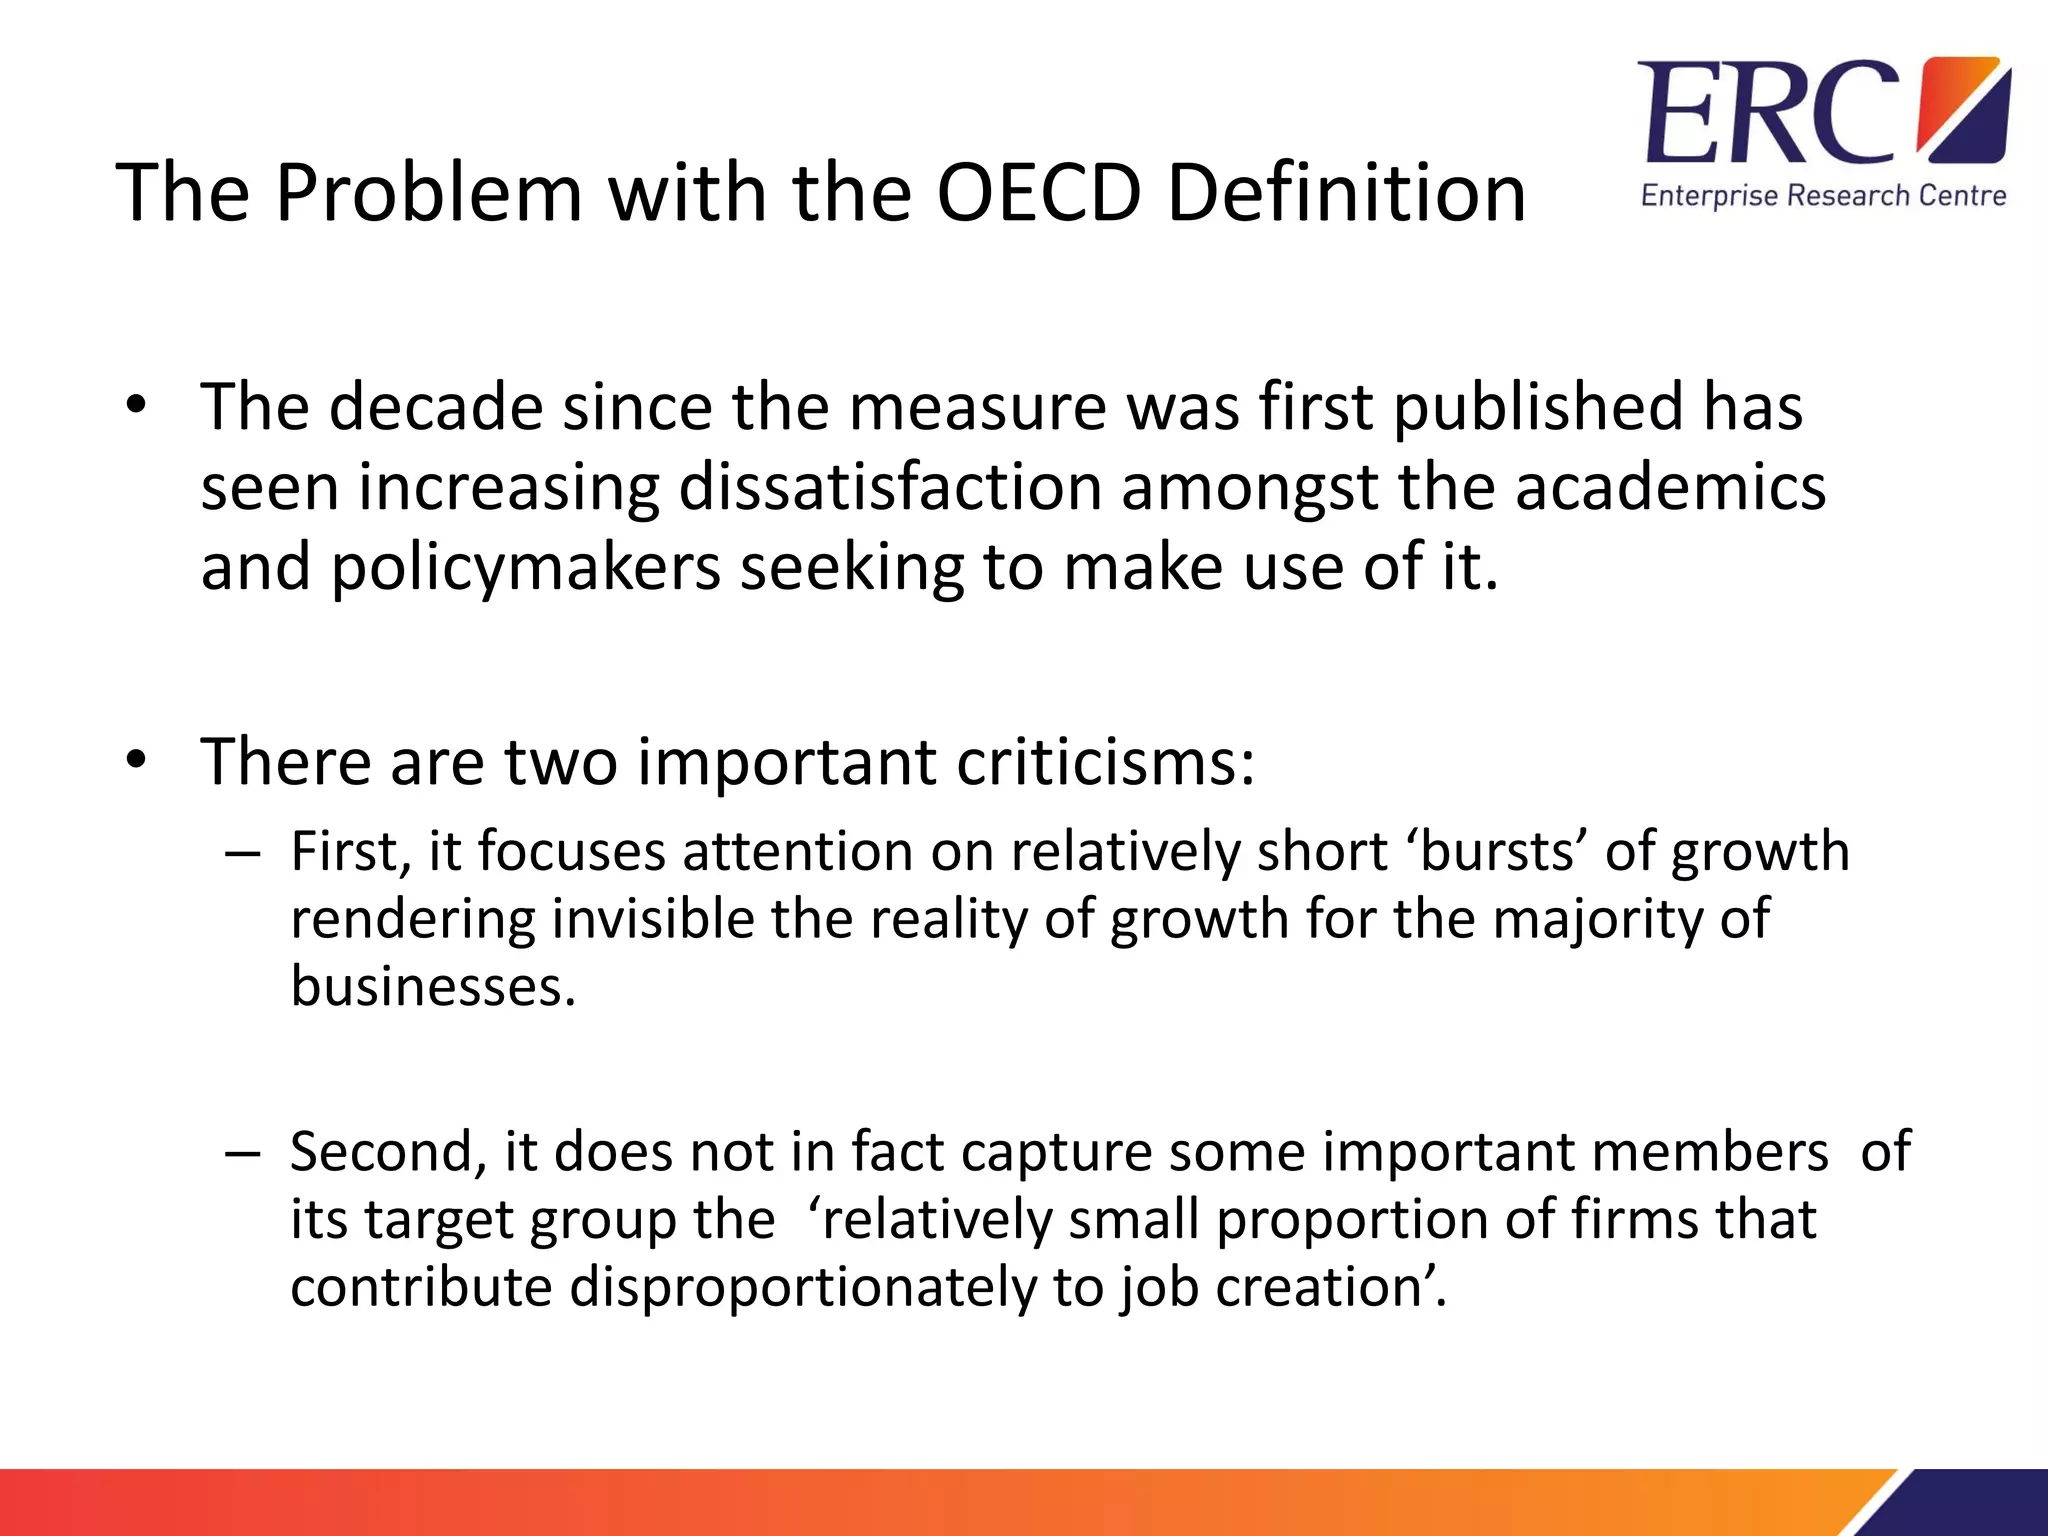
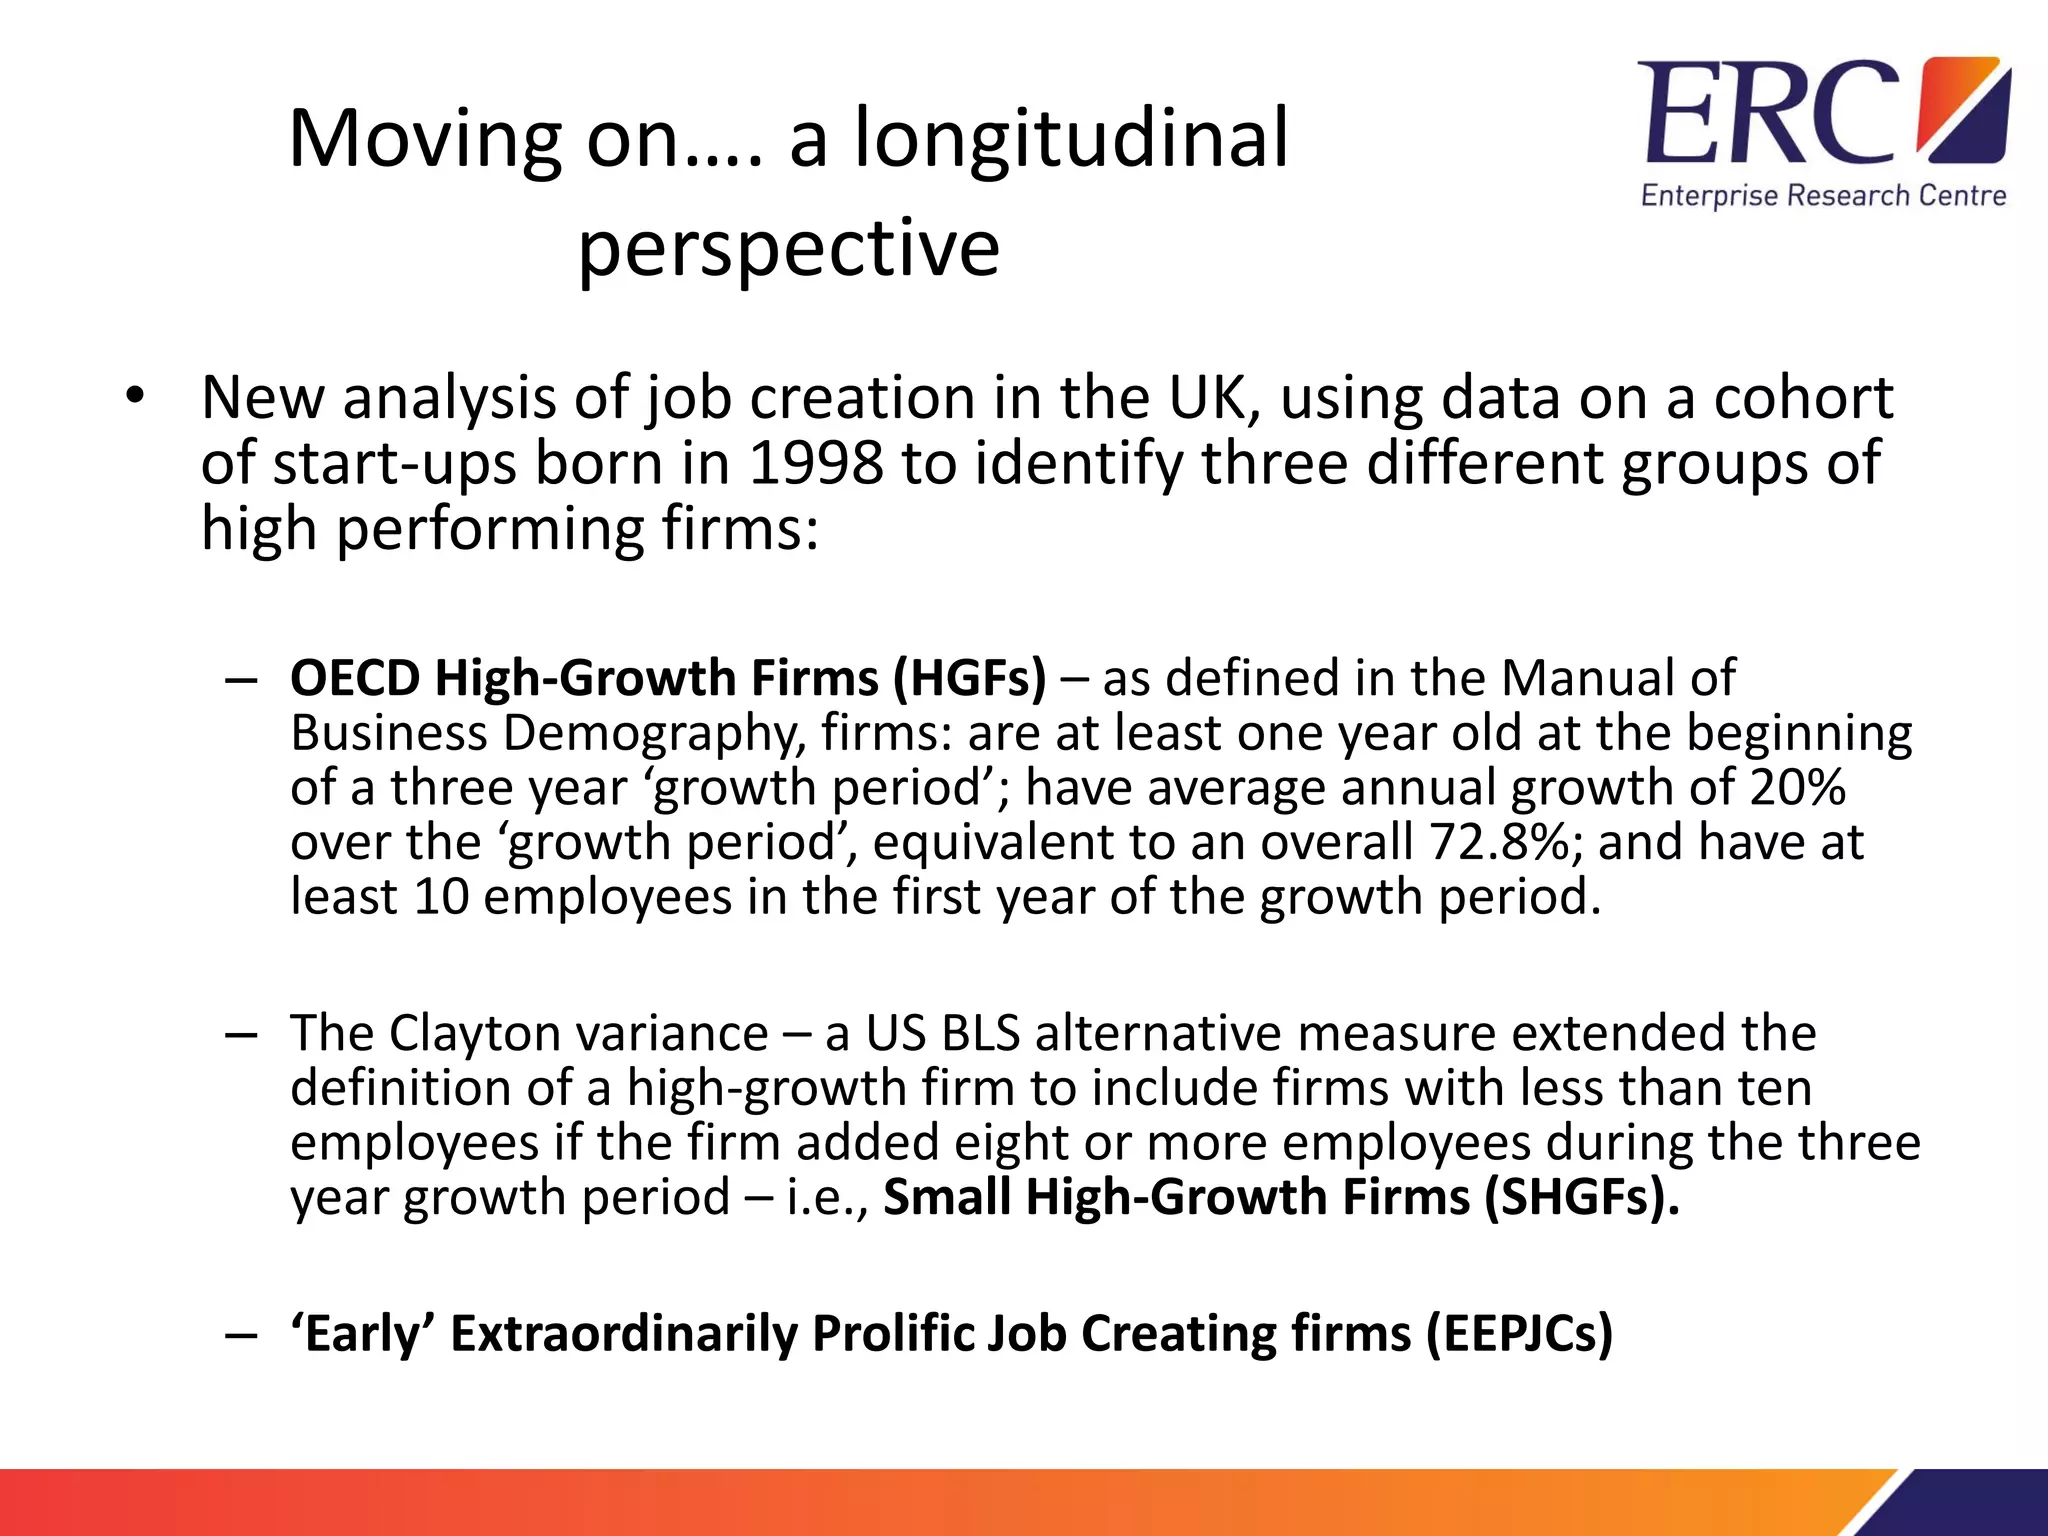
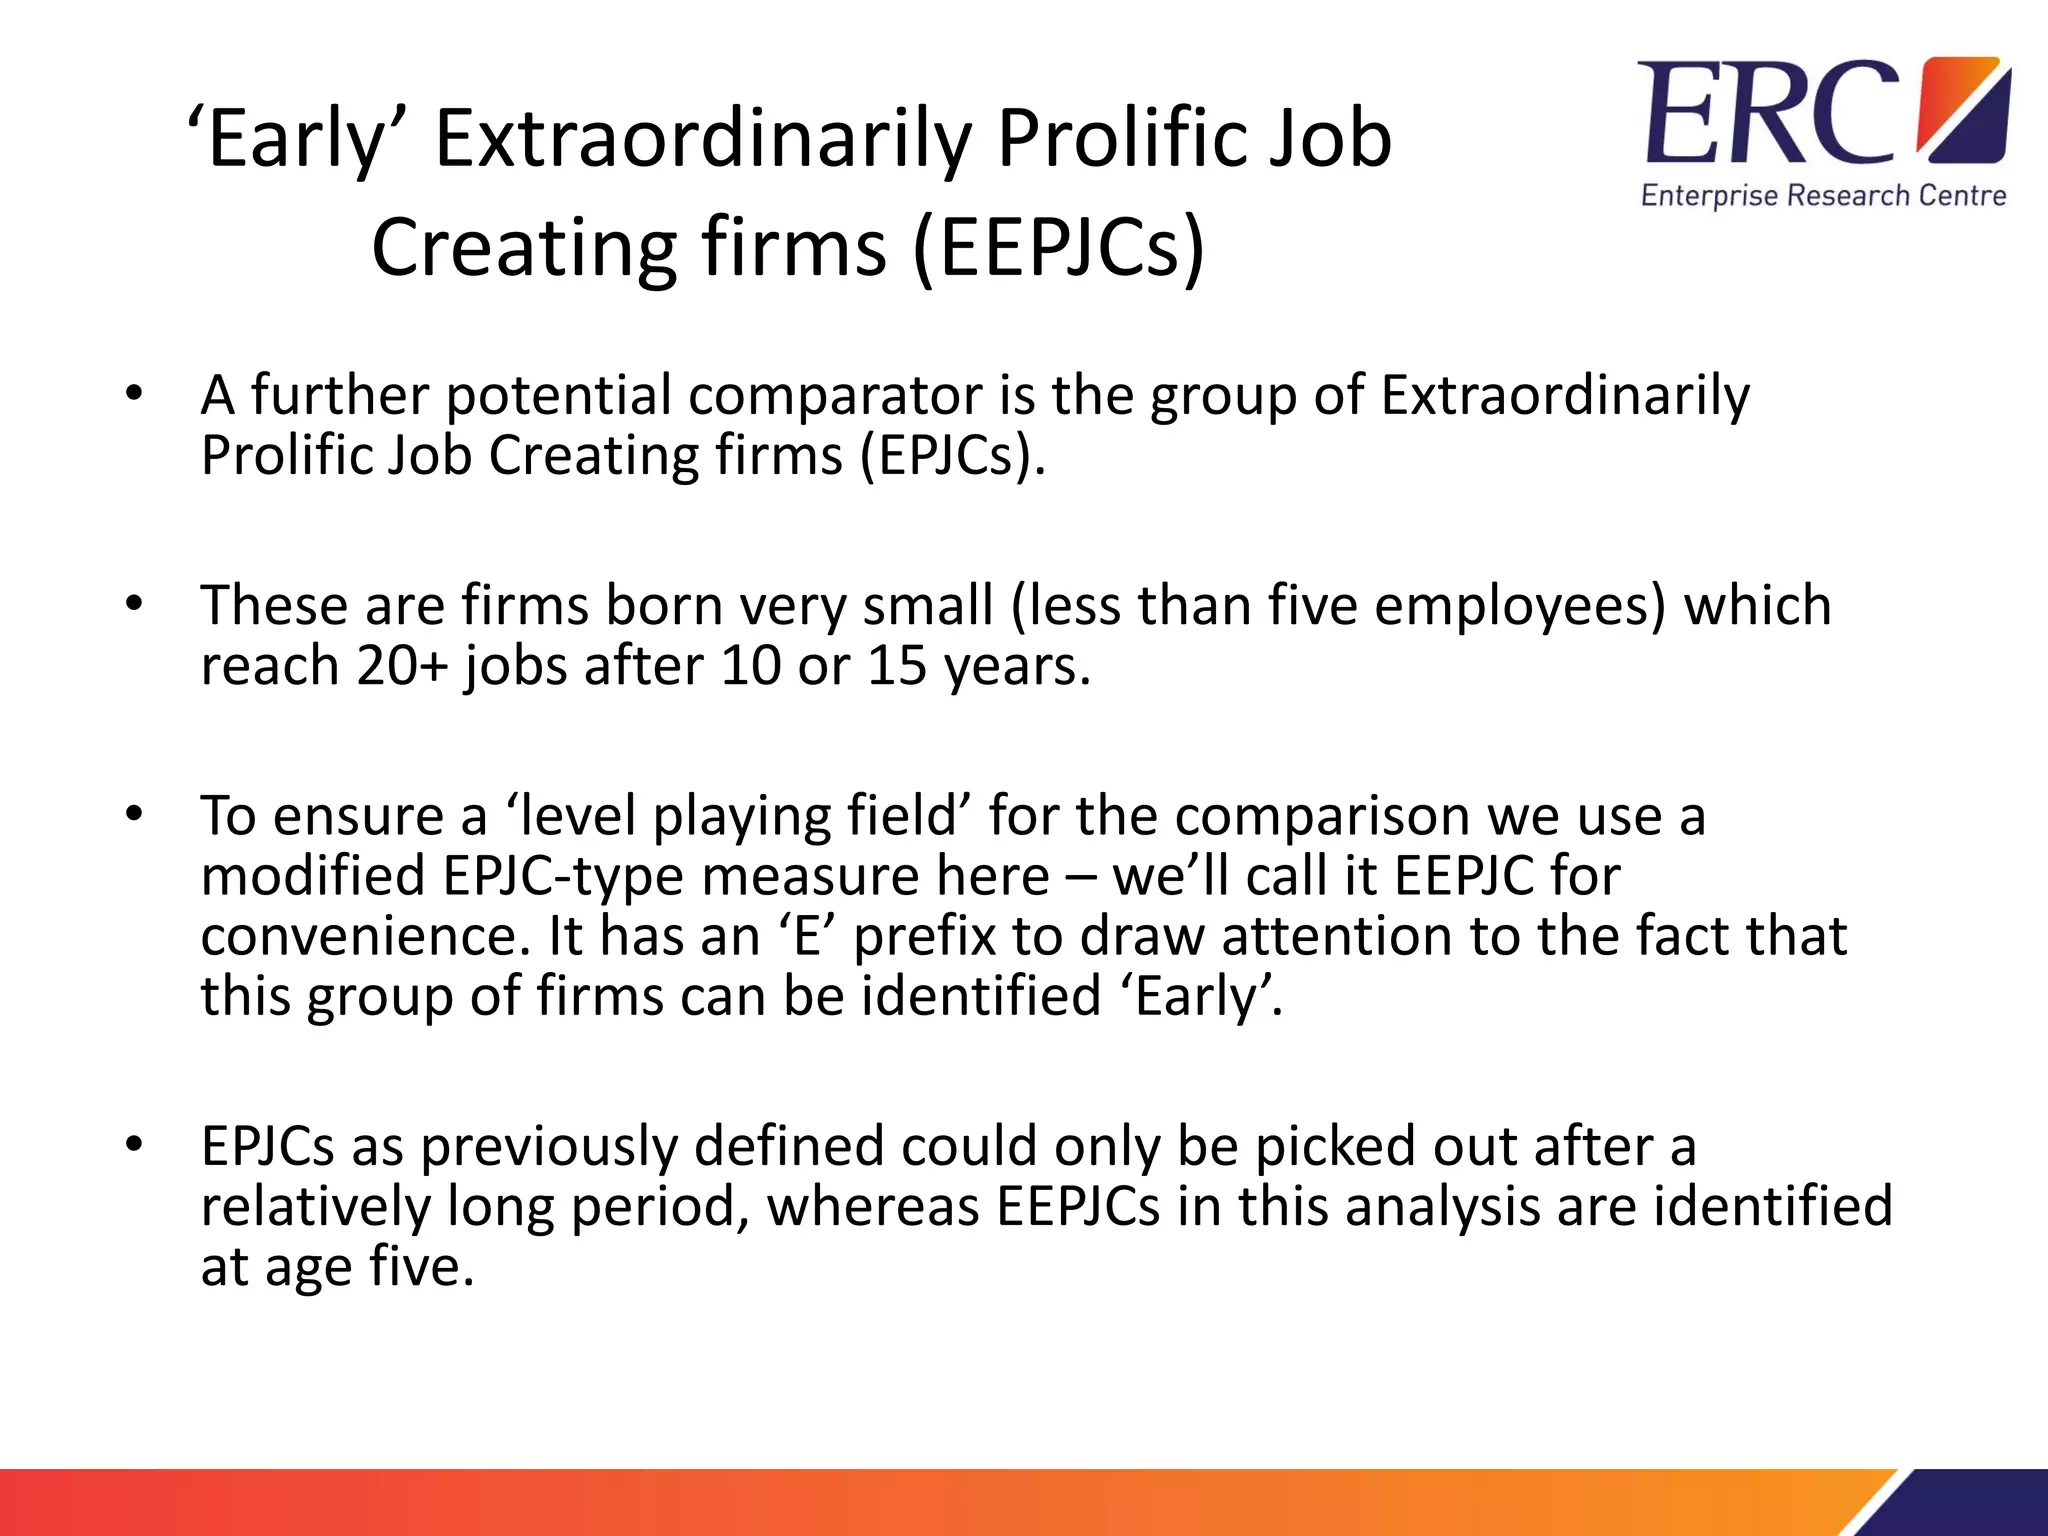
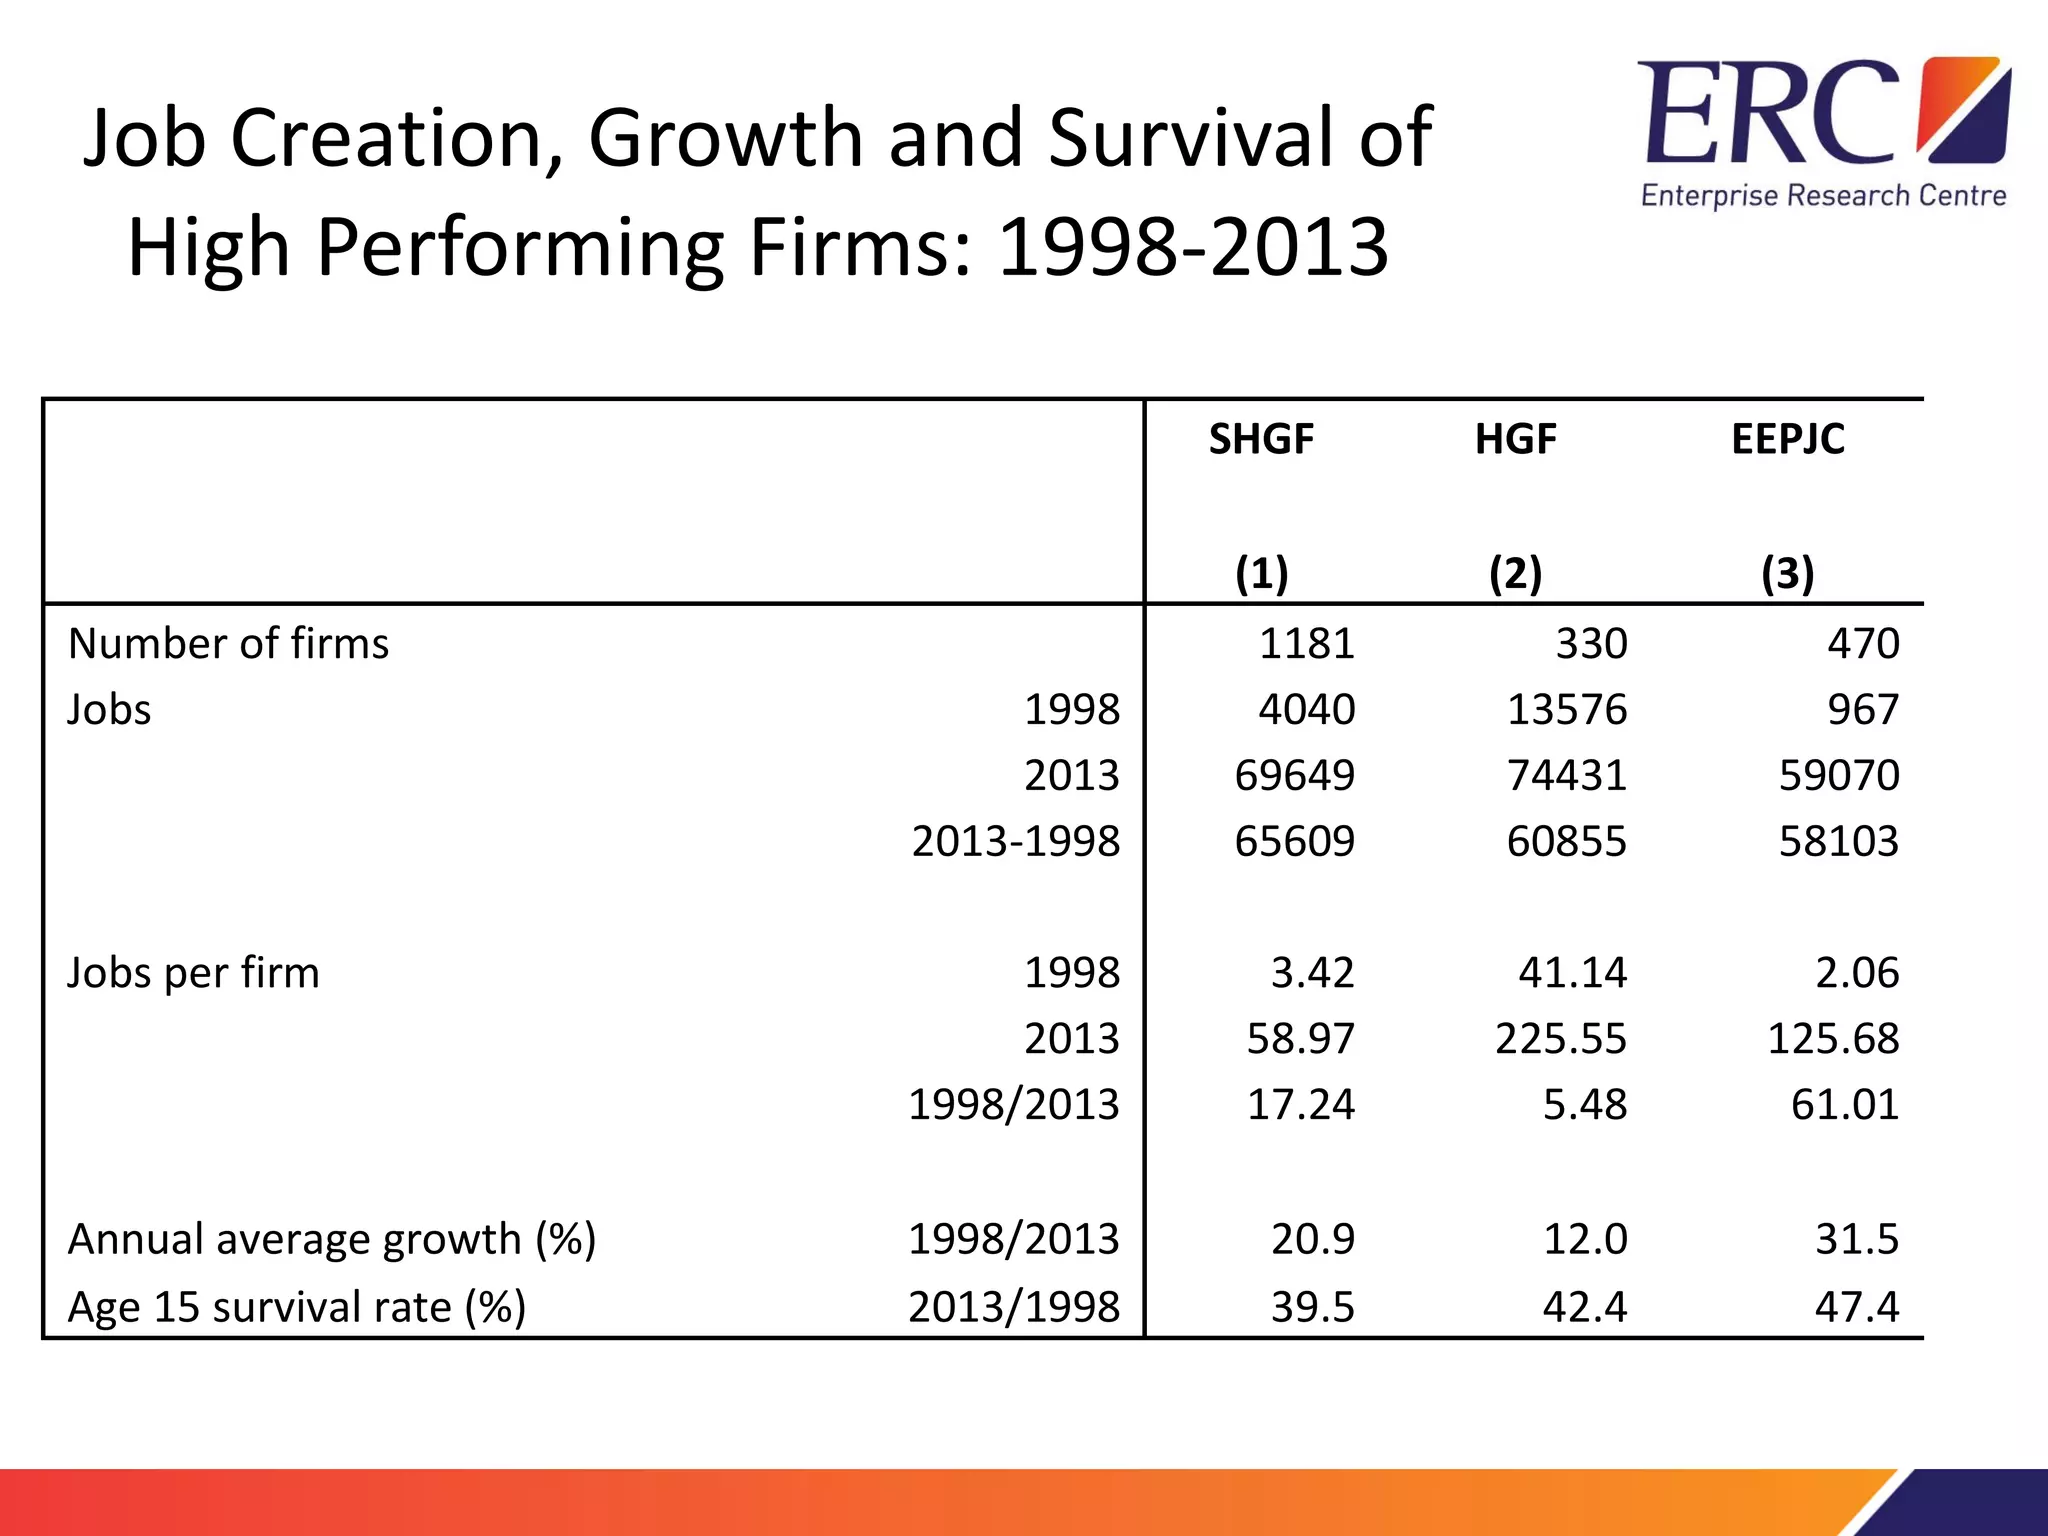
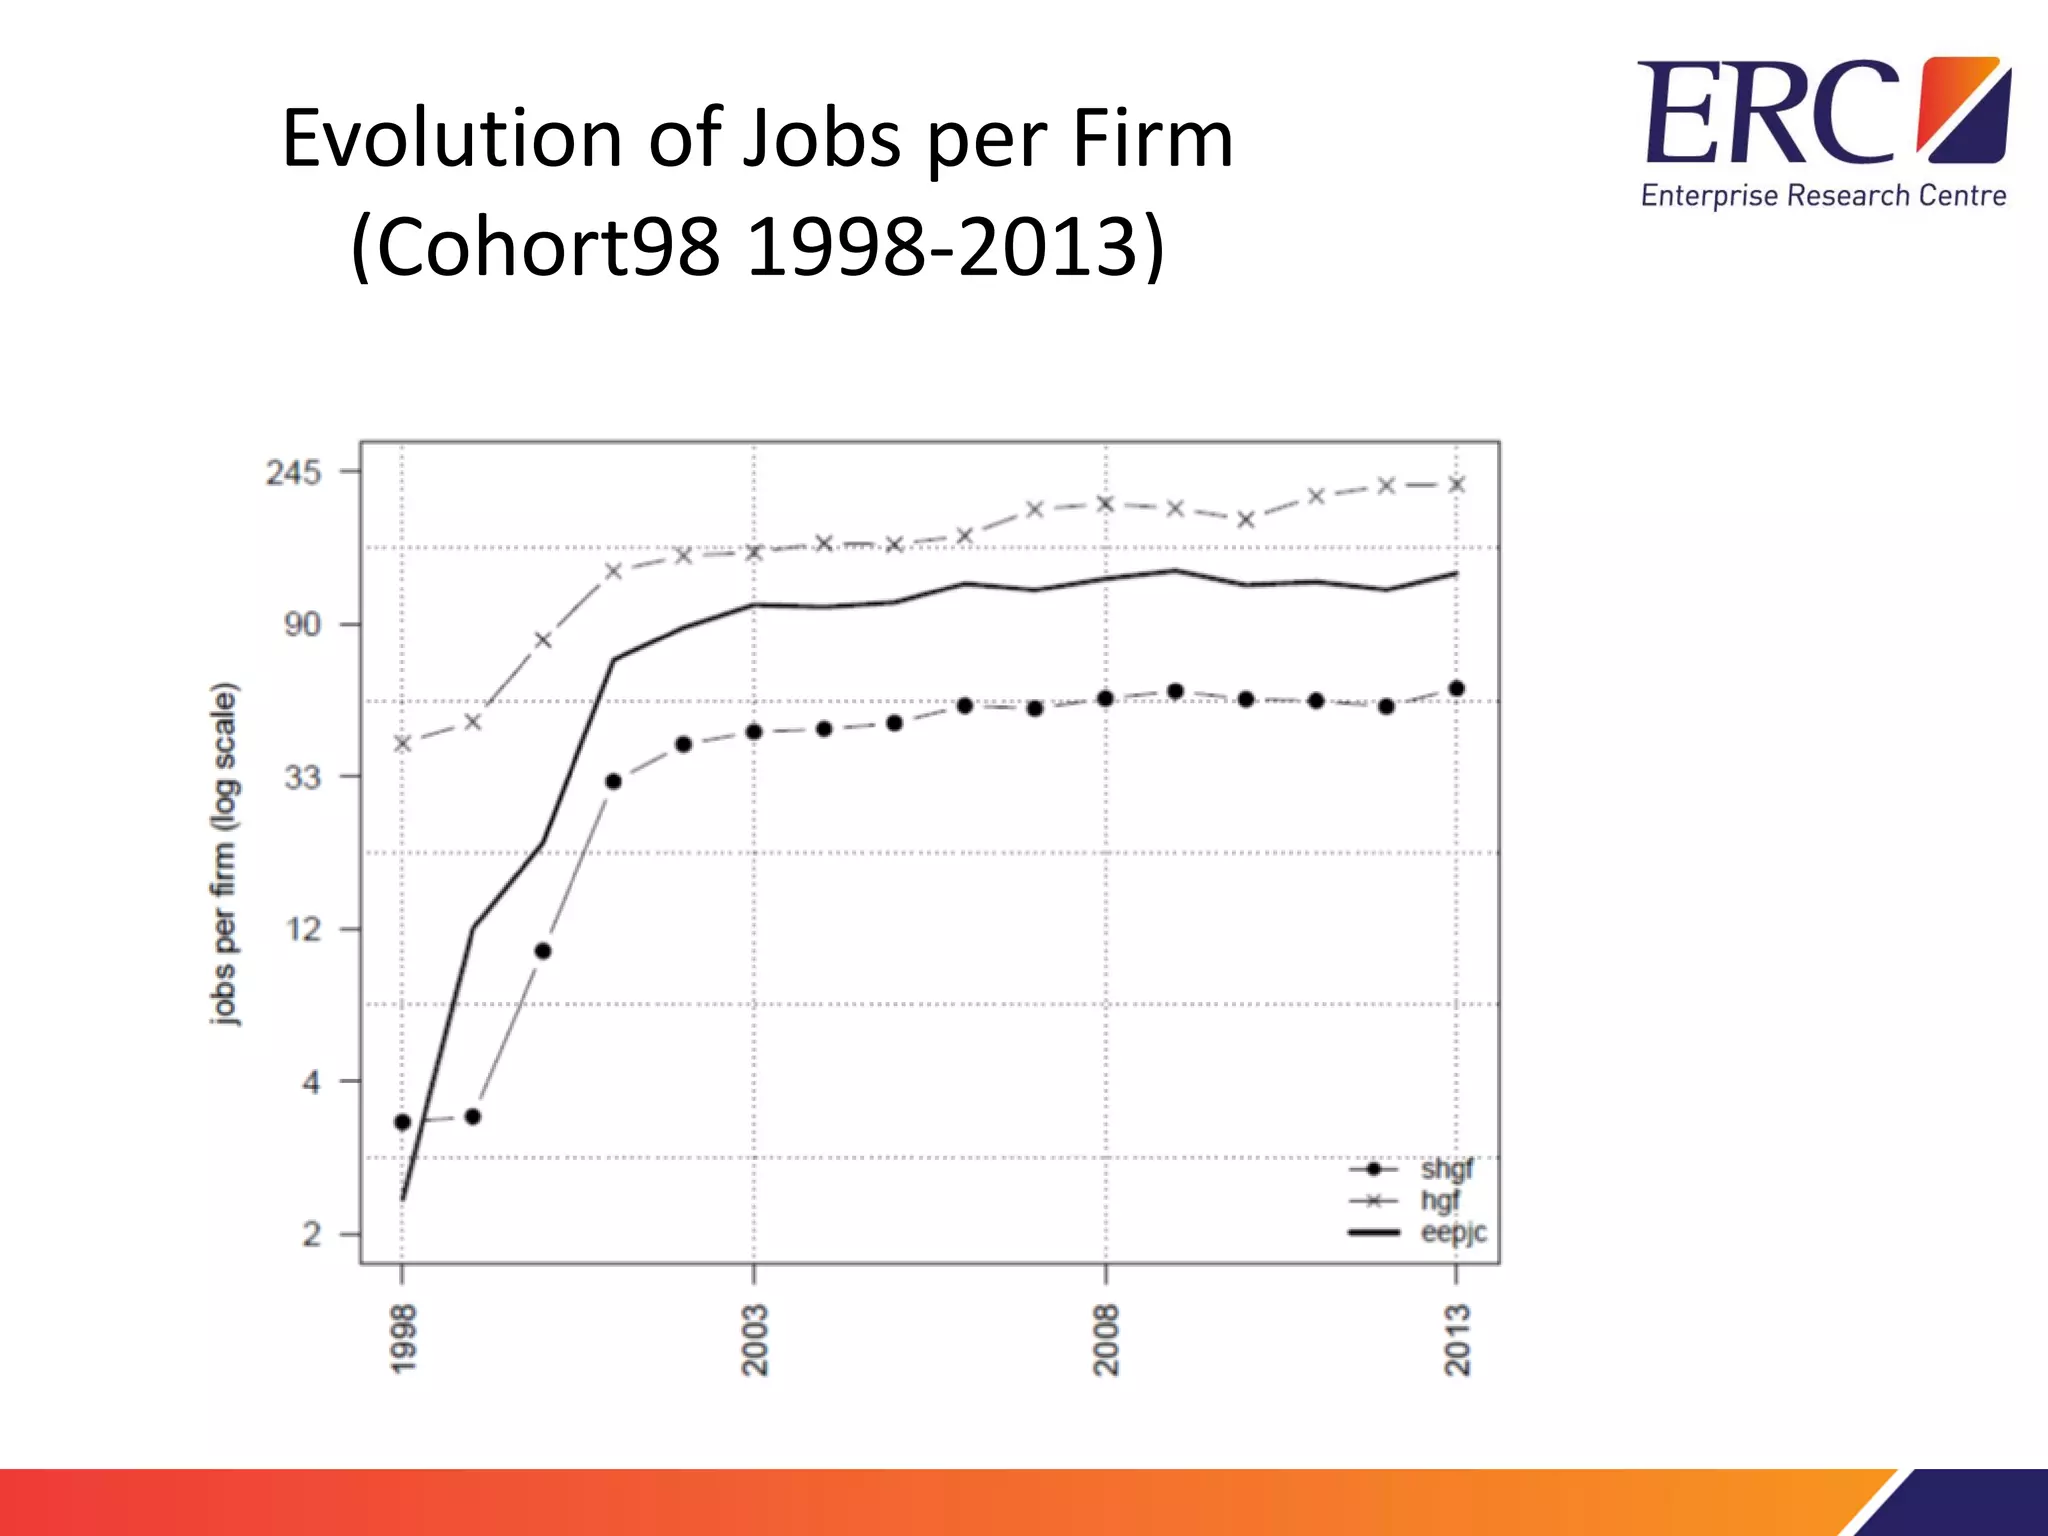
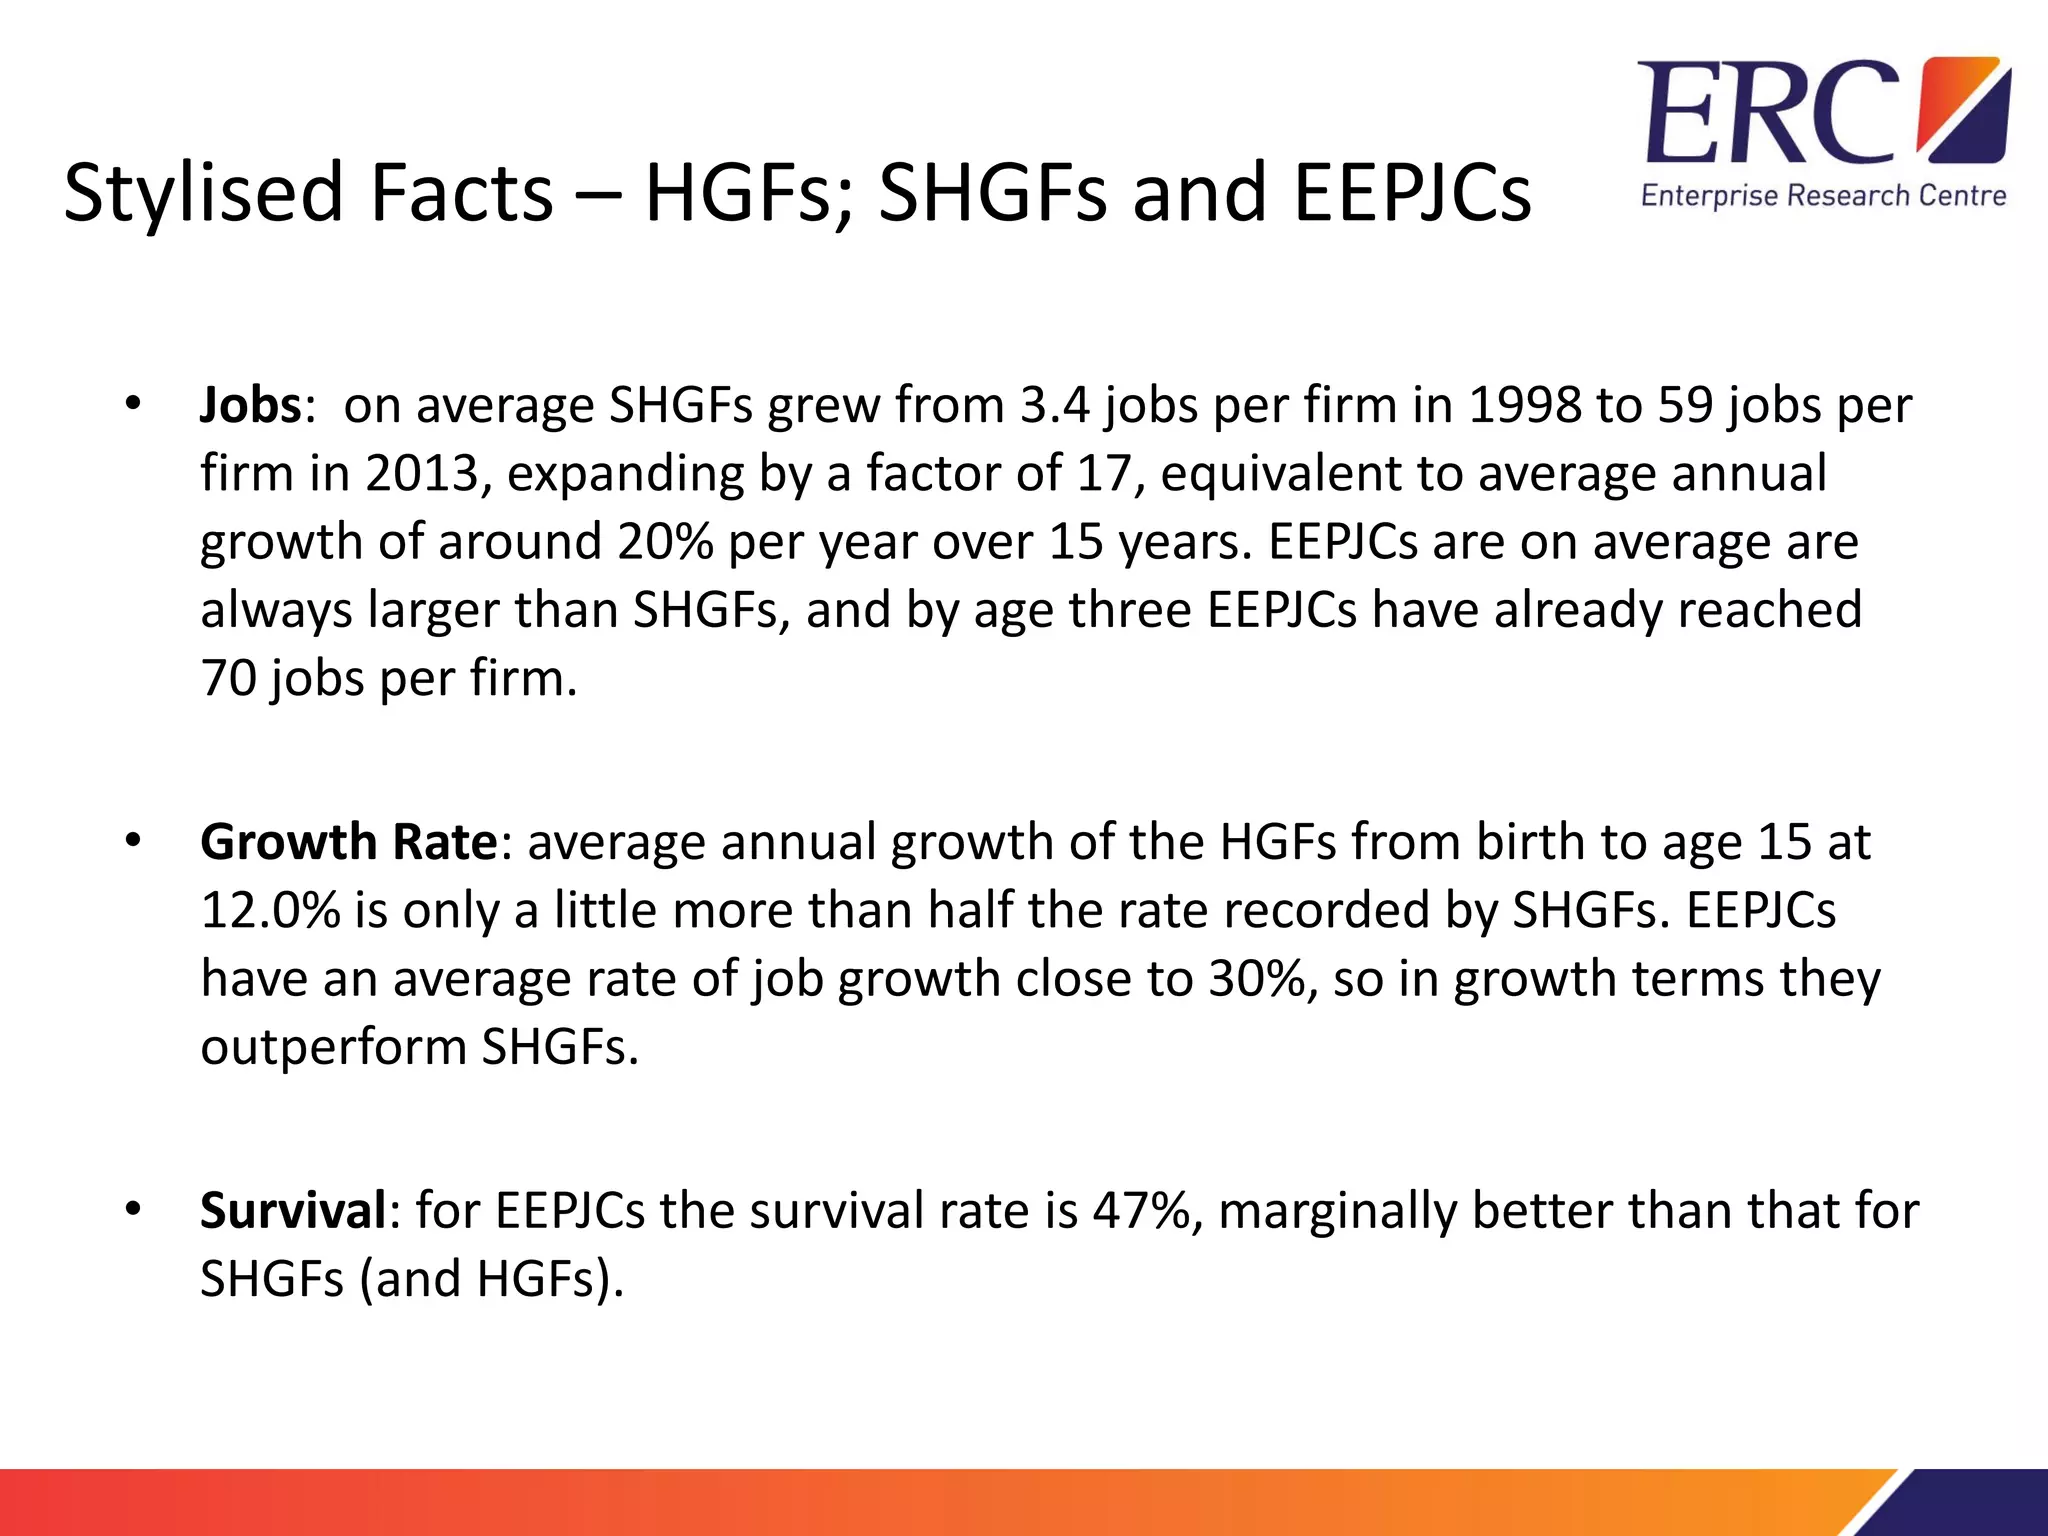
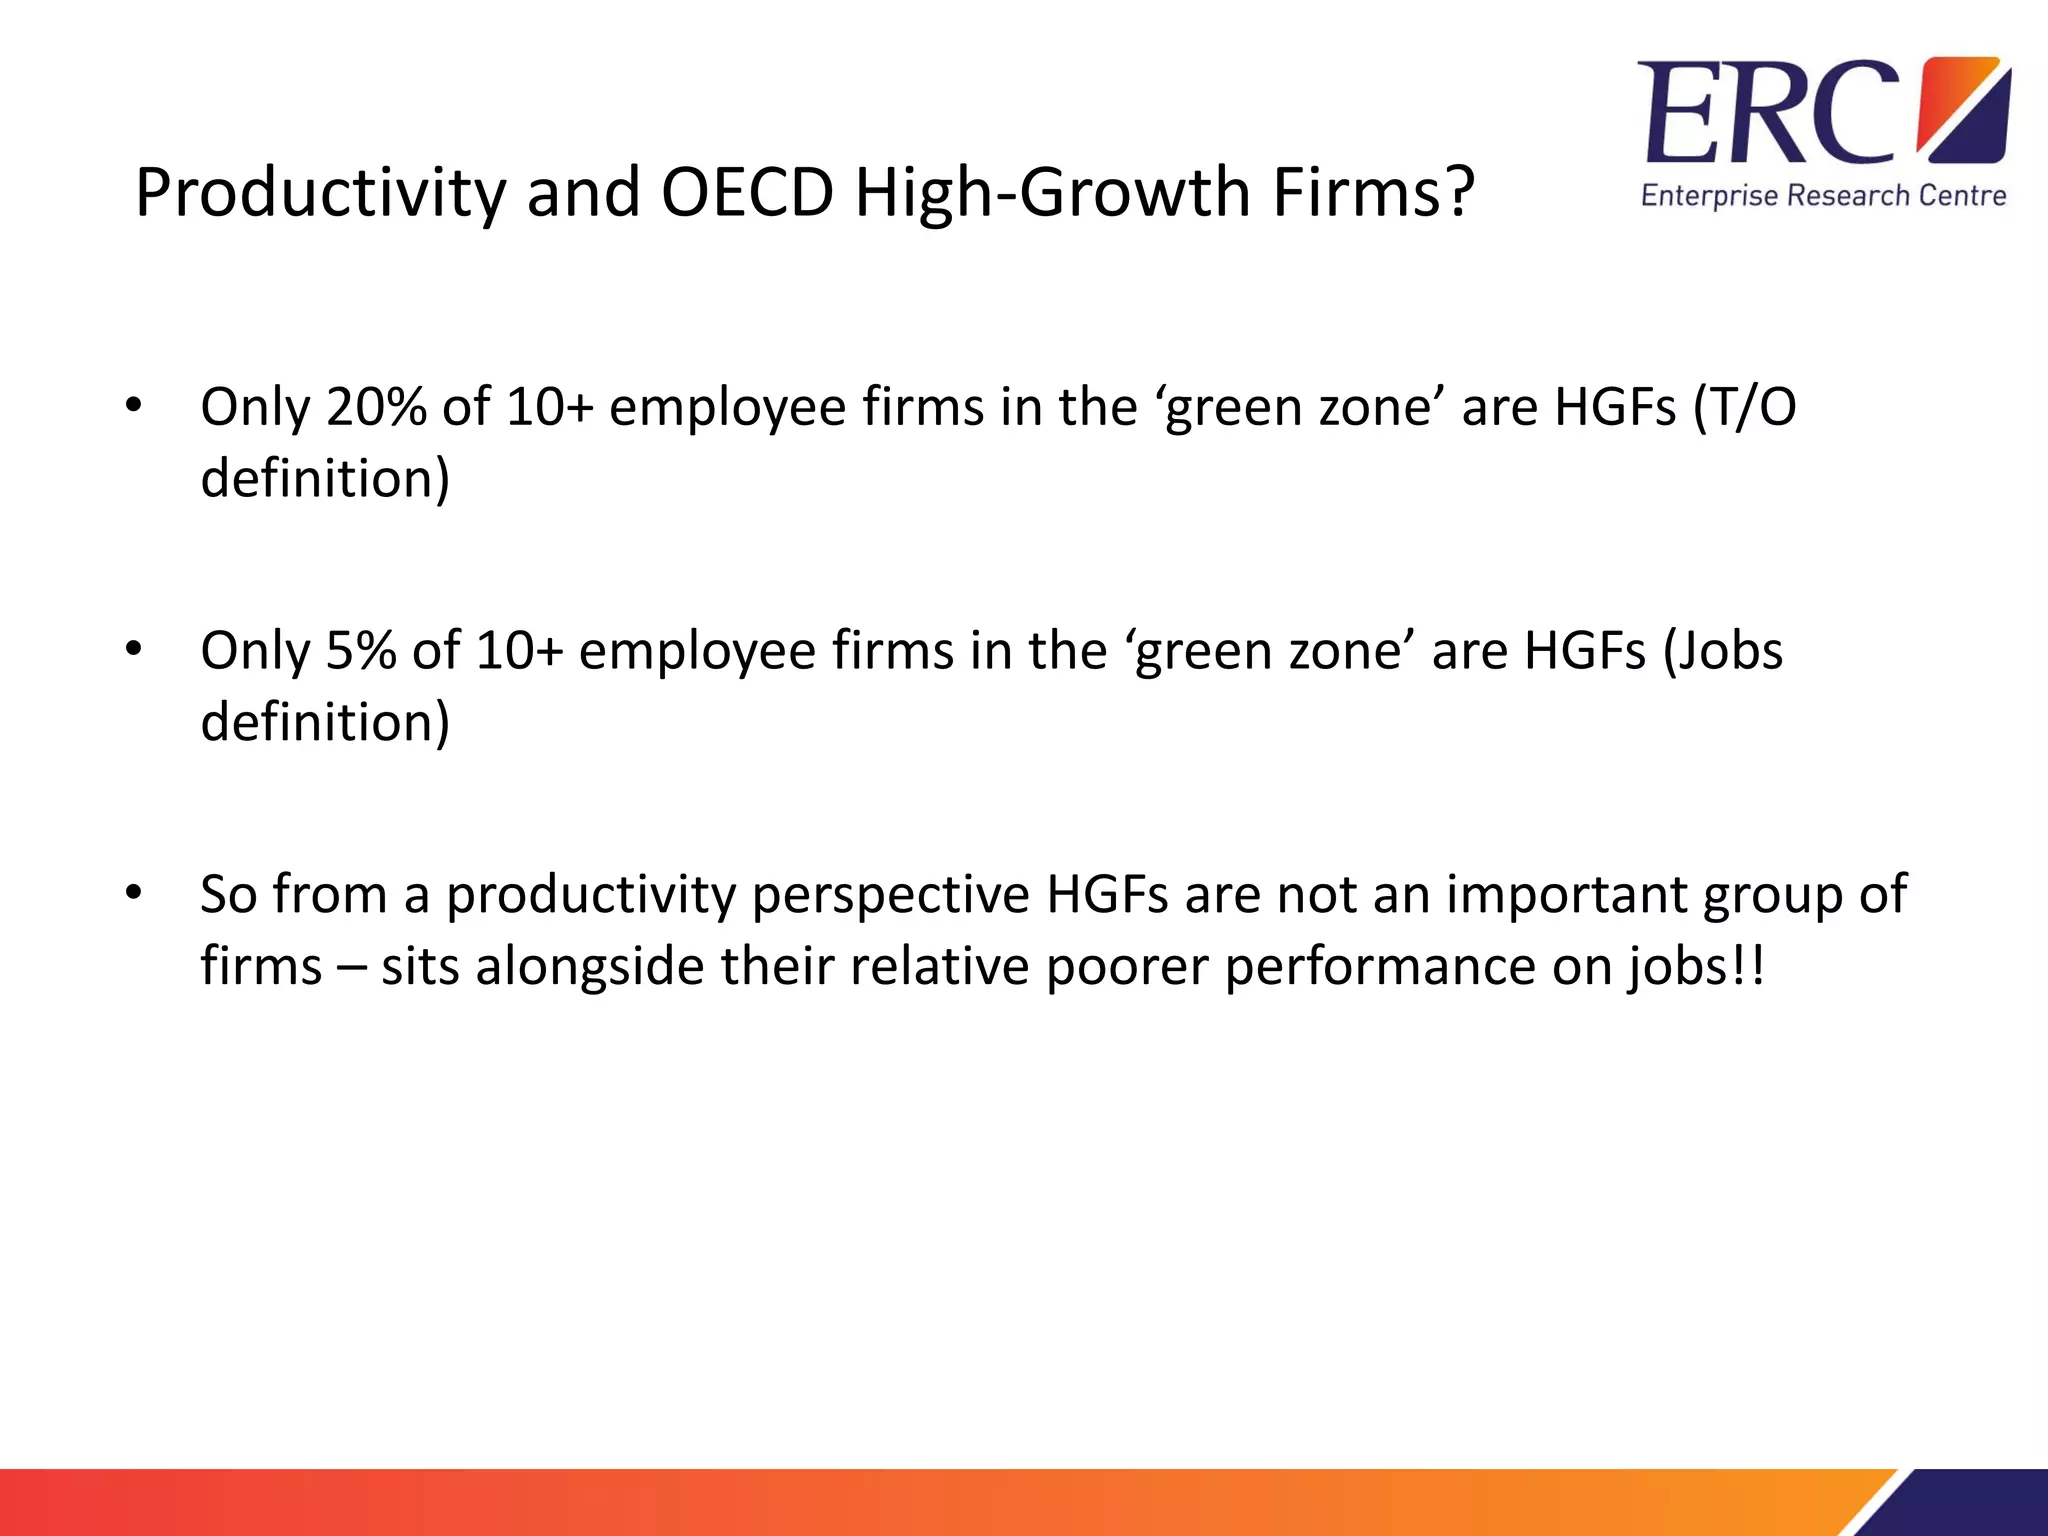


The document discusses the significance of high-growth firms (HGFs) and their role in job creation and economic policy, emphasizing the limitations of the OECD definition of HGFs. It presents new analyses of job creation in the UK, comparing different categories of high-performing firms and highlighting that most job growth occurs within the first five years of startups. The findings suggest a need for more localized economic policies that reflect the realities of diverse business dynamics rather than focusing solely on HGFs.


