With the emergence of supermarkets, kirana stores have been depleting day by day. Government is in the grave situation to decide whether to allow 50% FDI or not in the retail sector. There are certain retail outlets such as Walmart, Metro which are better in quality, cheaper in rates, and offering a range and variety of products under one roof. These malls have entered in India but they are into cash and carry business only and not in the multi brand retail sector. Many of them have entered through joint ventures. If government allow them to enter in India, it can be said that all the small shops and kirana stores will not be able to stand in the market. They cannot compete with them. Now the question arise how the kirana stores can be saved from these big giants in the market. It is the need of the hour today to save these kirana stores because in a developing country like India where the income of an average man is low, such types of small business can make them able to earn their living. The present research is an attempt to find out the weaknesses of kirana stores as compared to the malls and to find out the solutions for the betterment of the stores. The research is conducted on various kirana stores in Punjab. The study identifies the problems being faced by kirana merchants such as recovery of credit, inventory management, goodwill in terms of quality, low space, and lack of variety etc. But during the research it has been found out that there are certain areas where these kirana stores have an edge over the market such as emotional attachment with the customer, to fulfil the timely need of credit of the customer, easy availability etc. It is concluded that both kirana stores and malls are important to the Indian economy. FDI is important for the growth of the economy but it should come for the rescue of the existing business and not as a threat. Secondly government intervention is seeked to make improvements in the functioning of the kirana stores. If kirana stores starts using their strategic advantages to the optimum level, they can make can make their existence strong in the market.
There has been a tremendous amount of
literature and discussion on retail formats and present concern
seems to be the viability of various formats, particularly in
the Indian context. Whereas the idea of retailing has caught
up the fancy of corporate investors including some of the big
names in the Indian corporate world, and many of them have
diversified, integrated and changed various operating
parameters with respect to improving the service efficiency and
quality, the main question remains as to the profitable
operating format, size and display characteristics.
Transferring and applying manufacturing principles and
practices to improve both service efficiency and service
quality is an important area of research in service operations.
Research work advances this stream of research by examining
the compatibility of operating efficiency and service quality.
Specifically, our research paper addresses the following
questions: Do operating efficiency and service quality have to be
traded off, or can they exist in unison (are they compatible)
What aspects of service quality have a stronger association
with operating efficiency? How synergies from a combination of
retail formats can be used to optimize profitability of retail
operations? Overall, our analyses suggest important strategic
decision-making implications for service operations managers
and provide novel insights for academic research.
Whereas the operating margins and profits have not given
any incentive for promoters to invest in organized retail
business, the Indian retailers have been on the lookout for a
successful formula for increasing margins and profits. The
future of Indian retailing will hinge on finding a suitable
answer by any means: Be it a joint venture or cooperative
effort; or an integrated effort with the participation of
multiple retailers under one roof and making use of synergies
and cost efficiencies to improve bottom lines – which
incidentally is the most important concern of organized retail
industry. The future of Indian retailing in the organized
formats is still a question mark; but as the industry goes through
the evolutionary process we need to wait and see what the
future holds for this upcoming industry as it is promising for
employment opportunity! Developments in social centric
marketing techniques and social networking will have a profound
influence
Flaring Retail Sector: Facets and Challengesdeshwal852
The Indian retail industry flaring day by day. The concept of retail which includes the shopkeeper to customer interaction, has taken many forms and dimensions, from the traditional retail outlet and street
local market shops to upscale multi brand outlets, especially stores or departmental stores. This paper makes an attempt to study features and challenges for retail sector
Retail is the sale of goods and services from individuals or businesses to the end-user.It explains about Retail sector growth and how it will help in increasing GDPA of a country,Explain how it will grow in Future.. .
Introduction to Different Services- Retail sectorMukeshPradhan19
Introduction, SWOC Analysis of Retail Sector, Types/Segments, Latest Developments in India, Major Players, 7Ps of following sectors, other contemporary issues.
Comparison of Consumer behavior towards “Parle” and “Britannia”santoshpati92
Fast-moving consumer goods (FMCG) sector is the 4th largest sector in the Indian economy with Household and Personal Care accounting for 50 percent of FMCG sales in India. Growing awareness, easier access, and changing lifestyles have been the key growth drivers for the sector. The urban segment (accounts for a revenue share of around 55 percent) is the largest contributor to the overall revenue generated by the FMCG sector in India However, in the last few years, the FMCG market has grown at a faster pace in rural India compared with urban India. Semi-urban and rural segments are growing at a rapid pace and FMCG products account for 50 percent of total rural spending.
India’s strong consumption story relies on its demographic structure, which, at this
point in time, is highly favourable compared to most other emerging nations. As per
the UN population statistics, this favourable demographic dividend will last for another
25–30 years. Before that, most other emerging nations would have already begun to
witness a slowdown in the growth of young (working-age) population.
The ensuing benefits with regard to the rising income and household spending would
provide a significant boost to the consumption-driven growth story of India. A glimpse
of the changing pattern of India’s consumption is already visible in the breakdown
of private final consumption spending data provided by the government. There is
a marked increase in spending on lifestyle products and services such as hotels,
mobiles, transportation and other miscellaneous goods. As against that, spending on
essentials has only remained stable.
International retailers are well aware of these benefits that the Indian economy offers.
Barring few legislative challenges that could be tackled through the policy reforms and
opening up of the retail sector, retailers have often expressed their intention to enter
and invest in India’s attractive retail sector. This is very well reflected in AT Kearney’s
Global Retail Development Index 2012, where India ranks as the fifth most attractive
retail market for international retailers. The retail sector is a significant contributor to India’s economic activity. Though a
direct measurement of the retail sector is difficult to derive through government
statistics, the trade, hotels and restaurant sectors come close to giving us an
estimate of its contribution. That component, in which retail (both organised and
unorganised) is the dominant activity, accounts for around 18% of India’s GDP.
Within the services sector of India, this component is the largest contributor
to the economy. Many institutions, however, may not agree with this possibly
understated measurement of the retail sector, as it may not accurately account
for the unorganised sector. For instance, as per the estimates of the Associated
Chamber of Commerce and Industry (ASSOCHAM) presented in one of its retail
reports of 2012, the contribution of both organised and unorganised retail stood
at 22% of GDP. This would mean that Indian retail sector size should measure
closer to INR 19.2 trillion in 2012. Leading research institutions such as AT
Kearney and ASSOCHAM estimate this sector to grow at around 15% y-o-y over
the next three–five years as against a 12%–13% nominal growth of India’s GDP
estimated by the International Monetary Fund (IMF). Going by that logic, the retail
sector should reach a size of INR 34 trillion by 2016. This is a significant growth.
The sector is also an important contributor towards the socioeconomic well-being
of the economy as it employs close to 9.4% of India’s labour force, as per the
association.
Below is link to our monthly newsletter BEACON (BE-A-CONsultant)
June Edition
.
Happy Reading!
Highlights:
Retail Industry Analysis
Analysis of Infosys Consulting
Consulting World News and
June Edition's Quiz
.
http://bit.ly/12jec69
Retail Industry of India contributes to 12 percent of GDP of India. The Indian Retail Industry is
divided into organized and unorganized retail. The Indian retail sector is highly fragmented with 95
percentage of its business being dominated by unorganized retailers like traditional family run
stores. The unorganized retail sector has continued to grow at about 10 percent per annum with
sales rising from $ 309 billion in the year 2006-07 to $ 496 billion in the year 2011-12. The
unorganized retail sector employs about 33 million people in India.
1. 1446 The Management Accountant | December 2012
CASE STUDY
I. Introduction
I
ndia is among the world’s youngest nations, with
a median age of 25 years as compared to 43 in
Japan and 36 in the US. This, coupled with a large
population and rapidly evolving consumer preferences,
has translated into a large market opportunity for FMCG
players. Improved infrastructure facilities are expected
to support the enhanced supply chain management.
The Government of India has increased it’s spend on
infrastructure, including the construction of roads.
By 2025, India is poised to become the world’s fifth-
largest consuming country from the twelfth position in
2010. Real estate development in the country, such as
the construction of shopping malls and hypermarkets,
are opening up new business channels for FMCG
companies. Indian cities are expected to add 379 million
people to the consumer base for FMCG companies, as
the urbanisation rate is expected to increase from the
current 30 to 45 per cent in the next 40 years according
to recent industry estimates, household income in the
top 20 boom cities in India is projected to grow at 10
per cent annually by 2018. Further, the top 100 cities in
India contribute between 50–60 per cent of the overall
consumption spends.
Equity Research in FMCG Sector
(F & B) in India: A Study of KRBL
Limited and Britannia
Industries
Anupam Mitra Karan Mordani
ACMA Assistant Professor (Finance) Student MBA (Finance)
Symbiosis Institute of Business Management, Bangalore SIBM, Bangalore
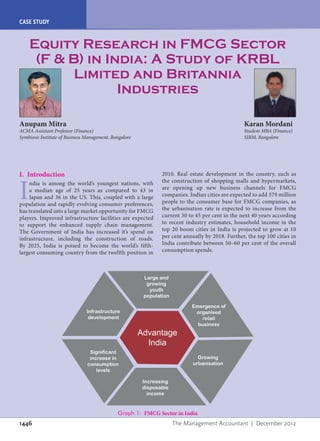
Advantage
India
Large and
growing
youth
population
Emergence of
organised
retail
business
Growing
urbanisation
Increasing
disposable
income
Significant
increase in
consumption
levels
Infrastructure
development
Graph 1: FMCG Sector in India
2. The Management Accountant | December 2012 1447
CASE STUDY
The Indian FMCG sector is the fourth largest
sector in the economy. It has a strong MNC presence
and is characterized by a well established distribution
network, intense competition between the organized
and unorganized segments and low operational cost.
Availability of key raw materials, cheaper labour
costs and presence across the entire value chain gives
India a competitive advantage. The FMCG market
is set to treble from $11.6 billion in 2003 to $33.4
billion in 2015. Penetration level as well as per capita
consumption in most product categories like jams,
toothpaste, skin care, hair wash etc in India is low
indicating the untapped market potential. Burgeoning
Indian population, particularly the middle class and
the rural segments, presents an opportunity to makers
of branded products to convert consumers to branded
products.
We can notice that Food and Beverages comprise 43%
(forty three percent) of the sector. It is therefore, majorly
spiraling sales of food and beverages that is responsible for
the growth of the sector. Hence, our research and project
focused primarily on food products. Some of the factors
responsible for the growth of the sector are:
l Increasing Urbanization
l Rising Urban Penetration
l Lifestyle changes
l Gradual shift towards branded and organized food
packages.
II. Relevant Literature Reviewed:
l Richard A. Cohn and John J.Pringle (October,1971),
in their ”Some Implications of Imperfections In
International Financial Market” concluded that if
restrictions on international capital flows were to
be removed, returns on internationally diversified
portfolios would decline toward the risk-free rate of
interest.
l A.P.Budd and H.M.Treasury (November, 1971),
observed that the relevant measure of riskiness for an
investment is its non-diversifiable standard deviation.
l William S. Comanor and Thomas A. Wilson
(November 1971) suggested that advertising depends
on technological factors and prices, which determine
the variability of total cost with output in the short run.
l A. P. Budd and Robert H. Lichtenberger (1971) analyzed
that the comparative static response of risk asset prices
and the firm’s cost of capital to changes in money supply.
l Amitesh Kapoor (2012), observed that fast moving
consumer goods (BSE-FMCG), consumer durable
(BSE-CD),healthcare(BSE-HC),andautomobile(BSE-
AUTO) sectors have outperformed the benchmark as
well as other sectors and have provided positive alpha.
III. Objectives:
1. To accomplish the reasons behind the rationale of
investment in this sector and also the reasons behind
the good returns it has so far given.
Graph 2: Indian FMCG Market Segment ( www.ibef.org----report on Fast Moving Consumer Goods under the
Food Industry heading)
Baby care
Fabric care
Food Products
Hair care
Household
OTC products
Others
Personal care
3. 1448 The Management Accountant | December 2012
CASE STUDY
Fundamental analysis maintains that markets may
misprice a security in the short run but that the “correct”
price will eventually be reached. Profits can be made by
purchasing the mispriced security and then waiting for the
market to recognize its “mistake” and re price the security.
The biggest part of fundamental analysis involves
delving into the financial statements. Also known as
quantitative analysis, this involves looking at revenue,
expenses,assets,liabilitiesandalltheotherfinancialaspects
of a company. On the basis of this analysis the intrinsic
value of the shares are determined. This is considered as
the true value of the share. If the intrinsic value is higher
than the market price it is recommended to buy the share.
If it is equal to market price hold the share and if it is less
than the market price sell the shares
To a fundamentalist, the market price of a stock tends
to move towards its “real value” or “intrinsic value”. If the
“intrinsic/real value” of a stock is above the current market
price, the investor would purchase the stock because he
knows that the stock price would rise and move towards its
“intrinsic or real value”
Iftheintrinsicvalueofastockwasbelowthemarketprice,
the investor would sell the stock because he knows that the
stock price is going to fall and come closer to its intrinsic value.
Fundamental Analysis of the Companies:
We start analyzing the financials of certain companies in
the FMCG (food & beverages) segment. These included
companies like KRBL and Britannia Industries.
These comprised of Financial Modeling, Ratio
calculations, Valuations using Discounted Cash Flow
Model (DCFF). In this method we used the estimated
or forecasted growth rate and also the cost of capital or
inflation to discount Future Cash Flows. This method
helped us to arrive at a valuation for the companies and
their stocks under consideration.
F&B segment to lead the way
The food sector accounted for ~37% of India’s total FMCG
market in 2010, according
to AC Nielsen. It is believed that over the next decade,
this is likely to grow to ~46%.Currently the share of modern
retail in India is between 2.5 % to 3 % but the penetration
of modern retail in the F&B space is likely to touch 8% over
the next 10 years
Consumer wallet still dominated by Food & Beverage
Despite the growing importance of other categories such
as clothing, footwear, accessories, jewellery, etc, the share
of food and beverages continues to dominate the share of
a consumer wallet. According to Images India Retail, the
retail F&B share is still ~60%, which means it remains the
most important part of the overall retail trade. While this
part of the trade has been dominated by traditional retail
over the years, recent growth of modern retail has meant
that the share of modern retail has improved. However,
2. To finding out the reasons behind Food and Beverages
Segment leading the growth of the sector.
3. To value the stocks of the certain FMCG companies to
arrive at a conclusion whether the stock is undervalued
or overvalued or fairly priced.
4. To give recommendations to prospective clients and
investors about investment on this stock.
IV. Data Source & Methodology:
The data we have collected from the following:
l Annual Reports of Companies
l Company Corporate Presentations
l Industry Reports
l PastandExistingEquityResearchReportsofCompanies
The purpose is to predict future performance of
companies and accordingly inform prospective investors.
For this purpose, fundamental analysis has been done to see
analyse companies’ future performance based on current
trends and future predictions. Fundamental Analysis is
done to see how the companies’ assets are valued and have
an opportunity to grow. An industry analysis is also done
to understand the working of the industry.
The data collected for the purpose of analysis was
secondary in nature. The data for the above analysis like the
track records of various companies, market capitalization,
GDP, Price/Earnings Ratio of companies were taken from
relevantwebsitesonthebasisofwhich,analysishasbeendone.
For the purpose of Valuation, we have also analyzed
companies which may not be regarded to be very big now,
but may grow up to great heights in future.
The methodology included the fundamental analysis
of companies. It was as follows:
l Studying reports on the sector.
l Identifying the Macroeconomic Factors influencing
the sector.
l Analyzing certain companies’ current performance
(related to the sector) and their annual reports.
l Carrying out valuations of the companies using
financial models.
l Giving suggestions in the report.
V. Analysis of Data:
Fundamental analysis of a business involves analyzing
its financial statements and health, its management and
competitive advantages, and its competitors and markets.
When applied to futures and forex, it focuses on the overall
state of the economy, interest rates, production, earnings,
and management. When analyzing a stock, futures
contract, or currency using fundamental analysis there
are two basic approaches one can use; bottom up analysis
and top down analysis. The term is used to distinguish
such analysis from other types of investment analysis, such
as quantitative analysis and technical analysis.
4. The Management Accountant | December 2012 1449
CASE STUDY
In several categories such as oats and instant noodles,
modern retailers have launched their private label brands
which are expected to grow significantly. This has aided
the growth rates of the categories. India remains a huge
unbranded market and therein lies an opportunity for
retailers. Future FMCG group is looking at opportunities
across categories, which include cosmetics, for which the
value of brands is seen as key to success. However, in that
sense, we see India as a distinctive market which provides
an opportunity to migrate non users into the category. This
is where modern retail has a big advantage over established
brands in luring consumers
Modern Retail’s role in developing the supply chain
The importance of supply chain in the development of
modern retail cannot be stressed more. Having an efficient
supply chain system will not only ensure that product
availability is enhanced, but also helps in putting controls
in place on costs. One of the key concerns for the FMCG
industry has been the low fill rates that are prevalent in the
country. The fill rate is defined at the percentage of time
that the product which the consumer is willing to buy is
actually available in the store. According to Images India
Retail 2009, the industry average fill rate is close to 65-
70%, this means about 30% of the time, the consumer is
not able to find the product that he/she is looking for. This
is direct cost to the retailer and the manufacturer, as non-
availability of the product leads to loss of revenues. Modern
retail has invested heavily behind developing an efficient
supply chain. One of the benefits of having an efficient
supply chain is that many of the inefficiencies in the form
of additional costs get taken out of the system. This would
result in cost to the consumer coming down, which also
leads to improved consumer off take and an increase in per
capita consumption.
This is especially relevant given the recent sharp
rise in food prices, a result of inefficiencies in the
supply chain. Many of this relates to traditional retail
there is still a long way to go before modern retail accounts
for a sizeable Proportion of overall retail trade, especially
in the F&B space.
Private labels – a modern retail phenomenon
As modern retail started to grow in India, private labels
started to make an entry into The FMCG market.
The steady rise of private labels has been a consistent
Phenomenon across the globe now. Globally, private label
market penetration as a Percentage of retailers’ overall sales
is significant: the global average is ~17, Europe: 23% and
US: 16%. Emerging markets, however, are still behind in
terms of private Label penetration, at ~6%. In India, the
overall share of private labels within organized Retail is
~5%, which makes it one of the lowest in the world (Images
India Retail 2009). However, there lies an opportunity for
Indian retailers, with retailers increasingly realizing those
private labels can be a significant success if the product
offering presents Value to the consumer. This is especially
true for a country like India where consumers’ perception
of ‘value’ is extremely important.
Modern retail to help convert non-users to users
One of the opportunities across FMCG is to convert non
users to come into the categories, even at the lowest part
of the value chain. This has the potential to significantly
shift the growth trajectory across categories upwards, as
there is still a large majority of consumers in India who
are non users of many of the products across the FMCG
industry. This is especially true for the food category,
where the penetration level in many categories is still
very low compared to (Home and Personal Care) HPCs.
Modern retail has taken the lead in this regard across the
FMCG categories by luring more and more consumers
into the category by way of different promotions and
strategies.
(%)
9
8
7
6
5
4
3
2
1
0
2010 2020
30% CAGR
7.8
2.0
Graph 3: The percentage of sales accounted by Modern Retail1
1
Nomura Research Report on FMCG Sector 2010
5. 1450 The Management Accountant | December 2012
CASE STUDY
unorganized players. Leading branded tea players are
HUL and Tata Tea.
l Coffee
The Indian beverage industry faces oversupply in
segments like coffee and tea. However, more than 50%
of the market share is in unpacked or loose form. The
major players in this segment are Nestlé, HUL and
Tata Tea
KRBL
Good long term prospects for company
Basmati rice industry is attractive, primarily due to the
following factors:
l Global trade flows: India and Pakistan are the major
producers of basmati rice. India exports ~2.0 million
tonnes per annum of basmati rice compared to
Pakistan’s ~0.9 million tonnes per annum. Also, as
per our industry sources, India’s main basmati variety,
PUSA 1121, is better than Pakistan’s ‘Super’ variety.
This is a structural advantage that India continues to
enjoy.
l Premium pricing: Basmati rice is premium long-
grain fine-texture rice and one of the most expensive
varieties of rice available in the world.
including wholesalers, local retailers, etc. A recent
presentation from Bharti Wal-Mart cash and carry
business suggests that with direct procurement, proper
storage and distribution, prices can be kept under
control.
Food & Beverages
l Food
According to the Ministry of Food Processing, the size
of Indian food processing is around US$ 65.6 billion
including US$ 20.6 billion of value added products.
Of this, the health beverages industry is valued at
US$ 230 billion, bread & biscuits at US$ 1.7 billion,
chocolates at US$ 73 million and ice-creams at US$
188 million. The size of the semi-processed/ready to
eat food segment is over US$ 1.1 billion. The food
category has also seen innovations like softies in ice
creams, ready to eat rice by HUL and pizzas by both
GCMMF and Godrej Pillsbury.
l Tea
This is perhaps the only industry where India has
retained its leadership over the past 150 years. With a
turnover of more than Rs. 9,000 crore, the major share
of tea market is dominated by unorganized players.
More than 50% of the market share is captured by the
Asia Pacific. 31%
ROW. 9%
US. 21%
Europe 39%
Graph 4: Global Processed Food Industry
6. The Management Accountant | December 2012 1451
CASE STUDY
Contract Farming
Contract farming is agricultural production carried out
according to an agreement between a buyer and farmers,
which establishes conditions for the production and
marketing of a farm product or products. Typically, the
farmer agrees to provide established quantities of a specific
agricultural product, meeting the quality standards
and delivery schedule set by the purchaser. In turn, the
buyer commits to purchase the product, often at a pre-
determined price
Benefits to Farmers
l Access to competitive and modern technologies
l Significant reduction in risk and uncertainty of markets
l Enhanced Earning potential due to improved crop
quality and productivity
l Crop switching- Leading to Enhanced realization
l Good value of paddy without involving intermediaries
Benefits to KRBL
l Adequate availability of paddy
l Ensures quality of procured paddy
l Significant savings in transportation and Mandi tax
l Building lasting, mutually beneficial relationship with
the farmers
l Insulation from fluctuations in paddy prices
l Enhanced realizations
Britannia Industries
Product Portfolio of Britannia Industries2
l Lower regulations: Due to its premium nature,
basmati rice is not subject to strict regulations as faced
by normal rice, which is the common man’s food.
l Strong export growth: Exports of Indian basmati rice
in volumes has grown at a CAGR of ~12% between
FY00 and FY11, while in value terms it has grown at
18% CAGR to Rs 106 bn from Rs 17 bn in the same
period.
l Lifestyle changes: With the increasing Indian middle-
class population, organized retail and growth in hotels
and restaurants, domestic demand for basmati is on
the rise.
It can be observed that the above points indicate good
growth for the industry. Therefore, if the company is able
to perform better than its peers then it may benefit in the
long run.
Business Model of KRBL:
Strong Distribution Network
Distributor/Dealer Network in India 450
Retail Outlets in India 4,00,000
Presence in Domestic Retail Chain 14
Distribution Network 28 States
Purchase Centre 182 centres in 5 states
Overseas Registrations 45
Export Countries 27
Contract Farming is one of the main reasons behind the
success of KRBL
Biscuits
Rusks
Cake
On-the-go Packs
Time Pass
Daily Bread
Dahi
Butter, Cheese
Milk
Bread
Healthy Start
In-between
meals @ home
Anytime
Anywhere
Main Meal
Meal
Accompaniment
2
Britannia Industries Presentation to investors ---February 2012
7. 1452 The Management Accountant | December 2012
CASE STUDY
Britannia Supply Chain
AW
Wholesalers
RPD
Super
stockist
BIL
Consumers
Rural Retailer
(Indirect)
Urban Retailer
(Indirect)
Urban Retailer
(Direct)
Institutions/Chain
retailers
Rural Retailer
(Direct) mk mkmk
The conventional Distribution infrastructure delivers to 35 Lakhs outlets, 8.5
Lakhs outlets are serviced directly
Ratio Analysis:
KRBL Limited Britannia Industries
Current Ratio 2008-09 2009-10 2010-11 2008-09 2009-10 2010-11
0.76 0.87 0.84 1.18 1.16 1.1
Current Ratio measures the company’s ability to meet
its short term liabilities. A higher ratio indicates that
the company is more capable of paying off its short term
liabilities. A ratio of 2:1 was considered to be ideal. However,
many analysts now believe that the ideal ratio should differ
for different industries and should also vary as per the size
of the firm. A ratio of below 1 can be a cause for worry for
KRBL. On the other hand; Britannia has been maintaining
little more current assets than liabilities to finance its assets.
It is managing its short term liabilities well.
KRBL Limited Britannia Industries
Debt Equity Ratio 2008-09 2009-10 2010-11 2008-09 2009-10 2010-11
1.42 1.13 1.39 0.37 2.32 1.9
It measures the proportion of Debt to Equity. Britannia
has taken more debt in the recent past and hence, its Debt
Equity Ratio has peaked up. In case of KRBL, however, it
has been steadily maintaining a ratio over 1.
KRBL Limited
Net Profit Margin 2008-09 2009-10 2010-11 2008-09 2009-10 2010-11
4.93 7.78 7.66 4.39 2.7 2.89
It measures the profitability of the company or firm after
clearing all dues. This is a low margin business. However;
KRBL has been able to maintain a higher net profit
margin. In case of Britannia, the margin is just below 3
per cent.
3
3
Britannia Industries Presentation to investors ---February 2012
8. The Management Accountant | December 2012 1453
CASE STUDY
Du Pont Analysis
Earnings
Turnings
Leverage
Operating
Profit Margin
Financial
Structure
Return On
Assets (less
interest adj.)
Asset Turnover
Return On
Equity
=
=
x
x
DuPont analysis tells us that ROE is affected by three
things:
l Operating efficiency, which is measured by profit
margin
l Asset use efficiency, which is measured by total asset
turnover
l Financial leverage, which is measured by the equity
multiplier4
KRBL
KRBL Limited
Return on Equity
Values in % 2008 2009 2010 2011 FY 12 E FY 13 E FY 14 E
PAT/Net Sales 5.46 4.99 7.89 7.76 4.15 6.85 7.28
Net Sales/Net total Assets 88.81 128.22 138.54 100.24 113.23 114.89 117.49
Net Total Assets/Av Equity 337.19 261.24 238.02 261.80 209.12 198.87 176.95
ROE 16.35 16.70 26.01 20.36 9.84 15.66 15.13
NOPAT=EBIT(1-t) 109.90 131.73 159.67 156.06 157.10 171.95 180.55
Return on Capital
Values in % 2008 2009 2010 2011 FY 12 E FY 13 E FY 14 E
NOPAT/Net Sales 10.92 10.04 10.11 10.06 9.79 9.84 9.84
Net Sales/Capital 88.81 128.22 138.54 100.24 113.23 114.89 117.49
ROC 9.70 12.88 14.01 10.08 11.08 11.31 11.56
Non Cash Working Capital
Particulars 2008 2009 2010 2011 FY 12 E FY 13 E FY 14 E
Current assets 1096.4 924.9 998.3 1461.0 1393.4 1516.5 1592.3
4
ROE = Profit Margin (Profit/Sales) * Total Asset Turnover
(Sales/Assets) * Equity Multiplier (Assets/Equity)
9. 1454 The Management Accountant | December 2012
CASE STUDY
Cash 28.9 11.2 42.1 5.3 0.0 0.0 0.0
Current Liabilities 198.4 153.1 212.2 327.7 326.0 354.8 372.5
Non Cash Working Capital 869.1 760.6 743.9 1128.0 1067.5 1161.7 1219.8
Net Increase in WC 356.25 -108.51 -16.68 384.07 -60.56 94.28 58.09
Free Cash Flows
Particulars 2008 2009 2010 2011 FY 12 E FY 13 E FY 14 E
EBIT(1-t) 109.90 131.73 159.67 156.06 157.10 171.95 180.55
Add: Depreciation 24.10 23.55 27.58 35.95 43.88 47.17 49.53
Less: Changes in Non Cash
Working Capital 356.25 -108.51 -16.68 384.07 -60.56 94.28 58.09
Less: Capital Expenditure 37.36 11.43 127.80 103.05 -16.79 47.64 29.35
FCFF -259.61 252.36 76.13 -295.11 278.33 77.20 142.64
Britannia Industries
Return on Equity
Value in % 2008 2009 2010 2011 FY 12 E FY 13 E FY 14 E
PAT/Net Sales 6.36 4.13 2.70 2.87 3.05 3.14 3.25
Net Sales/Net total Assets 284.70 348.66 405.40 493.24 494.91 516.50 540.93
Net Total Assets/Av Equity 154.19 140.83 187.60 311.08 298.98 266.95 237.09
ROE 27.92 20.27 20.53 44.08 45.06 43.29 41.71
NOPAT=EBIT(1-t) 176.14 147.69 119.50 158.44 187.11 204.70 226.57
Return on Capital
Value in % 2008 2009 2010 2011 FY 12 E FY 13 E FY 14 E
NOPAT/Net Sales 6.35 4.26 3.13 3.39 3.57 3.55 3.57
Net Sales/Capital 287.60 345.00 401.45 487.57 487.44 508.70 532.77
ROC 18.26 14.68 12.56 16.54 17.40 18.05 19.01
Non Cash Working Capital
Particulars 2008 2009 2010 2011 FY 12 E FY 13 E FY 14 E
Current assets 626.11 626.15 639.61 754.74 798.75 881.12 970.49
Cash 51.89 56.80 33.45 70.62 0.00 0.00 0.00
Current Liabilities 424.43 511.90 575.29 714.57 748.97 824.34 907.25
Non Cash Working Capital 149.79 57.45 30.87 -30.45 49.77 56.78 63.23
Net Inc in WC 138.38 -92.34 -26.58 -61.32 80.22 7.01 6.46
Free Cash Flows of a Firm
Particulars 2008 2009 2010 2011 FY 12 E FY 13 E FY 14 E
EBIT(1-t) 176.14 147.69 119.50 158.44 187.11 204.70 226.57
Add: Depreciation 39.36 65.91 58.23 64.86 66.57 74.82 80.66
Less: Changes in Non Cash WC 138.38 -92.34 -26.58 -61.32 80.22 7.01 6.46
Less: Capital Expenditure 78.25 161.39 88.89 44.07 129.14 119.12 131.03
FCFF -1.13 144.55 115.42 240.55 44.31 153.39 169.75
10. The Management Accountant | December 2012 1455
CASE STUDY
around 19% in 2014.It is estimated to be around 11%
for KRBL.
It can be seen that rice contributes a major proportion
of KRBL’s sales. While it contributed around 91% in year
ending 2008; the proportion has risen and contributed
around 95% in the years ahead. This is attributed to larger
volumes of exports to the Middle East countries, where
rice is a popular culinary.
Based on the above the proportion of rice to the
contribution of sales is pegged at 95% for the subsequent years.
Both KRBL and Britannia Industries are predicted
to give positive returns to their shareholders. However,
we see the returns declining for KRBL. In case of
Britannia though, the percentage seems to be steady
over 40.They are providing a better return to their
equity owners.
Return on Capital is also higher for Britannia
Industries. This means that Britannia Industries has
been providing a better return on its capital. Return on
Capital is higher for Britannia and is estimated to be
Graph 5: Revenue mapping of KRBL
Rice
Others
2008
9.01%
90.99%
Rice
Others
2009
4.93%
95.07%
Rice
Others
2010
4.14%
95.86%
Rice
Others
2011
5.50%
94.50%
11. 1456 The Management Accountant | December 2012
CASE STUDY
given the expected growth. A company having a PEG
Ratio between 0 and 1 is believed to provide higher
returns. A ratio above 1 may indicate that the stock is
undervalued.
PEG Ratio KRBL Britannia
Mar 31-2011Closing Price 26.7 370.55
EPS as on 4.94 11.23
Annual EPS Growth -44.59% 19.01%
P/E 5.4049 32.9964
PEG Ratio -0.1212 1.7353
The contribution of Biscuits and High Protein Food to
the sales of Britannia Industries is much higher than the
other segments. However; the percentage contribution has
been declining over the years. This is because Britannia
Industries has been increasing its product portfolio and
constantly diversifying into other food segments.
PEG Ratio:
A lower PEG means that the stock is undervalued more.
The PEG ratio of 1 is sometimes said to represent a fair
trade-off between the values of cost and the values of
growth, indicating that a stock is reasonably valued
Biscuit and
High
Protein
Food
Bread, bread
toast and
rusk
Cake
Biscuit and
High
Protein
Food
Bread, bread
toast and
rusk
Cake
2008
7.47%
2.94%
0.55%
89.03%
2009
9.02%
87.12%
3.13%
0.72%
Biscuit and
High
Protein
Food
Bread, bread
toast and
rusk
Cake
Others
Biscuit and
High
Protein
Food
Bread, bread
toast and
rusk
Cake
2010
10.12%
3.48%
0.94%
85.45%
2011
9.61%
84.88%
4.56%
0.95%
Graph 6: Revenue mapping of Britannia Industries
12. The Management Accountant | December 2012 1457
CASE STUDY
Indian markets run high on sentiments and one or two
bad news for the company or industry may cause a sharp
decline in its share prices.1
VI. Limitations of the study
1. While the project would help to calculate the
current valuation of stocks of the company and
predict future performance, it did not involve much
of technical analysis using technical indicators to
help one take short term decisions and profit in the
short term.
2. Also, the markets are known to run on sentiments
and the research would be restricted to India.
It is observed that KRBL has a PEG Ratio which is
negative. This is because of a decrease in EPS in 2011
over the previous year. While, this is not a good sign
for an investor, the company generating positive Free
Cash Flows means that the investors can expect better
results from the company in future and expect higher
returns.
Britannia, on the other hand has a PEG Ratio just
over 1.73.While its stock, may still not have reached its
fair value, it can be said that the investors need to take a
cautious approach if they have to go long on Britannia
shares. A high PEG Ratio can also be attributed to a
high Return on Equity for Britannia. This is because the
BSE
Index Open Close % Change
Sensex 17,039 16,026 -5.95%
MIDCAP 6170.24 5854.18 -5.12%
Smallcap 6459.04 6274.69 -2.85%
AUTO 9768.15 9202.5 -5.79%
BANKEX 11355.63 10678.79 -5.96%
CD 6214.64 6428.93 3.45%
CG 9887.35 8780.95 -11.19%
FMCG 4459.03 4601.48 3.19%
Healthcare 6447.59 6602.37 2.40%
IT 5976.93 5471.24 -8.46%
METAL 10899.51 9933.71 -8.86%
OIL & GAS 7810.52 7462.24 -4.46%
POWER 2047.46 1777.5 -13.19%
PSU 7100.41 6616.05 -6.82%
REALTY 1696.02 1566.66 -7.63%
TECK 3501.37 3175.89 -9.30%
5
Niveshak Magazine of IIM Shillong, May 2012 Edition
5
13. 1458 The Management Accountant | December 2012
CASE STUDY
We can observe that while most sectors have been
giving negative returns, FMCG has given positive returns
and is second highest in terms of returns.
After carrying out fundamental analysis, we can
therefore conclude that this sector is likely to give positive
returns in the near future, even if there is a little slowdown
in the economy or high inflation. It is one of the better
sectors for the investors to put their money into.
Even companies like KRBL and Britannia Industries
look to be undervalued at the moment and are likely to give
positive returns to the shareholders in the next one year.
Bibliography
1. A.P.Budd and H.M.Treasury “Secular Trends in Risk
Premiums” published in “Journal of Finance”, September
1972, Vol. 27, No. 4, pp. 857-864
2. Britannia Annual Reports. (n.d.). Retrieved from www.
britannia.co.in: http://www.britannia.co.in/investerzone_
bonus_financial_ar.htm
3. Britannia Industries Financial Data. (n.d.). Retrieved from
www.moneycontrol.com: http://www.moneycontrol.com/
financials/britanniaindustries/balance-sheet/BI#BI
4. BSEIndiaEquityResearchReports.(n.d.).Retrievedfromwww.
bseindia.com: http://www.bseindia.com/sensex/research.aspx
5. FMCG Sector In India. (2011). IIM Shillong Niveshak
Magazine August 2011 .
6. Fundamental Analysis. (n.d.). Retrieved from www.
investopedia.com: http://www.investopedia.com/articles/
fundamental-analysis/09/five-must-have-metrics-value-
investors.asp#axzz1wHu2v0SS
7. IBEF Industry Study on FMCG Sector. (2011). Retrieved from
www.ibef.org: http://www.ibef.org/industry/foodindustry.
aspx
8. KRBL Annual Reports. (n.d.). Retrieved from www.krblrice.
com: http://krblrice.com/investorrelation.html
9. KRBL Financial Data. (n.d.). Retrieved from www.
moneycontrol.com: http://www.moneycontrol.com/
financials/krbl/balance-sheet/KRB01#KRB01
10. Macroeconomics. (n.d.).: http://en.wikipedia.org/wiki/
Macroeconomics
11. NSE India Equity Research Reports. (n.d.). Retrieved from
www.nseindia.com: http://www.nseindia.com/education/
content/reports/eq_research_reports.htm
12. William S. Comanor and Thomas A. Wilson, “On Advertising
and Profitability” published in “Review of Economics &
Statistics, November 1971, Vol. 53 Issue 4, pp. 408-410”
In today’s globalized world, where trade is
interconnected, the performance of stock exchanges
in the United States of America and Europe also
have an impact on the stock performances the
world over, including India. Such eventualities
cannot be predicted in advance.
VII. Findings
After carrying out fundamental analysis and analyzing
the macroeconomic factors, it can be concluded that
inflation is good for the economy only if it is below the
growth rate.
We could observe that the major cost for the
companies was the prices of raw materials. Raw
materials account for a major portion of the
Companies’ expenses in the FMCG Sector. The prime
reason for the increase in the companies’ expenses
has been the cost of raw materials.
We also noticed that due to increase in power tariffs,
companies are now resorting to generate their own
power for captive use.
Modern Retail has helped spur sales in this sector. The
percentage sales contribution of organised retail has
been growing every year.
Changing lifestyle of people and independent families
has led to an increase in the consumption of packaged
food.
Despite, economic slowdown there still has been
growth in this sector. One of the main reasons is
because some essential commodities form a part
of this sector and even an increase in prices does
not force people to curtail expenditure on those
goods.
KRBL
Fair Price of the Share 30.33
Britannia Industries
Fair Price of a Share 591.37
VII. Conclusion
Returns in Different Sector Index in the April 2012 (see
page xxx).
Requesting all our members from industry to take part in the survey for Members in
Industry. Kindly view the link:
http://mindtech.imrbint.com/CostAccountIndiaCAWI/ICAIHome.aspx