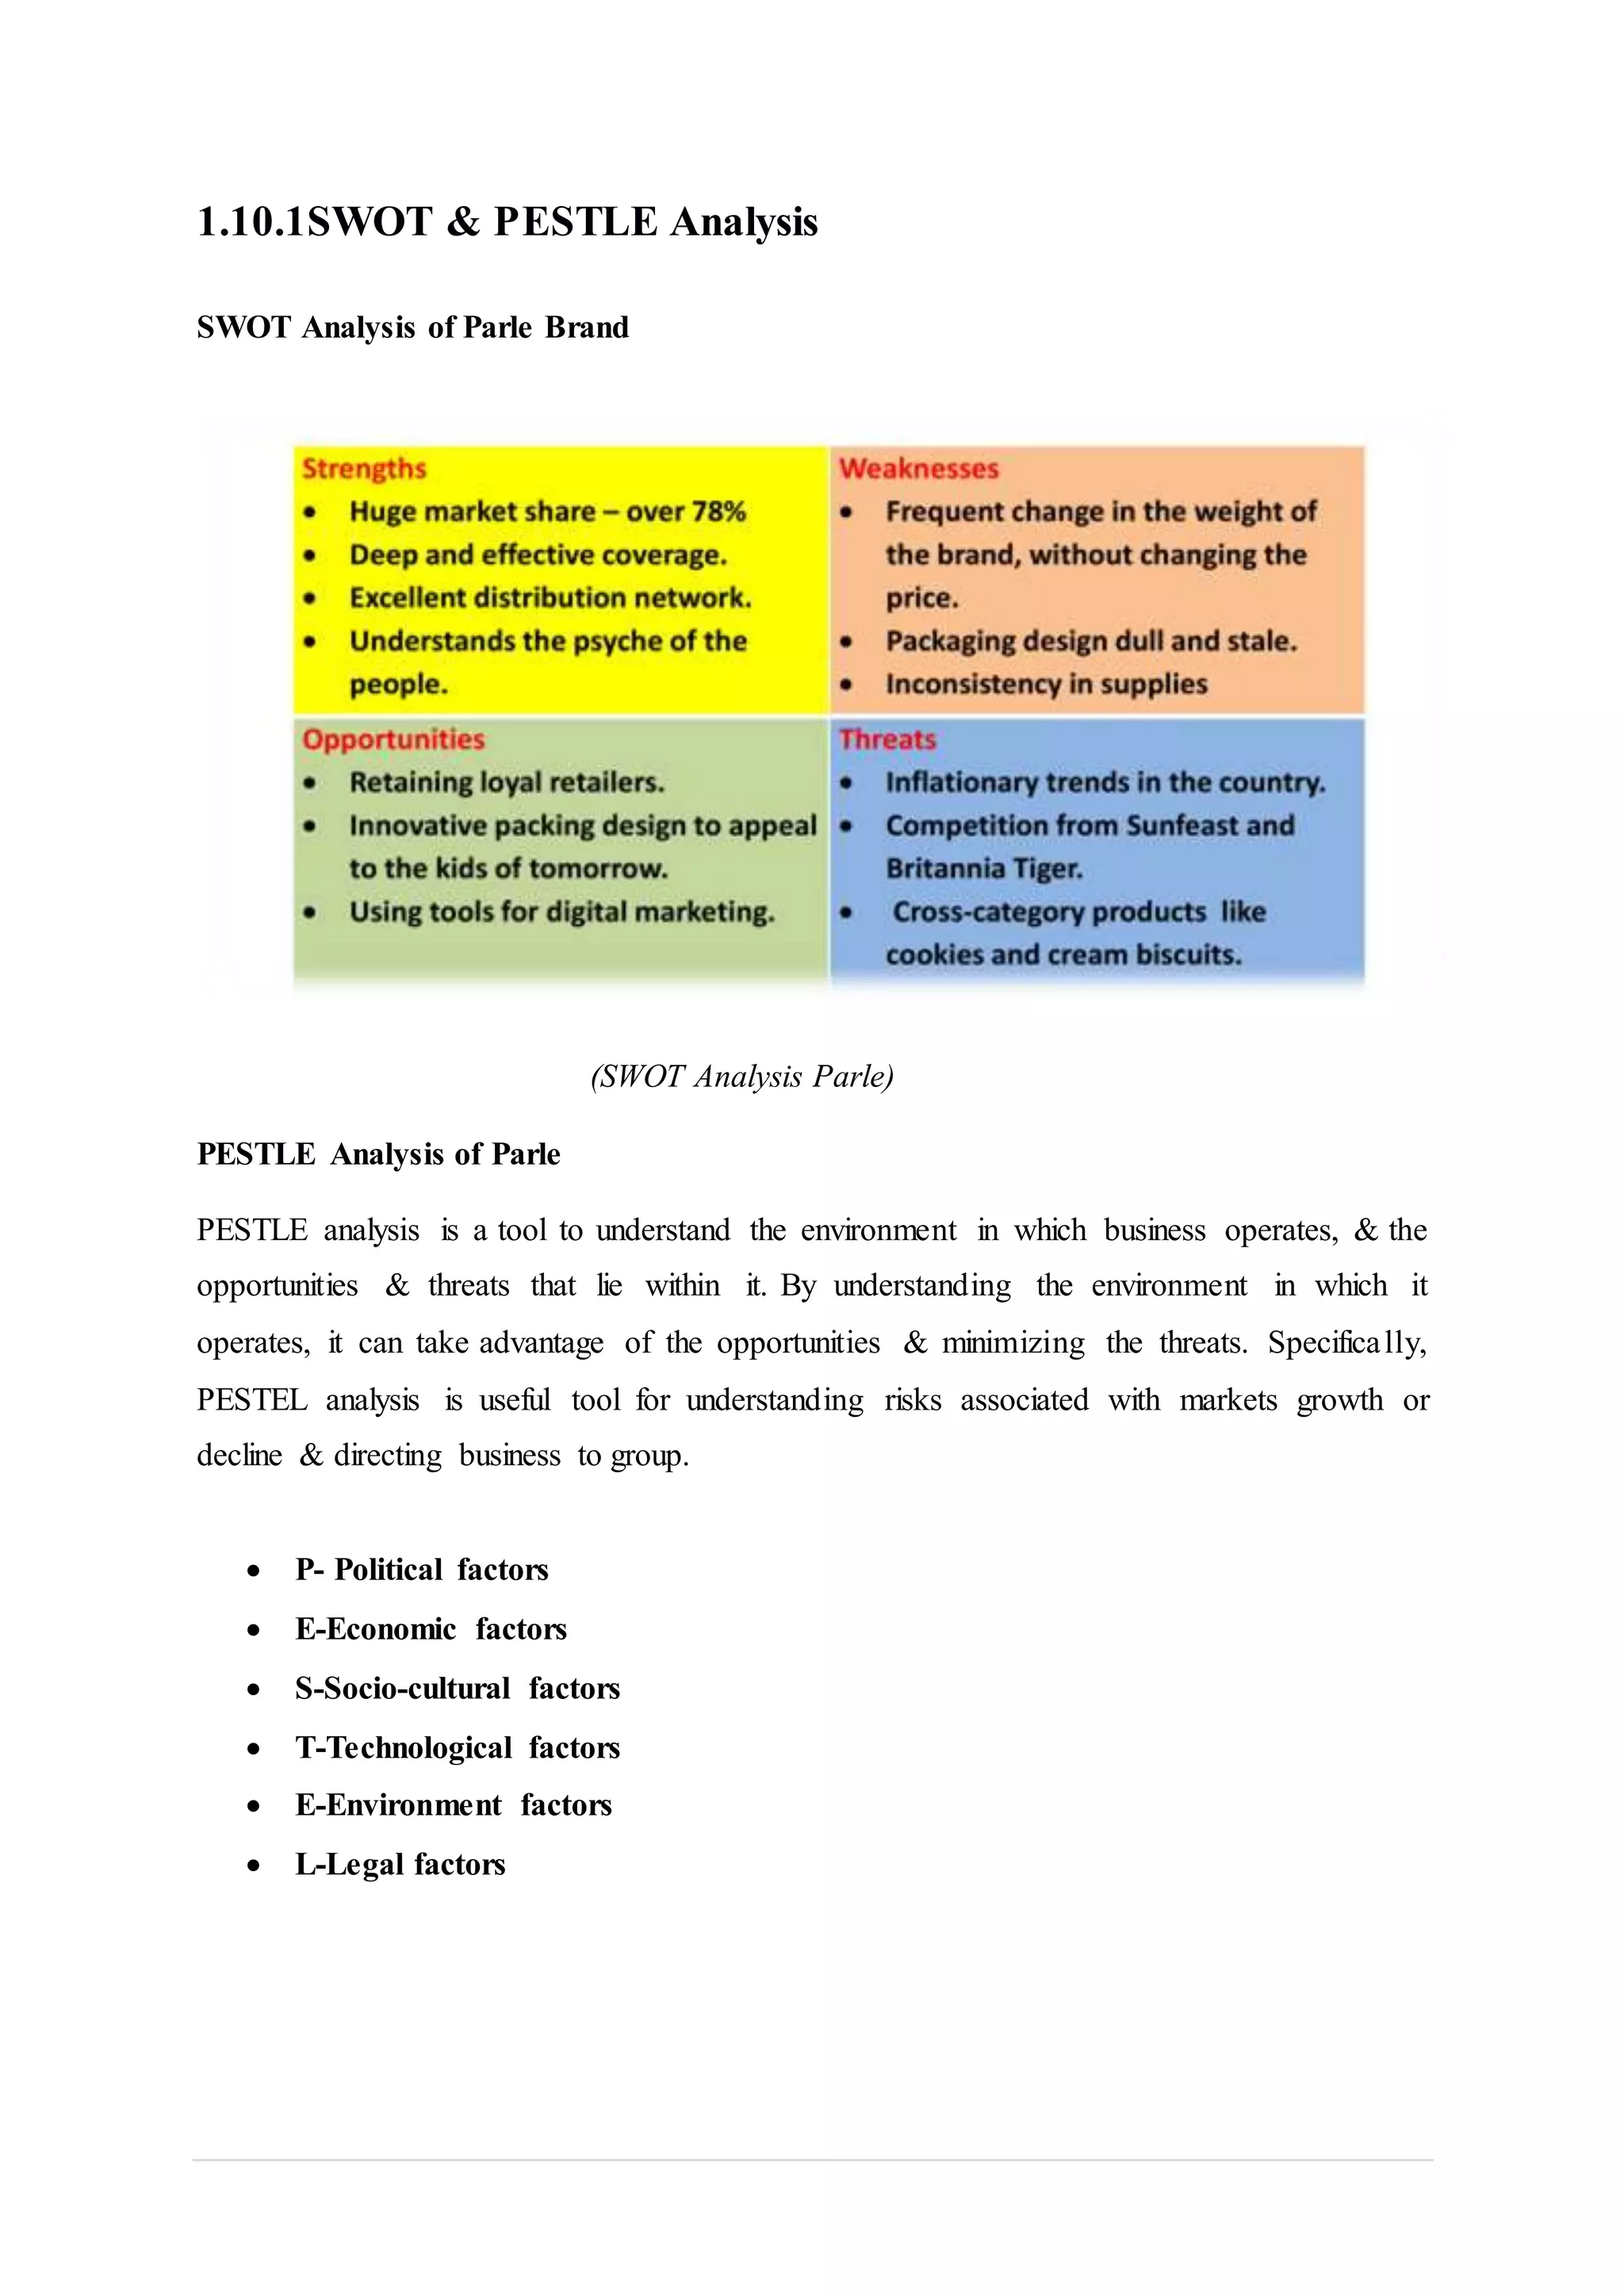
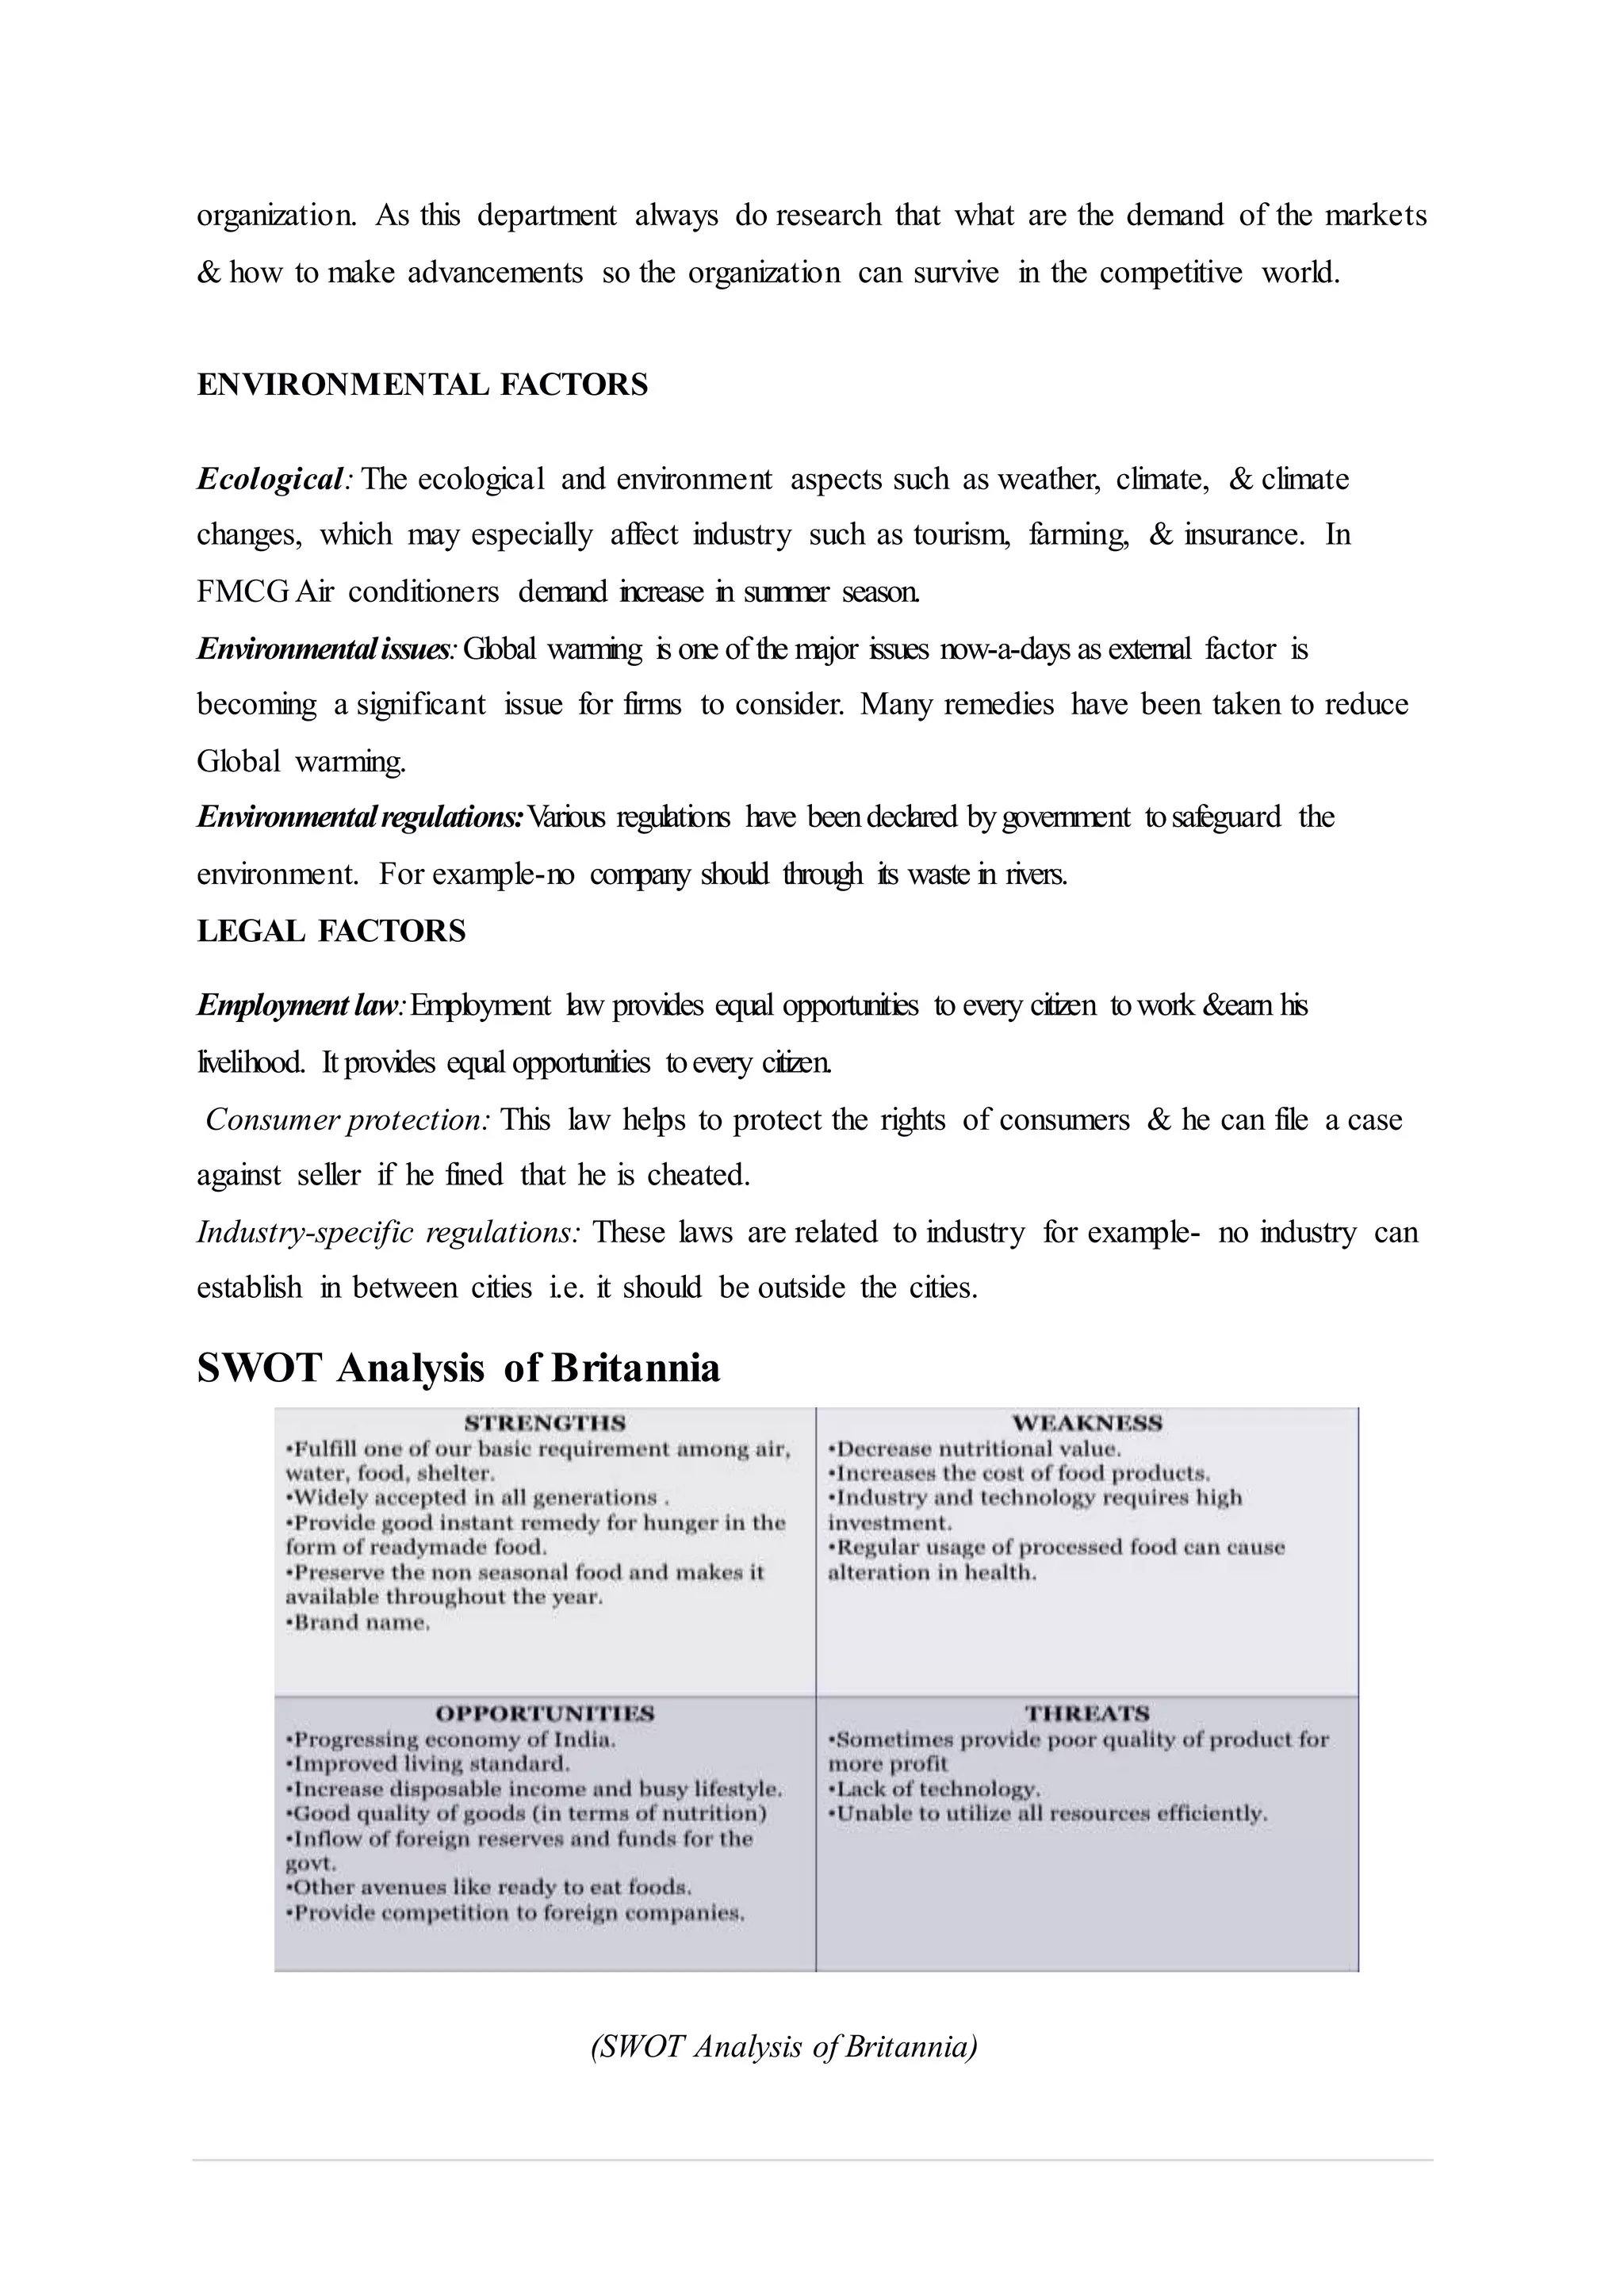
Title of the Project: Comparisonof
Consumer behavior towards “Parle”
and “Britannia”.
Contents
1.1 INTRODUCTION ...............................................................................................................3
1.2 Overview of the Sector ........................................................................................................6
Overview................................................................................................................................6
1.3 Contribution to GDP ............................................................................................................8
1.4 Domestic Completion & Foreign Competition of FMCG Sector ........................................9
1.5 Government Policies/Regulations of FMCG Sector..........................................................10
1.6 FMCG trends in India ........................................................................................................12
1.7 Products, Customers & Processes. .....................................................................................13
1.8 Sectoral Growth in last 5 Years..........................................................................................15
1.9 Other relevant information.................................................................................................17
1.10 Introduction to the Company ...........................................................................................18
1.10.1 SWOT & PESTLE Analysis .........................................................................................20
SWOTAnalysis of Parle Brand ...............................................................................................20
PESTLE Analysis of Parle .......................................................................................................20
1.10.2 BCG MATRIX ..............................................................................................................26
1.11 Objective of the Study......................................................................................................27
2.1 LITERATURE REVIEW...................................................................................................28
2.2 Identification of the Gap where no substantial work has been done. ................................44
3.1 Data Source........................................................................................................................47
3.2 Method of Data Collection.................................................................................................47
3.3 SAMPLE METHOD & SIZE ............................................................................................48
3.4 Data Analysis techniques ...................................................................................................48
List of Figures
1. Infographic reorientation of FMCG Sector ............................................ 5
2. Various FMCG Giants .......................................................................... 7
3. Growth FMCG sector in India-Infographic...........................................11
4. An Overview of FMCG products in a retail store................................. 14
5. Market Segmentation of FMCG.......................................................... 14
6. Process of FMCG sector..................................................................... 15
7. Growth from 2009-2016..................................................................... 17
8. Parle Products.................................................................................... 18
9. Britannia Products.............................................................................. 19
10. SWOT Analysis Parle......................................................................... 20
11. SWOT Analysis of Britannia............................................................... 23
12. BCG Matrix of Parle .................................................................... 26
13. BCG Matrix of Britannia .................................................................... 26
CHAPTER-1
1.1 INTRODUCTION
Fast-moving consumer goods (FMCG) sector is the 4th largest sector in the Indian economy
with Household and Personal Care accounting for 50 per cent of FMCG sales in India. Growing
awareness, easier access and changing lifestyles have been the key growth drivers for the
sector. The urban segment (accounts for a revenue share of around 55 per cent) is the largest
contributor to the overall revenue generated by the FMCG sector in India However, in the last
few years, the FMCG market has grown at a faster pace in rural India compared with urban
India. Semi-urban and rural segments are growing at a rapid pace and FMCG products account
for 50 per cent of total rural spending.
Market Size
The Retail market in India is estimated to reach US$ 1.1 trillion by 2020 from US$ 840 billion
in 2017, with modern trade expected to grow at 20 per cent - 25 per cent per annum, which is
likely to boost revenues of FMCG companies. Revenues of FMCG sector reached Rs 3.4 lakh
crore (US$ 52.75 billion) in FY18 and are estimated to reach US$ 103.7 billion in 2020. The
sector witnessed growth of 16.5 per cent in value terms between July-September 2018;
supported by moderate inflation, increase in private consumption and rural income. @
Investments/ Developments
The government has allowed 100 per cent Foreign Direct Investment (FDI) in food processing
and single-brand retail and 51 per cent in multi-brand retail. This would bolster employment
and supply chains and provide high visibility for FMCG brands in organized retail markets,
bolstering consumer spending and encouraging more product launches. The sector witnessed
healthy FDI inflows of US$ 13.63 billion, during April 2000 to June 2018.
Government Initiatives
Some of the major initiatives taken by the government to promote the FMCG sector in
India are as follows:
The Government of India has approved 100 per cent Foreign Direct Investment (FDI) in the
cash and carry segment and in single-brand retail along with 51 per cent FDI in multi-brand
retail. The Government of India has drafted a new Consumer Protection Bill with special
emphasis on setting up an extensive mechanism to ensure simple, speedy, accessible, affordable
and timely delivery of justice to consumers.
The Goods and Services Tax (GST) is beneficial for the FMCG industry as many of the FMCG
products such as Soap, Toothpaste and Hair oil now come under 18 per cent tax bracket against
the previous 23-24 per cent rate.
The GST is expected to transform logistics in the FMCG sector into a modern and efficient
model as all major corporations are remodeling their operations into larger logistics and
warehousing.
Achievements
Following are the achievements of the government in the past four years:
 Number of mega food parks ready increased from 2 between 2008-14 to 13 between
2014-18.
 Preservation and processing capacity increased from 308,000 during 2008-14 to 1.41
million during 2014-18.
 The number of food labs increased from 31 during 2008-14 to 42 during 2014-18.
(Infographic reorientation of FMCG Sector)
1.2 Overview of the Sector
Fast Moving Consumer Goods (FMCG) goods are all consumable items (other than
groceries/pulses) that one needs to buy at regular intervals. These are items which are used
daily, and so have a quick rate of consumption, and a high return. FMCG can broadly be
categorized into three segments which are:
1. Household items as soaps, detergents, household accessories, etc,
2. Personal care items as shampoos, toothpaste, shaving products, etc and finally
3. Food and Beverages as snacks, processed foods, tea, coffee, edible oils, soft drinks
etc.
Global leaders in the FMCG segment are Nestlé, ITC, Hindustan Unilever Limited, Reckitt
Benckiser, Unilever, Procter & Gamble, Coca-Cola, Carlsberg, Kleenex, General Mills, Pepsi,
Gillette etc.
Overview
The burgeoning middle-class Indian population, as well as the rural sector, present a huge
potential for this sector. The FMCG sector in India is at present, the fourth largest sector with
a total market size in excess of USD 13 billion as of 2012. This sector is expected to grow to a
USD 33 billion industry by 2015 and to a whooping USD 100 billion by the year 2025.
This sector is characterized by strong MNC presence and a well-established distribution
network. In India the easy availability of raw materials as well as cheap labour makes it an
ideal destination for this sector. There is also intense competition between the organised and
unorganised segments and the fight to keep operational costs low.
A look at some factors that will drive growth in this sector:
 Increasing rate of urbanization, expected to see major growth in coming years.
 Rise in disposable incomes, resulting in premium brands having faster growth and
deeper penetration.
 Innovative and stronger channels of distribution to the rural segment, leading to deeper
penetration into this segment.
 Increase in rural non-agricultural income and benefits from government welfare
programmes.
 Investment in stock markets of FMCG companies, which are expected to grow
constantly.
(Various FMCG Giants)
1.3 Contribution to GDP
Fast moving consumer goods (FMCG) are the 4th largest sector in the Indian economy. There
are three main segments in the sector – food and beverages which accounts for 19 per cent of
the sector, healthcare which accounts for 31 per cent and household and personal care which
accounts for the remaining 50 per cent.
The FMCG sector has grown from US$ 31.6 billion in 2011 to US$ 52.75 billion in 2017-18.
The sector is further expected to grow at a Compound Annual Growth Rate (CAGR) of 27.86
per cent to reach US$ 103.7 billion by 2020. The sector witnessed growth of 16.5 per cent in
value terms between June–September 2018; supported by moderate inflation, increase in
private consumption and rural income. It is forecasted to grow at 12-13 per cent between
September– December 2018.^ FMCG’s urban segment is expected to have a steady revenue
growth at 8 per cent in FY19 and the rural segment is forecasted to contribute 15-16 per cent
of total income in FY19.* Post GST and demonetization, modern trade share grew to 10 per
cent of the overall FMCG revenue, as of August 2018.
Accounting for a revenue share of around 45 per cent, rural segment is a large contributor to
the overall revenue generated by the FMCG sector in India. Demand for quality goods and
services have been going up in rural areas of India, on the back of improved distribution
channels of manufacturing and FMCG companies. Urban segment accounted for a revenue
share of 55 per cent in the overall revenues recorded by FMCG sector in India.
FMCG Companies are looking to invest in energy efficient plants to benefit the society and
lower costs in the long term. Patanjali will spend US$ 743.72 million in various food parks in
Maharashtra, Madhya Pradesh, Assam, Andhra Pradesh and Uttar Pradesh. Dabur is planning
to invest Rs 250-300 crore (US$ 38.79-46.55 million) in FY19 for capacity expansion and is
also looking for acquisitions in the domestic market. Investment intentions, related to FMCG
sector, arising from paper pulp, sugar, fermentation, food processing, vegetable oils and
Vanaspati, soaps, cosmetics and toiletries industries, worth Rs 165.52 billion (US$ 2.36 billion)
were implemented between January–September 2018.
Growing awareness, easier access, and changing lifestyles are the key growth drivers for the
consumer market. The focus on agriculture, MSMEs, education, healthcare, infrastructure and
employment under the Union Budget 2018-19 is expected to directly impact the FMCG sector.
These initiatives are expected to increase the disposable income in the hands of the common
people, especially in the rural area, which will be beneficial for the sector.
1.4 Domestic Completion & Foreign Competition of FMCG
Sector
Domestic Competition
India's huge population has always been a significant factor for the growth of FMCG sector in
the country. Between 1950 and 1980, the consumption of FMCG products were relatively low
due to the low per capita income. The post-liberalization era in India has witnessed a massive
growth in the selling of products in the domestic market. The Indian market also imported loads
of products from overseas markets which made increased the competition between the
organized and the unorganized sector.
The easing of the trade barriers encouraged the MNCs to invest in the Indian market to cater to
the needs of the consumers. The living standards rose in the urban sector due to high disposable
income along with the rise in the purchasing power of the rural families which increased the
sales volume of various manufacturers of the FMCG products in India. The large-scale
companies such as HUL, Godrej Consumer, Marico, Henkel, Reckitt Benckiser and Colgate
have targeted the rural consumers and have also expanded their retail chain in the mid-sized
towns and villages. On the contrary to this, Nestle has always targeted the market of urban
India and focuses largely upon the value added products for the elite class or upper middle class
population.
Consumer goods MNCs from Nestle NSE 0.06 % and Hindustan Unilever NSE 0.16 % to
Coca-Cola and PepsiCo are pushing localization to the last mile to counter regional
competition, fight back the onslaught of local brands, and expand penetration and reach in a
market that is showing green shoots of consumption revival.
“There are many India’s in India. Each of them needs to be served differently,” Nestle India
chairman Suresh Narayanan said.
The maker of Maggi noodles and Nescafe said it needs to expand beyond the top 100 towns to
ensure sustainable growth for the future and is exploring regional variants of existing brands
across its portfolio, for example, for ketchup, coffee and confectionery. “Evolving a structure
to divide the markets into 10-15 clusters. And, segmenting product variants, distribution, sales,
marketing and communication in relevant geographies should ensure better penetration in
existing markets and help expand in adjacent markets,” Narayanan said.
Foreign Competition
The largest market for the consumer goods industry is the US, followed by China. India,
Indonesia, Brazil, Mexico, and other developing countries are expected to be the new growth
engines for the sector.
In 2014, the global FMCG sector was worth $8 trillion, which is nearly the GDP of Japan and
Germany combined (India’s GDP is $2.05 trillion).
The top ten global FMCG companies, based on net sales in 2014, are Nestlé ($100 billion),
Proctor and Gamble ($83 billion), PepsiCo ($66.6 billion), Unilever ($66.1 billion), JBS ($49
billion), AB Inbev ($ 47 billion), Coco- Cola Company ($45 billion), Tyson Foods ($37
billion), Mondelēz ($34 billion), and Archer Daniel Midlands ($31 billion). The ten most
purchased brands globally are Coca-Cola (Coca-Cola Company), Colgate (Colgate-Palmolive),
Maggi (Nestlé), Lifebuoy (Unilever), Nescafé (Nestlé), Pepsi (PepsiCo), Lay’s (PepsiCo),
Knorr (Unilever), Dove (Unilever), and Tide (P&G), according to online sources.
The global consumer durables goods industry, on the other hand, was estimated to be worth
$13 trillion in 2013.
1.5 Government Policies/Regulations of FMCG Sector
 The government is working towards bringing retail, FMCG and e-commerce within a
single policy framework, which will address all the concerns of industry and
consumers, NITI Aayog CEO Amitabh Kant has said. Kant heads a high-level
committee that will review commerce rules including the FDI norms for the sector.
 Speaking at FICCI’s annual retail, FMCG and ecommerce convention Kant said, "To
provide a level playing field to stakeholders, there is a move in the government to
harmonies these varied policies." Kant said that while domestic entrepreneurs are being
encouraged in the country, foreign players will boost healthy competition in the sector.
 The domestic market would be challenged by the foreign businesses, which would
enable indigenous companies to scale up, enhance quality of products and services and
penetrate global markets. As per current policy government allows 100 per cent FDI
under approval route and any foreign investment beyond 51 per cent, it is required that
30 per cent of the value of goods be sourced from India.
 Single brand license holders can also sell through ecommerce platform under
automatic. The rules for ecommerce which were notified in March this year classify
such companies as B2B operating under marketplace model where 100 per cent FDI is
allowed.
 India does not allow FDI in B2C retail. The 12-member committee being chaired by
Kant is also looking at liberalizing the ecommerce policy with hope to further boost the
sector. The committee must give its recommendation to the Prime Minister’s office in
the next two months.
 The NITI Aayog CEO also said that India has become the top FDI destination in the
world and this has given the country access to latest technology, global best practices
and innovations. Kant said technology will play a crucial role in the growth of retail
sector.
"With a growing penetration of the internet which reaches rural areas of the country,
the retailers would be able to deepen their market."
Growth of FMCG Industry in India - Infographic
(Growth FMCG sector in India-Infographic)
1.6 FMCG trends in India
Fast moving consumer goods (FMCG) are the products that are consumed in short span of time
and are consumed daily. Examples are packed food items, soft drinks, soaps, toiletries etc. The
FMCG industry can be broadly divided into 3 segments:
 Household care: fabric wash and household cleaners
 Personal Care: oral care, health care, skin care, cosmetics, hygiene and paper products
 Food and Beverages: bakery, chocolates, snacks, tea/coffee, dairy products etc
The FMCG industry is the fourth sector is the fourth largest constituent of Indian economy and
has a market size of about 130,000 crores. In the early nineties, FMCG marketers figured out
two things:
 Rural markets are price-sensitive
 Rural markets are important since the urban markets are getting saturated.
This led to several companies in following strategies for launching package sizes and prices to
suit the purchasing sizes of the Indian consumer markets. This led to the introduction of small
sachets in all segments from oil, shampoo to beverages. Sachets led to the concept of trial
consumption.
FMCG growth is a function
 Create brand and product awareness
 Increasing consumer demand
 Growth of modern trade
 Launching new products
 Availability of online channel to shop
 Rise incomes led to purchases
 Desire to experiments with brands
 Evolving consumer lifestyles

Main characteristics of FMCG:
From the consumers’ perspective:
 Frequent purchase
 Low involvement and price
 From the marketers’ angle:
 High volume
 Low contribution margins
 High stock turnover
 Extensive distribution networks
1.7 Products, Customers & Processes.
Products:
Fast-moving consumer goods, commonly abbreviated FMCG, are non-durable goods that sell
quickly. It is considered a unique business model that requires competitive advantages in areas
such as manufacturing, branding, advertising and logistics. The following are examples of
FMCG product types.
 Processed Foods: Processed foods such as breakfast cereal.
 Beverages: Packaged beverages such as fruit juice and bottled water.
 Dry Goods: Dry goods include things such as coffee, tea, sugar and beans.
 Prepared Meals: Prepared ready to foods such as bento boxes.
 Cosmetics: Cosmetics such as hairstyling products.
 Toiletries: Toiletries such as toothpaste.
 Over-the-counter Medications: Basic medications that are available without a
prescription.
 Candy: Candy such as chocolate bars.
 Fresh Food: Fresh food such as fruits and vegetables that are perishable.
 Frozen Food: Frozen items such as ice cream that require a temperature-controlled
supply chain.
 Baked Goods: Baked goods such as cookies.
 Consumer Electronics: Although consumer electronics are typically durable, fast
selling ideas such as memory cards or headphones may be considered FMCG.
 Office Supplies: Consumable office supplies such as pens and paper.
 Cleaning Products: Cleaning products such as baking soda.
(An Overview of FMCG products in a retail store)
Customers of FMCG
(Market Segmentation of FMCG)
Processes:
(Process of FMCG sector)
1.8 Sectoral Growth in last 5 Years
Some of the major initiatives taken by the government to promote the FMCG sector in India
are as follows:
The Government of India has approved 100 per cent Foreign Direct Investment (FDI) in the
cash and carry segment and in single-brand retail along with 51 per cent FDI in multi-brand
retail.
The Government of India has drafted a new Consumer Protection Bill with special emphasis
on setting up an extensive mechanism to ensure simple, speedy, accessible, affordable and
timely delivery of justice to consumers.
The Goods and Services Tax (GST) is beneficial for the FMCG industry as many of the
FMCG products such as Soap, Toothpaste and Hair oil now come under 18 per cent tax
bracket against the previous 23-24 per cent rate.
The GST is expected to transform logistics in the FMCG sector into a modern and efficient
model as all major corporations are remodeling their operations into larger logistics and
warehousing.
Achievements
Following are the achievements of the government in the past five years:
 Number of mega food parks ready increased from 2 between 2008-14 to 13 between
2013-18.
 Preservation and processing capacity increased from 308,000 during 2008-14 to 1.41
million during 2013-18.
 The number of food labs increased from 31 during 2008-14 to 42 during 2014-18.
 Rural consumption has increased, led by a combination of increasing incomes and
higher aspiration levels; there is an increased demand for branded products in rural
India. The rural FMCG market in India is expected to grow to US$ 220 billion by
2025 from US$ 23.6 billion in FY18. In FY18, FMCG’s rural segment contributed an
estimated 10 per cent of the total income and it is forecasted to contribute 15-16 per
cent in FY 19. ^ FMCG sector is forecasted to grow at 12-13 per cent between
September–December 2018. @
 On the other hand, with the share of unorganized market in the FMCG sector falling,
the organized sector growth is expected to rise with increased level of brand
consciousness, also augmented by the growth in modern retail.
1.9 Other relevant information
(Growth from 2009-2016)
1.10 Introduction to the Company
Parle
Parle Products was established as a confectionery maker in the Vile Parle suburb of Jaliawala
Bagh, in 1929. It began manufacturing biscuits in 1939. In 1947, when India became
independent, the company launched an ad campaign, showcasing its Gluco brand of biscuits
as an Indian alternative to British-branded biscuits.
Parle-G biscuits were earlier called 'Parle lelo' Biscuits until the 1980s. The "G" in the name
Parle-G originally stood for "Glucose", though a later brand slogan also stated, "G for
Genius”. In 2013, Parle- G became India's first FMCG brand to cross the ₹ 5,000 crore mark
in retail sales.
Parle Products
(Parle products)
Britannia
Britannia Industries Limited is an Indian food-products corporation headquartered in Kolkata,
West Bengal. It sells its Britannia and Tiger brands of biscuits, breads and dairy products
throughout India and in more than 60 countries across the globe. Britannia has an estimated
market share of 38%. The biscuits were manufactured in a small house in central Kolkata.
Later, the enterprise was acquired by the Gupta brothers mainly Nalin Chandra Gupta, an
attorney, and operated under V.K Brothers." In 1918, C.H. Holmes, an English businessman in
Kolkata, was taken on as a partner and The Britannia Biscuit Company Limited (BBCo) was
launched. The Mumbai factory was set up in 1924 and Peek Freans UK, acquired a controlling
interest in BBCo. Biscuits were in high demand during World War II, which gave a boost to
the company’s sales. The company name was changed to the current "Britannia Industries
Limited" in 1979.
Britannia Products
(Britannia Products)
1.10.1SWOT & PESTLE Analysis
SWOT Analysis of Parle Brand
(SWOT Analysis Parle)
PESTLE Analysis of Parle
PESTLE analysis is a tool to understand the environment in which business operates, & the
opportunities & threats that lie within it. By understanding the environment in which it
operates, it can take advantage of the opportunities & minimizing the threats. Specifically,
PESTEL analysis is useful tool for understanding risks associated with markets growth or
decline & directing business to group.
 P- Political factors
 E-Economic factors
 S-Socio-cultural factors
 T-Technological factors
 E-Environment factors
 L-Legal factors
PESTEL ANALYSIS ON PARLE INDUSTRY: -
POLITICAL FACTORS-
Political stability: Political stability is one of the important most factor which influence the
growth of business directly. If Political stability is higher, then it leads to perfection in business
&onthe other hand if there is instability the business will have to suffer.
Taxation policy: Tax policy of government will affect the price of inputs & it ultimately affect
the prices of final products & it will directly affect the sale of product.
The subsidies which are provided by government to different organization at different level
also help it to grow at faster rate & helps the organization in reducing the finance.
Trading policies: This indicates the policies related to import & export of goods and services
from different nations. If the policies are favorable more goods & services will be imported&
exported, &onthe other hand if policies areunfavorable it will restrict the import &export.
Labor law: Labor law also affect the organization, for example- child labor, a child below14 year of age
cannot work in factory or any hazardous place.
ECONOMIC FACTORS
Interest rates: Interest rate directly affect the cost of capital, if the interest rate is higher the cost
of capital will increase & if it is lower than cost of capital will be lower. This directly affect the
profit of the organization & it’s growth.
Tax charges: If the tax charged by the government is lower than it will reduce the product price & if it is
higher than it will increase the prices of the products. Exchange rates: This shows that what is
the exchange rate or foreign currency rate. If exchange rate is higher more amount is paid onimport of
goods &if it lowers less amount is tobepaid &onthe other hand if it is higher the amount received will bemore
&if it is lower the amount received will below. National income: National income is important factor
as if affect the growth of the organization. If percapita income is more the amount spend will bemore &
if it will belower the amount spent will beless. Economic growth: Economic growth is important factor
in the development of the organization. Ifeconomy grows at ahigher speedit will directly affect the growth
of the organization. Inflation rate: Inflation means the rise in the value of all the product in the economy, if
inflation rate is higher the cost ofproducts will behigher & if inflation rate is lower the cost of product will be
lower. This directly affect the growth of the organization.
SOCIOCULTURAL FACTORS
Demographics: Demographics is the study of human population in the economy. It helps the organization to
divide the markets in different segments to target a large of customers. For Example- according to race,
age, gender, family, religion, & sex.
Distribution of income: This shows that how income is distributed in the economy. It directly
affects the purchasing power of the buyers. And ultimately leads to increase ordecrease in the consumption
level of the products.
Changes in life style: Change in life style also leads to increase or decrease in the demand for different
commodities. For example-presently LCD & LED TV’s have replaced Digital
displayed TV set, this shows that the changes in life style of consumers. Consumerism: This
indicates that many options are available while purchasing of goods to consumers, so the choice becomes easy
& quality products can be choose by consumers. So, while purchasing a consumer have different
choices to select product according to his needs. Education levels: Education is one of the most
important factors which influence the buying power of consumer, while selecting agood a consumer
should know all its features so it can differentiate them with another products.
Law affect social behavior: Different laws are made by the government to safe guard the rights of
consumers. For example- Consumer protection act, this law indicates that a consumer can file a
case against aseller if he finds that he is cheated.
TECHNOLOGICAL FACTORS
Advancement in technology: New technology helps in economizing the scale of production,
this means that new technology helps in increasing the level ofproduction, &reducing the costs of inputs, &
maximizing the level of profits. Discoveries & innovation: Advancement in technology will leads to
discoveries &innovations & further improvements in technology to improve perfections in the
production process.
Competitive forces: Advancement in technology will also leads to competition in the markets,
more quality products will beprovided to consumers to cover many markets.
Automation: Change in technology will leads to automation, this means that with new
technology labor required is less as machines are automatic. All the works are done automatically by the
machines as earlier it is labor oriented. Nowall the work is machine oriented.
Obsolete rate: Day-by-day new inventions are made so the rate of obsolete is higher, as in
Computer LAPTOPS have replaced the PC. This shows that the technology becomes obsolete very fast.
Research & development: This department plays a vital role in the development of the
organization. As this department always do research that what are the demand of the markets
& how to make advancements so the organization can survive in the competitive world.
ENVIRONMENTAL FACTORS
Ecological: The ecological and environment aspects such as weather, climate, & climate
changes, which may especially affect industry such as tourism, farming, & insurance. In
FMCG Air conditioners demand increase in summer season.
Environmentalissues:Global warming is one of the major issues now-a-days as external factor is
becoming a significant issue for firms to consider. Many remedies have been taken to reduce
Global warming.
Environmentalregulations:Various regulations have beendeclared bygovernment tosafeguard the
environment. For example-no company should through its waste in rivers.
LEGAL FACTORS
Employment law:Employment law provides equal opportunities to every citizen towork &earn his
livelihood. It provides equal opportunities toevery citizen.
Consumer protection: This law helps to protect the rights of consumers & he can file a case
against seller if he fined that he is cheated.
Industry-specific regulations: These laws are related to industry for example- no industry can
establish in between cities i.e. it should be outside the cities.
SWOT Analysis of Britannia
(SWOT Analysis of Britannia)
PESTLE Analysis of Britannia
Political:
Exemption on Customs Duty on Sugar Raw Material Import: Due to the shortage in the
production of sugar the deadline for the exemption on customs duty on raw sugar imports has
been extended. Exemption on customs duty will help in purchasing sugar at lower cost, which
in turn will control the cost of production.
VAT on Biscuits: The VAT of 12.5% on Biscuits. Price of the biscuits might need to be
increased due to the high VAT rates which may result in switch of brands due to the highly
competitive market.
Economical
Shortage of Milk: Even though the milk production has risen by 4.6% compound annual
average growth rate, it still cannot match up with the increasing demand. Price of milk
increased by 12.6% to 13.6%. This can cause an increase in the input cost for the dairy products
and which in turn can lead to hike in price or lower profit margins.
Globalization: Globalization a universal phenomenon is affecting each industry. This can
serve as an opportunity to expand the business to a global level but on the other hand there is
a threat of new entrants from international market.
Requirements for Logistics: Logistics in India suffer due to the poor infrastructure and other
limitations. Sophisticated third-party logistics system will help in proper supply chain
management and on time delivery of goods, which help in maintaining the shelf life of goods
on meeting the demand on time.
Social:
Need for Healthy Eating Habits: Studies say that Indians are more prone to Coronary Artery
Disease (CAD), which is the major independent risk factor causing Cardiovascular diseases,
due to the smaller calibre arteries found in Indians. This suggests that Indians should move
towards more
healthy food and diet. This could be a new area to explore for Britannia with its new health
associated products like Nauti-Choice biscuits and ACTi mind flavoured milk.
Problems with Cloned Livestock: Cloned animals are supposed to be suffering from large-
offspring syndrome. The mother cows face a problem in giving birth to the cloned animals as
they are larger than normal. Also, these cloned animals suffer from health which might make
unsafe to consume the produce from them.
Technological:
Cloningof Livestock:India, a late entrant in cloning research, is now moving with a great pace
in cloning technology. ‘Hand guided cloning technique’, a technique very different from the
conservative cloning practice has been a successful venture.
New Age Packaging: The new packaging systems help in protecting food from micro-
organisms by creating shelter layer. It uses new technologies like oxygen scavenging function,
atmosphere control, bio-degrability etc. and is low cost.
Environmental:
Change in theClimaticConditions:Climate plays an important role in the agriculture process.
The change in the rainfall pattern has been a matter of concern now in India. The agriculture
sector in areas which are monsoon dependent suffered badly due to the change in the rainfall
pattern. The sector suffered a huge loss in terms of total output. The loss in crop will affect the
input supply and this might delay or cause problems in the production. So, the industry might
not be able to meet the demands resulting in the loss of customers.
Legal:
Raising the Norms for the Probiotic Food: There is a need for setting the standards for
probiotic food. Clinical tests should be conducted on the probiotic foods before they could
reach the market for sale. The Indian Council of Medical and Research has submitted the
proposal for the same to the government. Strict norms will help in raising the quality standards
but on the other hand the cost and time of production might subsequently increase.
1.10.2 BCG MATRIX
BCG Matrix of Parle
BCG Matrix of Britannia
(BCG Matrix of Britannia)
1.11 Objective of the Study
1. To Study in Detail Likes and Dislikes of the Consumers.
2. To Know the Market Competition.
3. Identify the consumer response to the company’s product.
4. Know the consumers’ needs and expectations.
5. Seek maximum information about the consumer, i.e. the know consumers’ income
range, their location, buying behavior, etc.
6. Know the nature and extent of competition and the strength and weaknesses of the
competitors.
7. Evaluate the reputation of the company in the market.
8. Search for new marketing opportunities.
9. Find out alternative uses of the existing products.
10. Estimate the cost of marketing of goods and service.
CHAPTER-2
2.1 LITERATURE REVIEW
Research Paper-1
1.A Study on ConsumerAttitude and Satisfactionin Parle-G Biscuits at
Madurai.
By K. Vidhya, Research Scholar, Department of Business Administration, Kalasalingam
University, Tamilnadu, India.
This paper gives itemized data about the development of FMCG industry in India. It looks at
the developing mindfulness and customer attitude and awareness among Parle-G Biscuits in
Madurai branch and how the urban and semi-urban retail markets are seeing critical
development Fast Moving Consumer Goods (FMCG) Industry, on the other hand called as CPG
(Consumer Packaged Goods) industry principally manages the creation, appropriation and
advertising of shopper bundled merchandise. FMCG industry is additionally expanding,
particularly in India, where FMCG industry is viewed as the fourth biggest area with aggregate
market size of US$13.1 billion. Parle-G is one of the FMCG items. Parle-G is the biggest
offering scone on the planet. The main success of Parle-G is they have very strong distribution
channel and they also reach the rural areas. The dealers will take them to their areas and from
them sub-dealers will get the goods and at last it will be distributed to retailers and other stores.
The researcher used statistics tools of percentage analysis and ANOVO and give some
suggestions.
Introduction:
The organization's trademark is G implies Genius. The name, "Parle-G", is gotten from the
name of the rural rail station, Vile Parle which thus depends on town Parle in long time past
days (there is additionally range called Irle close-by where the Parle Agro creation industrial
facility is based). his prevalent roll is principally eaten as a break time nibble. Parle-G is the
biggest offering bread on the planet. It has a 70% piece of the pie in India in the glucose bread
classification taken after by Britannia, Tiger (17-18%) and ITC's Sunfeast (8-9%). The brand
is evaluated to be worth over Rs 2,000 crore (Rs 20 billion) and contributes more than 50 for
each penny of the organization's turnover (Parle Products is an unlisted organization and its
administrators are not open to revealing definite numbers). Last monetary, Parle had offers of
Rs 3,500 crore (Rs 35 billion). It likewise is well known over the world and is beginning to
offer in Western Europe and USA.
Parle products
Biscuits
• Parle-G
• Hide and Seek
• Krackjack
• Hide and Seek Milano
• Monaco
• Parle Marie
Review of the Literature
Frank Alpert, School of Marketing, Griffith University, Australia and Michael Kamins,
Marshall School of Business, University of Southern California gave a supposition on Retail
purchaser convictions, state of mind and conduct toward pioneer marks as under; One potential
wellspring of pioneer brand preferred standpoint is retail purchasers' inclination for pioneer
brands. A model of pioneer brand advantage with retailers created in the USA was tried in
Japan, as a replication and diverse expansion. This gives the primary experimental
investigation of Japanese retail purchaser convictions, mentality, and conduct toward new
offerings, and the main direct measurable examination of US and Japanese retail purchasing
conduct in the promoting writing.
A comparative study of Syeedun nisa and jamia hamdard gives a opinion on FDI in Indian
Retail Industry and suggest that: Recently organized retailing has become more popular in big
cities in India and most of the metropolitan cities and other big cities are flooded by modern
organized retail stores. Many semi-urban areas also witness entry of such organized retail
outlets.
Hongliu and Peter j.MC Goldrick gives a opinion on international retail sourcing and furnished
the following suggestions; In spite of significant research on worldwide sourcing by producers
and the quick improvement of global sourcing channels by retailers, both reasonable and
experimental reviews on universal retail sourcing have been few and far between. They analyze
the ebb and flow patterns of global retail sourcing and draws qualifications between universal
sourcing by makers and worldwide sourcing by retailers. Drawing upon the orders of business
strategy, economics, and authoritative conduct, they build up a structure for global retail
sourcing that connections the unique circumstance, universal sourcing technique, and
execution.
Paul TM buru and koketso paules undertake a study on consumer behavior on food retailing
and furnished the following: A study should be carried out to get the retailers perspective with
regards to in store foods and how they counter act the negative perceptions of the in-store foods.
It would be desirable to contrast the results in other reprehensive geographical areas in
Botswana.
Objectives of the Study
• To reveal the profile of the respondents(retailers)
• To understand the retailers’ attitude towards parle-G Biscuits
• To know the retailers’ satisfaction towards parle-G Biscuits
• To know the customer awareness of parle-G Biscuits through retailers
Scope of the Study
This study explores Retailers profile and Retailers attitude towards Parle-G in Madurai. It also
brings customer awareness & current market situation. The findings of the study have
significant implications for the company to provide quality services to Retailers and as well as
to the customers.
Limitations of the Study
• The Study is carried out in Madurai City Only. So, the result of the study cannot be
generalized.
• The period of study was short, and the data relevance would confine to this period only.
• The study of Retailers attitude is a qualitative one, which gives room for interviewer and
respondents bias.
Suggestions
The company should introduce new variety of biscuits in different quantities of packs for
keeping the market position and for stable sales volume. The sales persons must be visited the
shops more than 3 times/week and, they collect the feedbacks from the retailers. The company
should introduce new advertisements like Shakthi man advertisements to increase sales
volume.
Conclusion
All the retailers are dissatisfied on the sales of the Parle biscuits. They also has good opinion
about Parle biscuits but profit margin is insufficient. The retailer’s attitude about Parle-G
biscuits is fair.
Research Paper-02
CUSTOMERS PREFERENCE AND ATTITUDE TOWARDS BRITANNIA
PRODUCTS –A STUDY WITH SPECIAL REFERENCE TO THENI DISTRICT –
TAMILNADU.
Dr. V. Kannan, M.Com,M.Phil.,Ph.D.,SET.,
Head,
PG Department of Commerce,
Theni Kammavar Sangam College of Arts and Science, Koduvilarpatti, Theni, India
ABSTRACT
Britannia products are liked by all individuals irrespective of age and sex. So from childhood
to retirement age everyone is used to take Britannia biscuits as a delicious food during morning
and evening for tea breaks. Hence the Britannia products are moving fast in the market as all
the people consumes variety of biscuits, bread, rusk, cakes and dairy products. Now a days
Britannia has established its own market in major parts of the country. The retailers are the
main intermediaries who frequently meet the ultimate consumer of the Britannia product. They
now show the consumer preference and attitude towards products having different brands.
Once they lose the existing customer, they could not get them back. Further, they could not get
potential customers. Hence it is inevitable to have a thorough study on customer preference
and attitude towards Britannia product in Theni district. The study also reveals the reason for
buying the Britannia products. Random sampling and convenience sampling are used for the
study. The techniques that are used for data collection is questionnaire. The study covered 300
respondents belonging to Theni district. Tools and techniques used are simple percentage, Chi
Square test, Garret ranking techniques and Factor analysis. The study shown that the majority
of consumed Britannia product and the entire respondents are aware of Britannia products.
Various factors are analyzed for buying Britannia product.
INTRODUCTION:
The word biscuits have a Latin origin and is derived from two words, ‟biscuit‟ meaning twice
and „coctus‟ meaning to cook. This referred to the earliest process of making biscuits where
first they were baked and then dried. India’s biscuits industry came into major existence and
started gaining a sound status in the bakery industry in the later part of the 20th century when
the urbanized society called readymade food products at a tenable cost. Indian biscuits industry
seems to be largest among all the food industries and has a turnover of around Rs.3000 crores.
Britannia Industries Limited is an India food products corporation based in Kolkata, West
Bengal in India. It is famous for its Britannia and tiger brands of biscuits. Which are popular
thought the country. Britannia has an estimated 38% market share. The company’s principal
activity is manufacture and sales of biscuits, bread, rusk, cakes, and dairy product1.
In olden days, Britannia was considered as almost the monopolistic company in confectionary
items, but at present there are number of competitors in the market. The Britannia Company
has established its own market in major parts of the country.
STATEMENT OF THE PROBLEM:
Biscuits are small flat cake that is crisp and usually sweet. It is concerned with the taste and
habits of the people. Previously, it was used as a diet for patients and energy and taste for kids.
Nowadays, biscuits are considered as a good alternative for oily snacks and fast food. So
currently, among all biscuits available in the market, Britannia has become one of the popular
biscuits among the people of all segments and ages. In business world, many brands of products
are produced and marketed by a single manufacture. The decision whether to buy or not
depends only based on consumer motives. Modern market is consumer oriented and now the
consumer is the decisive force. Hence, it is inevitable to have a thorough study on customers‟
attitudes and preference towards Britannia products and the research world reveals the result
about satisfaction level and consumer preference towards Britannia products under study area.
REVIEW OF LITERATURE:
K. M. Mubarak Ali (1993) in his study endeavoured “to find out the purchasing pattern brand
preference, brand loyalty and suggest and suitable measures to improve the brand loyalty. The
study was concluded that a carefully chosen promotion strategy is to be used to increase the
brand loyalty of the product. The purchases of consumer durables are influenced by personal
opinions. Well brand sales force may be used to persuade the prospective customers2.
Renuka and Hireken chanagoudar (2008) in them on a “study on consumer buying behaviour
of ready-to-eat food products”. To determine the market penetration of Britannia Marie biscuits
by retailers. The data were collected from 150 respondents. The tools used in are simple
percentage and correlation co efficient. It is concluded that the main factors influencing brand
preference for biscuits, chips, fruit juice and ice creams were quality, taste and reasonable price.
Thus, the study revealed that the younger generation preferred more ready-to-eat food products
than the other age groups. The consumer behaviour also varies from product to product3.
F. Mohamed Sabura, and Dr. T. Vijayakumar (2009) made a” study on retailer attitude towards
Britannia biscuits with special reference to rural areas of Coimbatore city”. To analyse the
customer satisfaction about Britannia biscuits. the total sample respondents were fixed at
judgment randam basis. The data was collected from 250 respondents in Coimbatore city.
Different statistical tools are for used by analysis of the collected data, such as tabulation,
percentage analysis, bar diagram, ANOVA and Karl Pearson‟s co efficient of correlation. The
conclusion draws from the retailer‟s point and that, the distribution system of Britannia biscuits
needs improvement through the direct selling method to satisfy the customer.
Mr. S.D. Nidhyananth, and Mr. B. Vigneshwaran (2011) in made a “study on customer
satisfaction towards Britannia biscuits in Coimbatore city”. To find out the factors those
influence the purchase of Britannia biscuits. The data are collected directly from the sample by
interviewing or mailing questionnaires at particular period of time. In this study the sample
size was 100 respondents. Tools used in this study are percentage analysis, chi square test. It is
concluded that consumer’s satisfaction with preferable taste, awareness about various brands,
about choice and their frequency of preference satisfaction of Britannia biscuits 5.
Suresh Garg (2010) carried out a study entitled “A study on consumer preference towards
Britannia Good day biscuit” Detailed that Day by day the intensifying global competition is
throwing challenges in the form of uncertainty and fluctuation in demand, necessity to provide
wide variety to attract and hold the ever-demanding customer. To survive and succeed under
such competitive environment, organizations are forced to find and adopt efficient and effective
ways for their operations. Organizations are seeking ways to increase the value of their products
and services by eliminating unnecessary processes and practices from all systems. Lean
manufacturing is a systematic team-based approach for finding and eliminating waste. The
implementation of Lean manufacturing system helps organisations to reduce lead-time and
inventory, improve quality, and achieve better on-time deliveries and utilisation of resources
leading towards increased sales and profit through customer satisfaction. The Indian biscuit
industry is the third largest manufacturer of biscuit in the world producing around 60% of the
total production in organised sector and the balance 40% by the unorganized bakeries 6.
According to Moye & Kincade, Consumers express preference or lack of preference for stores,
brands, advertisements and other marketing stimuli by reflecting a favourable or unfavourable
attitude. In this sense, consumers with a favourable attitude towards a store will most likely
select the store and buy its products, but consumers with unfavourable attitudes will not select
the store and not purchase the products.
Problems of Britannia Products Users:
Health issue factors occupied 1st rank position and last rank is allotted to of smell factor
among Britannia products during the under-study period.
Factor analysis towards Purchase of Britannia Products:
The important factors motivating buying decision behaviour of Britannia product are quality,
advertisement, cost and goodwill during the study period.
An analysis of explanation of higher factor loading revealed that the above said variables
recorded factor to the extent of 71.0 percent, 63.9 percent, 68.3 percent, and 75.5 percent
respectively during the study period.
SUGGESTIONS:
Based on the findings of the study, the researcher would like to give following suggestions to
strengthen business and consumer satisfaction level.
 The company to retain its market leadership should concentrate in sales promotion
activities, which would enhance the sales of Britannia products.
 Special programs me can be organized to motivate the dealers and retailer to gain
awareness about various schemes and to push the sales.
 Point of purchases display for Britannia should be increased. Britannia is found to be
preferred by majority of the customers.
 Some of the respondents informed that the Britannia Company demand more deposits
from the dealer, Hence the company should try to reduce the deposits amount from the
dealers that will help the company to retain the existing dealers.
 A few respondents informed that the Britannia Company does not give more
advertisement compared to other companies. Hence the company may concentrate on
advertisement to attract major customers.
 Mostly respondents suggested in reduction of price.
 They may also use innovative packing methods for covering the biscuits packs.
 Britannia industries may bring a variety of new tastes in biscuits.
CONCLUSION:
The modern marketing and business are fully consumer and customer oriented. These ideas should be
kept in mind with all the manufacturers. Otherwise,they have to lose the existing customers.
All the companies should try to satisfy the desires and needs of the customers in all possible ways. As
there are heavy competitions in the confectionary items, the Britannia industry should be very careful
about customer satisfaction. The Company new products contribute considerable market share in the
total market.
Britannia products are most popular among its users mainly because of its taste and preferences,low
price and much more availability. Customers ask for specific biscuits of Britannia in retail shop because
of their advertisement. If the brand is not available, they would not recommend any other brand.
Research Paper -03
An Overview of Indian FMCG Sector
February 2016 ISSN - 2250-1991 | IF: 5.215 |
Dr. Pramod H. Patil
Assistant Professor, School of Management Sciences, SRTMU
Sub-centre Latur.
INTRODUCTION
The Fast-Moving Consumer Goods (FMCG) sector is the key contributor of the Indian
economy. This fourth largest sector of Indian economy provides employment to around 3
million people which accounts for approximately 5% of the total factory employment in the
country. These products are daily consumed by each strata of the society irrespective of social
class, income group, age group etc. FMCG sector is more lucrative because of low penetration
levels, well established distribution network, low operating cost, lower percapita consumption,
large consumer base and simple manufacturing processes for most of products resulting in low
capital investments.
The industry is highly competitive due to presence of multinational companies, domestic
companies and unorganized sector. A major portion of the market is captured by unorganized
players selling unbranded and unpackaged products. More than 50 per cent of the total revenues
of FMCG companies come from products worth Rs 10 or less1. This has made the proliferation
of localized brands which are offered in loose
form in small towns and rural part where brand awareness is low. In last 10 years domestic
players are giving tough competition to multinationals; infect they have outstripped many
MNCs in growth and market cap. Between 2005- 2014 the profit of domestic companies
increased by 24% against 14% increase of multinational companies.
OBJECTIVES
• To understand the concept of FMCG
• To present an overview Indian FMCG sector
• To critically analyze Indian FMCG sector
Part A) Fast Moving Consumer Goods
Fast Moving Consumer Goods are inexpensive products that require little shopping efforts
These are non-durable products which are sold in packaged forms. These products are
purchased by the end-consumer in small quantities and frequently. The main FMCG segments
can be classified as Personal Care, Household care, Branded and Packaged food and Tobacco.
• Personal Care: It consists of oral care; hair care; skin care; personal wash (soaps); cosmetics
and toiletries; deodorants; perfumes; paper products (tissues, diapers, sanitary); shoe care etc.
• Household Care: It comprises of fabric wash (laundry soaps and synthetic detergents);
household cleaners (dish/utensil cleaners, floor cleaners, toilet cleaners, air fresheners,
insecticides and mosquito repellants, metal polish and furniture polish).
• Branded and Packaged Food and Beverages:It consists of health beverages; soft drinks;
staples/cereals; bakery products (biscuits, bread, cakes); snack food; chocolates;
ice cream; tea; coffee; processed fruits, vegetables and meat; dairy products; bottled water;
branded flour; branded rice; branded sugar; juices etc.
• Spirits and Tobacco: An exact product-wise sale breaks up for each of the items is difficult.
(Graphical representation of Different category of FMCG Sector)
Part B) Overview of Indian FMCG Sector History
The Indian Fast-Moving Consumer Goods (FMCG) industry began to shape during the last
fifty odd years. The growth of FMCG industry was not significant between 1950’s to the 80’s.
The FMCG industry previously was not attractive from investor’s point of view due to low
purchasing power and the government’s favoring of the small-scale sector. FMCG’s growth
story further continued following the deregulation of Indian economy in early 1990s. With
relatively lesser capital and technological requirements, several new brands emerged
domestically as well, while the relaxed FDI conditions led to entry of many global players in
this segment. These factors made FMCG market in India highly competitive and one of the
important contributors in the Indian economy. In the mid - nineties, the growth of the sector
was very fast whereas it declined rapidly at the end of the decade. The initial growth was due
to increase in product penetration and consumption levels4. Riding on a rapidly growing
economy, increasing per-capita incomes, and rising trend of urbanization, the FMCG market
in India is expected to further expand to $100 billion by 2025.
FINDINGS & DISCUSSION
Indian FMCG sector has almost tripled in last decade, much faster than past decades. Even in
the meltdown years of FY 2008 and FY 2009 the FMCG industry witnessed sustained growth
rates of 14% and 11% respectively, this sector was relatively recession-proof12. This growth
in FMCG sector is due to increase in demand, developments in supply side and favorable
changes in Government Policy.
CONCLUSION
Today, Fast Moving consumers goods have become an integral part of human life. This sector
is recession proof and created huge employment opportunity in India, hence becoming one of
the key pillars of the Indian economy. FMCG companies should encase opportunities like
increasing consumer income, changing consumer life style, aspiring rural consumer, consistent
economic growth by utilizing its strengths. The competition from unorganized sector can be
overcome by increasing brand awareness and by reducing cost through sharing resources such
as distribution network. Favorable developments happening in demand side, supply side and
systematic drivers shows that this sector has very bright future.
Research Paper-04
Consumer Behavior towards selected FMCG (Fast Moving Consumer
Goods) in Delhi NCR.
Paper ID IJIFR/ V2/ E7/ 027
M. Shehbaz Qasim
Research Scholar || Department of Management
Shri Venkateshwara University Gajraula, Uttar Pradesh
Swati Agarwal
Director Research||Department of Education
Shri Venkateshwara University Gajraula, Uttar Pradesh
Abstract
The aim of this research work is to study the consumers’ attitude towards Non-Alcoholic
Beverages. The data for the study has been collected by performing face to- face interview with
the respondents with the help of questionnaire. This study collects data from 400 consumers
across Delhi NCR. This study is started with objectives of examining socio-economic
background of respondents, analyzing the factors influencing consumer preferences towards
selected FMCG products that is Non- Alcoholic Beverages, checking the level of satisfaction
of consumers and knowing expectation of the consumers. This study reveals that consumer
preferences are largely affected by age, sex, place, product, price, availability, psychological,
people and brand influences.
INTRODUCTION
FMCG industry, alternatively called as CPG (Consumer packaged goods) industry primarily
deals with the production, distribution and marketing of consumer-packaged goods. These are
products that have a quick turnover, and relatively low cost. Consumers generally put less
thought into the purchase of FMCG than they do for other products. Though the absolute profit
made on FMCG products is relatively small, they generally sell in large numbers and so the
cumulative profit on such products can be large. Some of the prime activities of FMCG industry
are selling, marketing, financing, purchasing, etc. The industry also engaged in operations,
supply chain, production and general management. The Indian FMCG sector is the fourth
largest sector in the economy with a total market size in excess of US$ 44 billion. It has a strong
MNC presence and is characterized by a well-established distribution network, intense
competition between the organized and unorganized segments and low operational cost.
Availability of key raw materials, cheaper labour costs and presence across the entire value
chain gives India competitive advantage. The Indian consumers today are unique in the sense
of being value sensitive and are not much price sensitive, as earlier. If they feel that a product
offers them more value, they will buy it even if the price is high. The Indian consumers also
follow strictly, their culture, tradition and values, as a result of which foreign companies are
forced to give an Indian touch to their products in order to succeed in India.
Objective of the study
I. To examine consumers‟ preference towards various non-alcoholic beverages.
II. To analyses motives of different age group for selection of non-alcoholic beverages.
Research Methodology
1: Research Design
This research is descriptive in nature as the study aims to find out the consumer behavior about
FMCG product. The study is carried out the naturalistic observation and survey questioning,
which are attributes of descriptive research.
2: Data Collection techniques
The sources of data are primary as well as secondary. Primary data are collected through a
survey of the consumers, using a well framed questionnaire. Information is also gathered
through secondary sources like books, journals, magazines, dailies, and from the internet. The
data collected from the two sources are scrutinized, analyzed, edited and tabulated.
3: Designing the Questionnaire
Questionnaire is designed by the researcher in such a way that there are several questions
designed based on scaling namely Likert Scales which have five scales like strongly agree,
agree, neutral, disagree, strongly disagree. This enables the respondent to answer the questions
in a structured manner by choosing one option among the five options. It provides a sense of
comfort by choosing the precise answers. Each construct has minimum five sub constructs
related to the key factor of the main construct.
4: Sampling Design
The sampling technique involved is Convenient Sampling. This study conducted in various
place in Delhi NCR city. Due to time constraint convenient sample was followed.
Interpretation
A buying decision can either be a planned one which is characterized by deliberate thoughtful
search and evaluation, that will result in rational and accurate decisions or it can be an impulse
purchase decision, which is spontaneous, unplanned and immediate. Sales promotional
strategies play a major role in stimulating more of unplanned purchases. Food selection is a
complex phenomenon. depending on a lot of factors, which affect human behaviour in different
ways, resulting in the sum, and rejection of other products (Wadolowskaet al., 2008). Factors
that affect food choices may be divided into three main groups: i)product-related factors, which
rely on chemical and physical properties, sensory attributes (taste, aroma, texture, visual
appearance), functional factors(packaging, accessibility, convenience), nutrient content etc.; ii)
consumer-related factors, including personality (age, gender, education level), psychological
factors (personality, experience, mood),physiological effects (satiety, hunger, appetite etc.);iii)
environmental-related, which include economic(price, incomes), Our result agrees with a study
in which it has been shown that about forty percent of those who rated the important health
aspects of dairy beverages consumption were more than 45 years of age, a fact that supports
the observation that consumers „health concerns increase with increasing age (Bech-L arsen
and Scholderer, 2007). while males in higher percentage consumed other beverages. Fig 7.3
shows consumers up to 15 yrs like cold drink most. This may be due to taste, cost, celebrity
and refreshment. Nutritious and juice drink accepted by all the groups equally. Health may be
the reason for the same. Milk is accepted by all the age group of consumers as it has the great
importance for human body growth. Social and psycho factor also work Dairy beverages
exhibit beneficial health effects due to the presence of bioactive component.
Research Paper no-05
A Case Study on Labeling Regulations of Pre-Packaged Food Product
(Biscuits)
Saista Anjum , Er.Chitra Sonkar, Er.Dorcus Masih
M.Tech. Food Laws & Policies, Department of Food Process Engineering, Sam HigginBottom
Institute of Agriculture,
Technology and Sciences- Deemed University
P.O-Naini, Allahabad, U.P-211007, India
Abstract
After a case study on labeling regulations in India it was observed that most of the companies
are aware of FSSAI regulation and are maintaining the Acid Insoluble Ash and Acidity of
Extracted Fat Level in their Products like Britannia has 0.026% and 0.73%, Sunfeast has
0.029% and 1.062%, Parle has 0.027% and 0.77% of acid insoluble ash and acidity of extracted
fat. From the survey it was shown that most of the customers are not aware of the mandatory
and voluntary labeling. For the awareness of consumers, the companies also provide some
voluntary details on their products like USFDA norms, HACCP certified, FSSAI license
number etc. This project is an investigation of the nutritional value of biscuits in the Indian
market as claimed on the packaging material and it is also a study on the effect of packaging
on consumer’s buying behavior. A questionnaire was set containing appropriate questions and
survey was made on 100 consumers belonging to different categories.
Introduction
In their broadest and most conventional application, food labelling policies have a dual
purpose: to protect consumers and to ensure fair marketing. To facilitate the development and
use of food labelling, more understanding of good labelling practices is needed among
governments, industry, civil society organizations and A color used on packaging greatly
impacts the perception of the consumer. Shoppers judge the product attributes by the color on
its packaging. (Delabyet al.,1999). Prepackaged food shall not be described or presented on
any label or in any labelling in a manner that is false, misleading or deceptive or is likely to
create an erroneous impression regarding its character in any respect; Prepackaged food shall
not be described or presented on any label or in any labelling by words, pictorial or other
devices which refer to or are suggestive either directly or indirectly, of any other product with
which such food might be confused, or in such a manner as to lead the purchaser or consumer
to suppose that the food relates to such other product. Even at the point of purchase it is
packaging that influences the buying decision and dominates a product over its competitors.
Packaging creates a positive perception on the consumers and can even result in brand
switching in case of children. (Louw et al., 2007). “Nutrition claim means any representation
which states, suggests or implies that a food has nutritional properties which are not limited to
the energy value but include protein, fat carbohydrates, vitamins and minerals”. Some of the
authorized nutrition claims are “free of fat/ saturated fat/cholesterol/sodium/salt/sugars and
calories”, “very Low in sodium”, “high or good source of calcium”, etc. (Food Safety and
Standards regulations, 2011).
The present study was undertaken with the objectives to investigate the claims regarding
nutritional composition of packed food products (Biscuits), to perform a survey on mandatory
and voluntary labeling on food productand.to study the effect of packaging requirements on
consumer’s behavior.
Brand of biscuits consumed by the people currently
Reported that consumption of Britannia Burborn was 85%, Dark fantasy 78%, Parle-G 75%
while Horlicks consumed 25% and 38% of Dream lite were consumed. So, it can be concluded
that maximum consumed biscuit was Britannia Burborn and minimum biscuit consumed was
Horlicks. Most of the consumers prefer Britannia Burborn, Dark fantasy, Parle – G as their first
preference than Horlicks, Dream lite because of their quality, price and taste.
Effect of parameters on consumer’s behavior
Results clearly indicates that there is a strong association of packaging as more than 70%
consumers stated that they believe on packaging to facilitate their decision-making process at
the POP (point of Purchase). (Wells et al., 2007). Brand of the food product plays the most
important role with 65% consumers admitting that this is the most important attribute. Taste
and price of the food product are other attributes in order of importance assigned by the. Net
quantity and Labelling regulation of such products are the least important reasons for buying
them. The reason for buying Biscuits is mostly for its Taste, Quality, Brand, Attractive
packaging and Offer while few of them prefer because of their cheap prices. Packaging also
plays an important role in influencing the buying behavior of the consumers as shown in fig
3.9. These finding are in accordance with the findings of Bone, 2001.
Conclusions
From the investigation study (survey), it can be concluded that most of the customers are not
aware about the mandatory and voluntary labeling. Inspite of that the company strictly follow
the mandatory rules of FSSAI and for the awareness of consumers they also provide some
voluntary details like USFDA norms, HACCP certified, FSSAI license no. Sunfeast, Britannia
and Parle is the most popular amongst its users, so to be on top of mind of the customers, the
company need to do something outstanding every time.
2.2 Identification of the Gap where no substantial work has been
done.
Traditionally the FMCG industry is an extremely competitive business. The diverse, broad and
hard-to-predict influencing factors in sales, marketing and supply chain make it an ever-
changing field. In this environment of constant change, FMCG executives not only have to
strategize for the present but also plan. Since the consumer base is huge and distributed across
various geographical locations, the competition from local players also impacts business. Also,
with the advent of digital media and increase in delivery channels, tapping the most spot-on
growth opportunities has become more complicated in an already complex system. To sum it
up in a few lines, the success of an FMCG company heavily relies on two crucial aspects speed
and accuracy.
Whether it is to run the right sales promotions or choosing the best marketing campaign or
picking the most cost-effective supply chain, the overall success depends on
1. The accuracy of decisions in each scenario.
2. How fast every decision is taken
However, when it comes it to accessing required information, FMCG companies typically
face these 4 major challenges:
1. Dependence on a standalone BI Tool/Application
Half knowledge is more dangerous than ignorance. Most FMCG firms depend on analytics or
a BI tool for obtaining insights and decision making. While the data obtained is still useful, the
data acquired doesn’t give a 360-degree view of each scenario.
For example, using the tool you might easily notice that there is a drop in soft drinks’ sales in
London. However, you may not conveniently spot the exact reason and problem source for this
drop. You again need to check numerous related hierarchy reports/spreadsheets (product, sales,
region etc.) to find the cause. In an industry where there are multitudinous influencing factors
and time is a crunch factor, the usage of such a singular tool leads to an inaccurate and time-
consuming decision making.
2. Customizable Reports
The one thing an FMCG executive can’t survive without – Reports. This is obvious and
understandable. Customarily for FMCG users, reports were the go-to visual formats for
accessing data. However, in most FMCG firms, report generation is a job of MIS or developer
teams. Whenever executives need new reports or updating of existing reports, they must
constantly hover around these teams. This tedious procedure wastes time and decreases the
work productivity of both groups.
3. Insights from limited data sources
Typically, FMCG companies use internal market research data, organizational historical data
or/and syndicated data from vendors like Nielsen, IRI, SPINS etc. These types of data are
important. We won’t deny that. But in an industry which possesses multifarious consumer
touch points, the sole dependence on syndicated data providers results in limited insights. There
will be an additional need to combine the internal sales, market research and finance data with
syndicated data to get the right insights. Also, combining this data with external data sources
like Social feeds from Twitter, Facebook, weather forecasts, events related data make these
insights far richer to study cause and effect.
4. Lack of forecasting and evaluation intelligence
As mentioned earlier, FMCG executives not only have to strategize for today but also plan for
tomorrow. They need to continuously factor in various market scenarios and forecast growth
for the future. An effective BI system should not just provide insight but also help users in
evaluating understanding the consequences of every decision.
For instance, if the CMO decides to increase the marketing budget by 30% in London, the BI
system should be able to analyze and forecast the effect on sales in that region.
or
If the brand manager wants to cut costs on dogs (as in the BCG matrix) and explore new
market/product segments, the BI system should be able to detect and recommend growth
opportunities
or
How will external factors like weather or events in the city going to impact sales – If it is going
to be colder than usual temperatures, certain products will be sold more and If there is a football
event there will be an increase in demand for certain beverages and snacks.
However, these elements are missing in several FMCG BI systems today and most executives
still depend on intuition-based strategies.
Conclusion
To wrap it up, speed and accuracy of decision-making are extremely critical for the success of
any FMCG business.
CHAPTER-03
Research Methodology
3.1 Data Source
 The present study is largely based on the primary data collected from rural and urban
consumers through field survey. Field survey was conducted by intensively
interviewing individuals of different families considering them as the representative of
the household. For this purpose, a structured questionnaire was administrated. .
 Preliminary study in order to evaluate feasibility, time, cost, adverse events and
statistical availability to predict an appropriate sample size and improve upon the study
design prior to the execution of a full-scale study.
 A pilot study is usually carried out on respondents from target population, but not on
those who constitute the final sample because it may influence the latter’s behavior over
research subjects.
 The pilot study introduced some changes in the hypotheses which were set previously;
some were changed, some were dropped, and some were developed newly. The
response set of 50 respondents had brought in new ideas and clues that increased the
chances of getting clearer findings in the main study. With no more ambiguities, the
study became more defined and paved the way to make much required alterations in
the data collecting methods in order to assist in analyzing the data more efficiently.
3.2 Method of Data Collection.
The survey approach has been chosen for the study to gather descriptive information; structured
survey with formal lists of direct questions was conducted among the respondents. Generally,
this approach is used to collect data for different kinds of studies. Moreover, this approach is
quick and carries low cost as compared to observation and experimental methods.
3.3 SAMPLE METHOD & SIZE
Multiple-stage sampling has been used for selecting the sample. In the research study,
probability systematic random sampling has been used for collecting the data; it is also called
an Nth name selection technique. This method is used because under this procedure each
element in the population has a known and equal probability of selection. Further, probability
random sampling has been used for giving equal probability to every unit. The size of the
sample is 100 and data has been taken for the further use.
3.4 Data Analysis techniques
I. Quantitative Data Analysis Methods
After collection of data by direct questionnaires (Google Forms) , the data is ready for analysis.
The two most commonly used quantitative data analysis methods are descriptive statistics and
inferential statistics.
A. Descriptive Statistics
Typically, descriptive statistics (also known as descriptive analysis) is the first level of analysis.
It helps researchers summarize the data and find patterns. A few commonly used descriptive
statistics are:
Mean: numerical average of a set of values.
Median: midpoint of a set of numerical values.
Mode: most common value among a set of values.
Percentage: used to express how a value or group of respondents within the data relates to a
larger group of respondents.
Frequency: the number of times a value is found.
Range: the highest and lowest value in a set of values.
 Descriptive statistics provide absolute numbers. However, they do not explain the
rationale or reasoning behind those numbers. Before applying descriptive statistics, it’s
important to think about which one is best suited for your research question and what
you want to show. For example, a percentage is a good way to show the gender
distribution of respondents.
 Descriptive statistics are most helpful when the research is limited to the sample and
does not need to be generalized to a larger population. For example, if you are
comparing the percentage of children vaccinated in two different villages, then
descriptive statistics is enough.
 Since descriptive analysis is mostly used for analyzing single variable, it is often called
univariate analysis.
B. Inferential Statistics
Often, researchers collect data on a sample of their population, then they generalize the results
to the entire population or target group. Inferential statistics are used to generalize results and
make predictions about a larger population.
These are complex analyses that show the relationship between several different variables,
rather than describing a single variable. They are used when the researcher needs to go beyond
absolute values and understand the relations between variables.
A few types of inferential analysis are:
Correlation: This describes the relationship between two variables. If a correlation is found,
it means that there is a relationship among the variables. For example, taller people tend to
have a higher weight. Hence, height and weight are correlated with each other. However, this
doesn’t necessarily mean that one variable causes the other (e.g. gaining weight doesn’t cause
people to grow taller).
Regression: This shows the relationship between two variables. For example, regression can
help us guess someone’s weight based on their height.
Analysis of variance: This is a statistical procedure used to test the degree to which two or
more groups vary or differ in an experiment. In most experiments, a great deal of variance
indicates that there was a significant finding from the research. For example, to understand the
relationship between the number of children in a family and the socio-economic status, a
researcher may recruit a sample of families from each socio-economic status and ask them
about their ideal number of children. Analysis of variance will be used to check if the difference
between the groups’ answers is statistically significant or due to random chance.
II. QUALITATIVE DATA ANALYSIS METHOD
Qualitative data analysis works a little differently from quantitative data, primarily because
qualitative data is made up of words, observations, images, and even symbols. Deriving
absolute meaning from such data is nearly impossible; hence, it is mostly used for exploratory
research. While in quantitative research there is a clear distinction between the data preparation
and data analysis stage, analysis for qualitative research often begins as soon as the data is
available.
Data Preparation and Basic Data Analysis
Analysis and preparation happen in parallel and include the following steps:
 Getting familiar with the data: Since most qualitative data is just words, the researcher
should start by reading the data several times to get familiar with it and start looking
for basic observations or patterns. This also includes transcribing the data.
 Revisiting research objectives: Here, the researcher revisits the research objective and
identifies the questions that can be answered through the collected data.
 Developing a framework: Also known as coding or indexing, here the researcher
identifies broad ideas, concepts, behaviors, or phrases and assigns codes to them. For
example, coding age, gender, socio-economic status, and even concepts such as the
positive or negative response to a question. Coding is helpful in structuring and labeling
the data.
 Identifying patterns and connections: Once the data is coded, the research can start
identifying themes, looking for the most common responses to questions, identifying
data or patterns that can answer research questions, and finding areas that can be
explored further.
Brief Description of the choice of techniques and justification of
their use.
i. I’ll start with a quick definition of them both. Quantitative research is the empirical
investigation of the research question using scientific methods. The results gathered are
numerical and can therefore be analyzed statistically to answer the hypothesis.
Qualitative research is done on a much more individual basis. It is the analysis of social
phenomena, and statistics are not used at all. Instead researchers will look at
biographies, interviews, case studies, and try to understand why people act as they do.
ii. I can see why some people insist that quantitative research is better than qualitative
research. One reason for this is that it is more scientific. A large amount of data is
gathered and then analyzed statistically. This allows for very little bias, and if 100
researchers ran the analysis on the data, they would always end up with the same
numbers at the end of it. The researcher also has more control over how the data is
gathered and is more distant from the experiment. However, in qualitative, the
researcher is often the person doing the interview or involved in some other way. This
does not allow them the outside perspective gained from doing quantitative research.
There is also more bias involved in qualitative research. This is because most of the
results come from the researcher’s interpretation of the data. This does not seem all that
accurate – two different people looking at the same interview could interpret in two
very different ways, depending on their mood, personality, upbringing, and a huge
number of other factors. Think about our seminar groups! Everyone had a different idea
about the friendship spoken about in the interview.
iii. Qualitative research is defined as a market research method that focuses on obtaining
data through open-ended and conversational communication.
iv. This method is not only about “what” people think but also “why” they think so. For
example, consider a convenience store looking to improve its patronage. A systematic
observation concludes that the number of men visiting this store are more. One good
method to determine why women were not visiting the store is to conduct an in-depth
interview of potential customers in the category.
v. On successfully interviewing female customers, visiting the nearby stores and malls,
and selecting them through random sampling, it was known that the store doesn’t have
enough items for women and so there were fewer women visiting the store, which was
understood only by personally interacting with them and understanding why they didn’t
visit the store, because there were more male products than female ones.
Therefore, the qualitative research methods allow for in-depth and further probing and
questioning of respondents based on their responses, where the interviewer/researcher also
tries to understand their motivation and feelings

Comparison of Consumer behavior towards “Parle” and “Britannia”

  • 1.
    Title of theProject: Comparisonof Consumer behavior towards “Parle” and “Britannia”.
  • 2.
    Contents 1.1 INTRODUCTION ...............................................................................................................3 1.2Overview of the Sector ........................................................................................................6 Overview................................................................................................................................6 1.3 Contribution to GDP ............................................................................................................8 1.4 Domestic Completion & Foreign Competition of FMCG Sector ........................................9 1.5 Government Policies/Regulations of FMCG Sector..........................................................10 1.6 FMCG trends in India ........................................................................................................12 1.7 Products, Customers & Processes. .....................................................................................13 1.8 Sectoral Growth in last 5 Years..........................................................................................15 1.9 Other relevant information.................................................................................................17 1.10 Introduction to the Company ...........................................................................................18 1.10.1 SWOT & PESTLE Analysis .........................................................................................20 SWOTAnalysis of Parle Brand ...............................................................................................20 PESTLE Analysis of Parle .......................................................................................................20 1.10.2 BCG MATRIX ..............................................................................................................26 1.11 Objective of the Study......................................................................................................27 2.1 LITERATURE REVIEW...................................................................................................28 2.2 Identification of the Gap where no substantial work has been done. ................................44 3.1 Data Source........................................................................................................................47 3.2 Method of Data Collection.................................................................................................47 3.3 SAMPLE METHOD & SIZE ............................................................................................48 3.4 Data Analysis techniques ...................................................................................................48
  • 3.
    List of Figures 1.Infographic reorientation of FMCG Sector ............................................ 5 2. Various FMCG Giants .......................................................................... 7 3. Growth FMCG sector in India-Infographic...........................................11 4. An Overview of FMCG products in a retail store................................. 14 5. Market Segmentation of FMCG.......................................................... 14 6. Process of FMCG sector..................................................................... 15 7. Growth from 2009-2016..................................................................... 17 8. Parle Products.................................................................................... 18 9. Britannia Products.............................................................................. 19 10. SWOT Analysis Parle......................................................................... 20 11. SWOT Analysis of Britannia............................................................... 23 12. BCG Matrix of Parle .................................................................... 26 13. BCG Matrix of Britannia .................................................................... 26
  • 4.
    CHAPTER-1 1.1 INTRODUCTION Fast-moving consumergoods (FMCG) sector is the 4th largest sector in the Indian economy with Household and Personal Care accounting for 50 per cent of FMCG sales in India. Growing awareness, easier access and changing lifestyles have been the key growth drivers for the sector. The urban segment (accounts for a revenue share of around 55 per cent) is the largest contributor to the overall revenue generated by the FMCG sector in India However, in the last few years, the FMCG market has grown at a faster pace in rural India compared with urban India. Semi-urban and rural segments are growing at a rapid pace and FMCG products account for 50 per cent of total rural spending. Market Size The Retail market in India is estimated to reach US$ 1.1 trillion by 2020 from US$ 840 billion in 2017, with modern trade expected to grow at 20 per cent - 25 per cent per annum, which is likely to boost revenues of FMCG companies. Revenues of FMCG sector reached Rs 3.4 lakh crore (US$ 52.75 billion) in FY18 and are estimated to reach US$ 103.7 billion in 2020. The sector witnessed growth of 16.5 per cent in value terms between July-September 2018; supported by moderate inflation, increase in private consumption and rural income. @ Investments/ Developments The government has allowed 100 per cent Foreign Direct Investment (FDI) in food processing and single-brand retail and 51 per cent in multi-brand retail. This would bolster employment and supply chains and provide high visibility for FMCG brands in organized retail markets, bolstering consumer spending and encouraging more product launches. The sector witnessed healthy FDI inflows of US$ 13.63 billion, during April 2000 to June 2018. Government Initiatives Some of the major initiatives taken by the government to promote the FMCG sector in India are as follows: The Government of India has approved 100 per cent Foreign Direct Investment (FDI) in the cash and carry segment and in single-brand retail along with 51 per cent FDI in multi-brand retail. The Government of India has drafted a new Consumer Protection Bill with special emphasis on setting up an extensive mechanism to ensure simple, speedy, accessible, affordable and timely delivery of justice to consumers.
  • 5.
    The Goods andServices Tax (GST) is beneficial for the FMCG industry as many of the FMCG products such as Soap, Toothpaste and Hair oil now come under 18 per cent tax bracket against the previous 23-24 per cent rate. The GST is expected to transform logistics in the FMCG sector into a modern and efficient model as all major corporations are remodeling their operations into larger logistics and warehousing. Achievements Following are the achievements of the government in the past four years:  Number of mega food parks ready increased from 2 between 2008-14 to 13 between 2014-18.  Preservation and processing capacity increased from 308,000 during 2008-14 to 1.41 million during 2014-18.  The number of food labs increased from 31 during 2008-14 to 42 during 2014-18.
  • 6.
  • 7.
    1.2 Overview ofthe Sector Fast Moving Consumer Goods (FMCG) goods are all consumable items (other than groceries/pulses) that one needs to buy at regular intervals. These are items which are used daily, and so have a quick rate of consumption, and a high return. FMCG can broadly be categorized into three segments which are: 1. Household items as soaps, detergents, household accessories, etc, 2. Personal care items as shampoos, toothpaste, shaving products, etc and finally 3. Food and Beverages as snacks, processed foods, tea, coffee, edible oils, soft drinks etc. Global leaders in the FMCG segment are Nestlé, ITC, Hindustan Unilever Limited, Reckitt Benckiser, Unilever, Procter & Gamble, Coca-Cola, Carlsberg, Kleenex, General Mills, Pepsi, Gillette etc. Overview The burgeoning middle-class Indian population, as well as the rural sector, present a huge potential for this sector. The FMCG sector in India is at present, the fourth largest sector with a total market size in excess of USD 13 billion as of 2012. This sector is expected to grow to a USD 33 billion industry by 2015 and to a whooping USD 100 billion by the year 2025. This sector is characterized by strong MNC presence and a well-established distribution network. In India the easy availability of raw materials as well as cheap labour makes it an ideal destination for this sector. There is also intense competition between the organised and unorganised segments and the fight to keep operational costs low. A look at some factors that will drive growth in this sector:  Increasing rate of urbanization, expected to see major growth in coming years.  Rise in disposable incomes, resulting in premium brands having faster growth and deeper penetration.  Innovative and stronger channels of distribution to the rural segment, leading to deeper penetration into this segment.
  • 8.
     Increase inrural non-agricultural income and benefits from government welfare programmes.  Investment in stock markets of FMCG companies, which are expected to grow constantly. (Various FMCG Giants)
  • 9.
    1.3 Contribution toGDP Fast moving consumer goods (FMCG) are the 4th largest sector in the Indian economy. There are three main segments in the sector – food and beverages which accounts for 19 per cent of the sector, healthcare which accounts for 31 per cent and household and personal care which accounts for the remaining 50 per cent. The FMCG sector has grown from US$ 31.6 billion in 2011 to US$ 52.75 billion in 2017-18. The sector is further expected to grow at a Compound Annual Growth Rate (CAGR) of 27.86 per cent to reach US$ 103.7 billion by 2020. The sector witnessed growth of 16.5 per cent in value terms between June–September 2018; supported by moderate inflation, increase in private consumption and rural income. It is forecasted to grow at 12-13 per cent between September– December 2018.^ FMCG’s urban segment is expected to have a steady revenue growth at 8 per cent in FY19 and the rural segment is forecasted to contribute 15-16 per cent of total income in FY19.* Post GST and demonetization, modern trade share grew to 10 per cent of the overall FMCG revenue, as of August 2018. Accounting for a revenue share of around 45 per cent, rural segment is a large contributor to the overall revenue generated by the FMCG sector in India. Demand for quality goods and services have been going up in rural areas of India, on the back of improved distribution channels of manufacturing and FMCG companies. Urban segment accounted for a revenue share of 55 per cent in the overall revenues recorded by FMCG sector in India. FMCG Companies are looking to invest in energy efficient plants to benefit the society and lower costs in the long term. Patanjali will spend US$ 743.72 million in various food parks in Maharashtra, Madhya Pradesh, Assam, Andhra Pradesh and Uttar Pradesh. Dabur is planning to invest Rs 250-300 crore (US$ 38.79-46.55 million) in FY19 for capacity expansion and is also looking for acquisitions in the domestic market. Investment intentions, related to FMCG sector, arising from paper pulp, sugar, fermentation, food processing, vegetable oils and Vanaspati, soaps, cosmetics and toiletries industries, worth Rs 165.52 billion (US$ 2.36 billion) were implemented between January–September 2018. Growing awareness, easier access, and changing lifestyles are the key growth drivers for the consumer market. The focus on agriculture, MSMEs, education, healthcare, infrastructure and employment under the Union Budget 2018-19 is expected to directly impact the FMCG sector. These initiatives are expected to increase the disposable income in the hands of the common people, especially in the rural area, which will be beneficial for the sector.
  • 10.
    1.4 Domestic Completion& Foreign Competition of FMCG Sector Domestic Competition India's huge population has always been a significant factor for the growth of FMCG sector in the country. Between 1950 and 1980, the consumption of FMCG products were relatively low due to the low per capita income. The post-liberalization era in India has witnessed a massive growth in the selling of products in the domestic market. The Indian market also imported loads of products from overseas markets which made increased the competition between the organized and the unorganized sector. The easing of the trade barriers encouraged the MNCs to invest in the Indian market to cater to the needs of the consumers. The living standards rose in the urban sector due to high disposable income along with the rise in the purchasing power of the rural families which increased the sales volume of various manufacturers of the FMCG products in India. The large-scale companies such as HUL, Godrej Consumer, Marico, Henkel, Reckitt Benckiser and Colgate have targeted the rural consumers and have also expanded their retail chain in the mid-sized towns and villages. On the contrary to this, Nestle has always targeted the market of urban India and focuses largely upon the value added products for the elite class or upper middle class population. Consumer goods MNCs from Nestle NSE 0.06 % and Hindustan Unilever NSE 0.16 % to Coca-Cola and PepsiCo are pushing localization to the last mile to counter regional competition, fight back the onslaught of local brands, and expand penetration and reach in a market that is showing green shoots of consumption revival. “There are many India’s in India. Each of them needs to be served differently,” Nestle India chairman Suresh Narayanan said. The maker of Maggi noodles and Nescafe said it needs to expand beyond the top 100 towns to ensure sustainable growth for the future and is exploring regional variants of existing brands across its portfolio, for example, for ketchup, coffee and confectionery. “Evolving a structure to divide the markets into 10-15 clusters. And, segmenting product variants, distribution, sales, marketing and communication in relevant geographies should ensure better penetration in existing markets and help expand in adjacent markets,” Narayanan said. Foreign Competition
  • 11.
    The largest marketfor the consumer goods industry is the US, followed by China. India, Indonesia, Brazil, Mexico, and other developing countries are expected to be the new growth engines for the sector. In 2014, the global FMCG sector was worth $8 trillion, which is nearly the GDP of Japan and Germany combined (India’s GDP is $2.05 trillion). The top ten global FMCG companies, based on net sales in 2014, are Nestlé ($100 billion), Proctor and Gamble ($83 billion), PepsiCo ($66.6 billion), Unilever ($66.1 billion), JBS ($49 billion), AB Inbev ($ 47 billion), Coco- Cola Company ($45 billion), Tyson Foods ($37 billion), Mondelēz ($34 billion), and Archer Daniel Midlands ($31 billion). The ten most purchased brands globally are Coca-Cola (Coca-Cola Company), Colgate (Colgate-Palmolive), Maggi (Nestlé), Lifebuoy (Unilever), Nescafé (Nestlé), Pepsi (PepsiCo), Lay’s (PepsiCo), Knorr (Unilever), Dove (Unilever), and Tide (P&G), according to online sources. The global consumer durables goods industry, on the other hand, was estimated to be worth $13 trillion in 2013. 1.5 Government Policies/Regulations of FMCG Sector  The government is working towards bringing retail, FMCG and e-commerce within a single policy framework, which will address all the concerns of industry and consumers, NITI Aayog CEO Amitabh Kant has said. Kant heads a high-level committee that will review commerce rules including the FDI norms for the sector.  Speaking at FICCI’s annual retail, FMCG and ecommerce convention Kant said, "To provide a level playing field to stakeholders, there is a move in the government to harmonies these varied policies." Kant said that while domestic entrepreneurs are being encouraged in the country, foreign players will boost healthy competition in the sector.  The domestic market would be challenged by the foreign businesses, which would enable indigenous companies to scale up, enhance quality of products and services and penetrate global markets. As per current policy government allows 100 per cent FDI under approval route and any foreign investment beyond 51 per cent, it is required that 30 per cent of the value of goods be sourced from India.  Single brand license holders can also sell through ecommerce platform under automatic. The rules for ecommerce which were notified in March this year classify
  • 12.
    such companies asB2B operating under marketplace model where 100 per cent FDI is allowed.  India does not allow FDI in B2C retail. The 12-member committee being chaired by Kant is also looking at liberalizing the ecommerce policy with hope to further boost the sector. The committee must give its recommendation to the Prime Minister’s office in the next two months.  The NITI Aayog CEO also said that India has become the top FDI destination in the world and this has given the country access to latest technology, global best practices and innovations. Kant said technology will play a crucial role in the growth of retail sector. "With a growing penetration of the internet which reaches rural areas of the country, the retailers would be able to deepen their market." Growth of FMCG Industry in India - Infographic (Growth FMCG sector in India-Infographic)
  • 13.
    1.6 FMCG trendsin India Fast moving consumer goods (FMCG) are the products that are consumed in short span of time and are consumed daily. Examples are packed food items, soft drinks, soaps, toiletries etc. The FMCG industry can be broadly divided into 3 segments:  Household care: fabric wash and household cleaners  Personal Care: oral care, health care, skin care, cosmetics, hygiene and paper products  Food and Beverages: bakery, chocolates, snacks, tea/coffee, dairy products etc The FMCG industry is the fourth sector is the fourth largest constituent of Indian economy and has a market size of about 130,000 crores. In the early nineties, FMCG marketers figured out two things:  Rural markets are price-sensitive  Rural markets are important since the urban markets are getting saturated. This led to several companies in following strategies for launching package sizes and prices to suit the purchasing sizes of the Indian consumer markets. This led to the introduction of small sachets in all segments from oil, shampoo to beverages. Sachets led to the concept of trial consumption. FMCG growth is a function  Create brand and product awareness  Increasing consumer demand  Growth of modern trade  Launching new products  Availability of online channel to shop  Rise incomes led to purchases  Desire to experiments with brands  Evolving consumer lifestyles 
  • 14.
    Main characteristics ofFMCG: From the consumers’ perspective:  Frequent purchase  Low involvement and price  From the marketers’ angle:  High volume  Low contribution margins  High stock turnover  Extensive distribution networks 1.7 Products, Customers & Processes. Products: Fast-moving consumer goods, commonly abbreviated FMCG, are non-durable goods that sell quickly. It is considered a unique business model that requires competitive advantages in areas such as manufacturing, branding, advertising and logistics. The following are examples of FMCG product types.  Processed Foods: Processed foods such as breakfast cereal.  Beverages: Packaged beverages such as fruit juice and bottled water.  Dry Goods: Dry goods include things such as coffee, tea, sugar and beans.  Prepared Meals: Prepared ready to foods such as bento boxes.  Cosmetics: Cosmetics such as hairstyling products.  Toiletries: Toiletries such as toothpaste.  Over-the-counter Medications: Basic medications that are available without a prescription.  Candy: Candy such as chocolate bars.  Fresh Food: Fresh food such as fruits and vegetables that are perishable.  Frozen Food: Frozen items such as ice cream that require a temperature-controlled supply chain.  Baked Goods: Baked goods such as cookies.  Consumer Electronics: Although consumer electronics are typically durable, fast selling ideas such as memory cards or headphones may be considered FMCG.
  • 15.
     Office Supplies:Consumable office supplies such as pens and paper.  Cleaning Products: Cleaning products such as baking soda. (An Overview of FMCG products in a retail store) Customers of FMCG (Market Segmentation of FMCG) Processes:
  • 16.
    (Process of FMCGsector) 1.8 Sectoral Growth in last 5 Years Some of the major initiatives taken by the government to promote the FMCG sector in India are as follows: The Government of India has approved 100 per cent Foreign Direct Investment (FDI) in the cash and carry segment and in single-brand retail along with 51 per cent FDI in multi-brand retail. The Government of India has drafted a new Consumer Protection Bill with special emphasis on setting up an extensive mechanism to ensure simple, speedy, accessible, affordable and timely delivery of justice to consumers. The Goods and Services Tax (GST) is beneficial for the FMCG industry as many of the FMCG products such as Soap, Toothpaste and Hair oil now come under 18 per cent tax bracket against the previous 23-24 per cent rate.
  • 17.
    The GST isexpected to transform logistics in the FMCG sector into a modern and efficient model as all major corporations are remodeling their operations into larger logistics and warehousing. Achievements Following are the achievements of the government in the past five years:  Number of mega food parks ready increased from 2 between 2008-14 to 13 between 2013-18.  Preservation and processing capacity increased from 308,000 during 2008-14 to 1.41 million during 2013-18.  The number of food labs increased from 31 during 2008-14 to 42 during 2014-18.  Rural consumption has increased, led by a combination of increasing incomes and higher aspiration levels; there is an increased demand for branded products in rural India. The rural FMCG market in India is expected to grow to US$ 220 billion by 2025 from US$ 23.6 billion in FY18. In FY18, FMCG’s rural segment contributed an estimated 10 per cent of the total income and it is forecasted to contribute 15-16 per cent in FY 19. ^ FMCG sector is forecasted to grow at 12-13 per cent between September–December 2018. @  On the other hand, with the share of unorganized market in the FMCG sector falling, the organized sector growth is expected to rise with increased level of brand consciousness, also augmented by the growth in modern retail.
  • 18.
    1.9 Other relevantinformation (Growth from 2009-2016)
  • 19.
    1.10 Introduction tothe Company Parle Parle Products was established as a confectionery maker in the Vile Parle suburb of Jaliawala Bagh, in 1929. It began manufacturing biscuits in 1939. In 1947, when India became independent, the company launched an ad campaign, showcasing its Gluco brand of biscuits as an Indian alternative to British-branded biscuits. Parle-G biscuits were earlier called 'Parle lelo' Biscuits until the 1980s. The "G" in the name Parle-G originally stood for "Glucose", though a later brand slogan also stated, "G for Genius”. In 2013, Parle- G became India's first FMCG brand to cross the ₹ 5,000 crore mark in retail sales. Parle Products (Parle products)
  • 20.
    Britannia Britannia Industries Limitedis an Indian food-products corporation headquartered in Kolkata, West Bengal. It sells its Britannia and Tiger brands of biscuits, breads and dairy products throughout India and in more than 60 countries across the globe. Britannia has an estimated market share of 38%. The biscuits were manufactured in a small house in central Kolkata. Later, the enterprise was acquired by the Gupta brothers mainly Nalin Chandra Gupta, an attorney, and operated under V.K Brothers." In 1918, C.H. Holmes, an English businessman in Kolkata, was taken on as a partner and The Britannia Biscuit Company Limited (BBCo) was launched. The Mumbai factory was set up in 1924 and Peek Freans UK, acquired a controlling interest in BBCo. Biscuits were in high demand during World War II, which gave a boost to the company’s sales. The company name was changed to the current "Britannia Industries Limited" in 1979. Britannia Products (Britannia Products)
  • 21.
    1.10.1SWOT & PESTLEAnalysis SWOT Analysis of Parle Brand (SWOT Analysis Parle) PESTLE Analysis of Parle PESTLE analysis is a tool to understand the environment in which business operates, & the opportunities & threats that lie within it. By understanding the environment in which it operates, it can take advantage of the opportunities & minimizing the threats. Specifically, PESTEL analysis is useful tool for understanding risks associated with markets growth or decline & directing business to group.  P- Political factors  E-Economic factors  S-Socio-cultural factors  T-Technological factors  E-Environment factors  L-Legal factors
  • 22.
    PESTEL ANALYSIS ONPARLE INDUSTRY: - POLITICAL FACTORS- Political stability: Political stability is one of the important most factor which influence the growth of business directly. If Political stability is higher, then it leads to perfection in business &onthe other hand if there is instability the business will have to suffer. Taxation policy: Tax policy of government will affect the price of inputs & it ultimately affect the prices of final products & it will directly affect the sale of product. The subsidies which are provided by government to different organization at different level also help it to grow at faster rate & helps the organization in reducing the finance. Trading policies: This indicates the policies related to import & export of goods and services from different nations. If the policies are favorable more goods & services will be imported& exported, &onthe other hand if policies areunfavorable it will restrict the import &export. Labor law: Labor law also affect the organization, for example- child labor, a child below14 year of age cannot work in factory or any hazardous place. ECONOMIC FACTORS Interest rates: Interest rate directly affect the cost of capital, if the interest rate is higher the cost of capital will increase & if it is lower than cost of capital will be lower. This directly affect the profit of the organization & it’s growth. Tax charges: If the tax charged by the government is lower than it will reduce the product price & if it is higher than it will increase the prices of the products. Exchange rates: This shows that what is the exchange rate or foreign currency rate. If exchange rate is higher more amount is paid onimport of goods &if it lowers less amount is tobepaid &onthe other hand if it is higher the amount received will bemore &if it is lower the amount received will below. National income: National income is important factor as if affect the growth of the organization. If percapita income is more the amount spend will bemore & if it will belower the amount spent will beless. Economic growth: Economic growth is important factor in the development of the organization. Ifeconomy grows at ahigher speedit will directly affect the growth of the organization. Inflation rate: Inflation means the rise in the value of all the product in the economy, if inflation rate is higher the cost ofproducts will behigher & if inflation rate is lower the cost of product will be lower. This directly affect the growth of the organization.
  • 23.
    SOCIOCULTURAL FACTORS Demographics: Demographicsis the study of human population in the economy. It helps the organization to divide the markets in different segments to target a large of customers. For Example- according to race, age, gender, family, religion, & sex. Distribution of income: This shows that how income is distributed in the economy. It directly affects the purchasing power of the buyers. And ultimately leads to increase ordecrease in the consumption level of the products. Changes in life style: Change in life style also leads to increase or decrease in the demand for different commodities. For example-presently LCD & LED TV’s have replaced Digital displayed TV set, this shows that the changes in life style of consumers. Consumerism: This indicates that many options are available while purchasing of goods to consumers, so the choice becomes easy & quality products can be choose by consumers. So, while purchasing a consumer have different choices to select product according to his needs. Education levels: Education is one of the most important factors which influence the buying power of consumer, while selecting agood a consumer should know all its features so it can differentiate them with another products. Law affect social behavior: Different laws are made by the government to safe guard the rights of consumers. For example- Consumer protection act, this law indicates that a consumer can file a case against aseller if he finds that he is cheated. TECHNOLOGICAL FACTORS Advancement in technology: New technology helps in economizing the scale of production, this means that new technology helps in increasing the level ofproduction, &reducing the costs of inputs, & maximizing the level of profits. Discoveries & innovation: Advancement in technology will leads to discoveries &innovations & further improvements in technology to improve perfections in the production process. Competitive forces: Advancement in technology will also leads to competition in the markets, more quality products will beprovided to consumers to cover many markets. Automation: Change in technology will leads to automation, this means that with new technology labor required is less as machines are automatic. All the works are done automatically by the machines as earlier it is labor oriented. Nowall the work is machine oriented. Obsolete rate: Day-by-day new inventions are made so the rate of obsolete is higher, as in Computer LAPTOPS have replaced the PC. This shows that the technology becomes obsolete very fast. Research & development: This department plays a vital role in the development of the
  • 24.
    organization. As thisdepartment always do research that what are the demand of the markets & how to make advancements so the organization can survive in the competitive world. ENVIRONMENTAL FACTORS Ecological: The ecological and environment aspects such as weather, climate, & climate changes, which may especially affect industry such as tourism, farming, & insurance. In FMCG Air conditioners demand increase in summer season. Environmentalissues:Global warming is one of the major issues now-a-days as external factor is becoming a significant issue for firms to consider. Many remedies have been taken to reduce Global warming. Environmentalregulations:Various regulations have beendeclared bygovernment tosafeguard the environment. For example-no company should through its waste in rivers. LEGAL FACTORS Employment law:Employment law provides equal opportunities to every citizen towork &earn his livelihood. It provides equal opportunities toevery citizen. Consumer protection: This law helps to protect the rights of consumers & he can file a case against seller if he fined that he is cheated. Industry-specific regulations: These laws are related to industry for example- no industry can establish in between cities i.e. it should be outside the cities. SWOT Analysis of Britannia (SWOT Analysis of Britannia)
  • 25.
    PESTLE Analysis ofBritannia Political: Exemption on Customs Duty on Sugar Raw Material Import: Due to the shortage in the production of sugar the deadline for the exemption on customs duty on raw sugar imports has been extended. Exemption on customs duty will help in purchasing sugar at lower cost, which in turn will control the cost of production. VAT on Biscuits: The VAT of 12.5% on Biscuits. Price of the biscuits might need to be increased due to the high VAT rates which may result in switch of brands due to the highly competitive market. Economical Shortage of Milk: Even though the milk production has risen by 4.6% compound annual average growth rate, it still cannot match up with the increasing demand. Price of milk increased by 12.6% to 13.6%. This can cause an increase in the input cost for the dairy products and which in turn can lead to hike in price or lower profit margins. Globalization: Globalization a universal phenomenon is affecting each industry. This can serve as an opportunity to expand the business to a global level but on the other hand there is a threat of new entrants from international market. Requirements for Logistics: Logistics in India suffer due to the poor infrastructure and other limitations. Sophisticated third-party logistics system will help in proper supply chain management and on time delivery of goods, which help in maintaining the shelf life of goods on meeting the demand on time. Social: Need for Healthy Eating Habits: Studies say that Indians are more prone to Coronary Artery Disease (CAD), which is the major independent risk factor causing Cardiovascular diseases, due to the smaller calibre arteries found in Indians. This suggests that Indians should move towards more healthy food and diet. This could be a new area to explore for Britannia with its new health associated products like Nauti-Choice biscuits and ACTi mind flavoured milk. Problems with Cloned Livestock: Cloned animals are supposed to be suffering from large- offspring syndrome. The mother cows face a problem in giving birth to the cloned animals as
  • 26.
    they are largerthan normal. Also, these cloned animals suffer from health which might make unsafe to consume the produce from them. Technological: Cloningof Livestock:India, a late entrant in cloning research, is now moving with a great pace in cloning technology. ‘Hand guided cloning technique’, a technique very different from the conservative cloning practice has been a successful venture. New Age Packaging: The new packaging systems help in protecting food from micro- organisms by creating shelter layer. It uses new technologies like oxygen scavenging function, atmosphere control, bio-degrability etc. and is low cost. Environmental: Change in theClimaticConditions:Climate plays an important role in the agriculture process. The change in the rainfall pattern has been a matter of concern now in India. The agriculture sector in areas which are monsoon dependent suffered badly due to the change in the rainfall pattern. The sector suffered a huge loss in terms of total output. The loss in crop will affect the input supply and this might delay or cause problems in the production. So, the industry might not be able to meet the demands resulting in the loss of customers. Legal: Raising the Norms for the Probiotic Food: There is a need for setting the standards for probiotic food. Clinical tests should be conducted on the probiotic foods before they could reach the market for sale. The Indian Council of Medical and Research has submitted the proposal for the same to the government. Strict norms will help in raising the quality standards but on the other hand the cost and time of production might subsequently increase.
  • 27.
    1.10.2 BCG MATRIX BCGMatrix of Parle BCG Matrix of Britannia (BCG Matrix of Britannia)
  • 28.
    1.11 Objective ofthe Study 1. To Study in Detail Likes and Dislikes of the Consumers. 2. To Know the Market Competition. 3. Identify the consumer response to the company’s product. 4. Know the consumers’ needs and expectations. 5. Seek maximum information about the consumer, i.e. the know consumers’ income range, their location, buying behavior, etc. 6. Know the nature and extent of competition and the strength and weaknesses of the competitors. 7. Evaluate the reputation of the company in the market. 8. Search for new marketing opportunities. 9. Find out alternative uses of the existing products. 10. Estimate the cost of marketing of goods and service.
  • 29.
    CHAPTER-2 2.1 LITERATURE REVIEW ResearchPaper-1 1.A Study on ConsumerAttitude and Satisfactionin Parle-G Biscuits at Madurai. By K. Vidhya, Research Scholar, Department of Business Administration, Kalasalingam University, Tamilnadu, India. This paper gives itemized data about the development of FMCG industry in India. It looks at the developing mindfulness and customer attitude and awareness among Parle-G Biscuits in Madurai branch and how the urban and semi-urban retail markets are seeing critical development Fast Moving Consumer Goods (FMCG) Industry, on the other hand called as CPG (Consumer Packaged Goods) industry principally manages the creation, appropriation and advertising of shopper bundled merchandise. FMCG industry is additionally expanding, particularly in India, where FMCG industry is viewed as the fourth biggest area with aggregate market size of US$13.1 billion. Parle-G is one of the FMCG items. Parle-G is the biggest offering scone on the planet. The main success of Parle-G is they have very strong distribution channel and they also reach the rural areas. The dealers will take them to their areas and from them sub-dealers will get the goods and at last it will be distributed to retailers and other stores. The researcher used statistics tools of percentage analysis and ANOVO and give some suggestions. Introduction: The organization's trademark is G implies Genius. The name, "Parle-G", is gotten from the name of the rural rail station, Vile Parle which thus depends on town Parle in long time past days (there is additionally range called Irle close-by where the Parle Agro creation industrial facility is based). his prevalent roll is principally eaten as a break time nibble. Parle-G is the biggest offering bread on the planet. It has a 70% piece of the pie in India in the glucose bread classification taken after by Britannia, Tiger (17-18%) and ITC's Sunfeast (8-9%). The brand is evaluated to be worth over Rs 2,000 crore (Rs 20 billion) and contributes more than 50 for each penny of the organization's turnover (Parle Products is an unlisted organization and its
  • 30.
    administrators are notopen to revealing definite numbers). Last monetary, Parle had offers of Rs 3,500 crore (Rs 35 billion). It likewise is well known over the world and is beginning to offer in Western Europe and USA. Parle products Biscuits • Parle-G • Hide and Seek • Krackjack • Hide and Seek Milano • Monaco • Parle Marie Review of the Literature Frank Alpert, School of Marketing, Griffith University, Australia and Michael Kamins, Marshall School of Business, University of Southern California gave a supposition on Retail purchaser convictions, state of mind and conduct toward pioneer marks as under; One potential wellspring of pioneer brand preferred standpoint is retail purchasers' inclination for pioneer brands. A model of pioneer brand advantage with retailers created in the USA was tried in Japan, as a replication and diverse expansion. This gives the primary experimental investigation of Japanese retail purchaser convictions, mentality, and conduct toward new offerings, and the main direct measurable examination of US and Japanese retail purchasing conduct in the promoting writing. A comparative study of Syeedun nisa and jamia hamdard gives a opinion on FDI in Indian Retail Industry and suggest that: Recently organized retailing has become more popular in big cities in India and most of the metropolitan cities and other big cities are flooded by modern organized retail stores. Many semi-urban areas also witness entry of such organized retail outlets. Hongliu and Peter j.MC Goldrick gives a opinion on international retail sourcing and furnished the following suggestions; In spite of significant research on worldwide sourcing by producers and the quick improvement of global sourcing channels by retailers, both reasonable and experimental reviews on universal retail sourcing have been few and far between. They analyze
  • 31.
    the ebb andflow patterns of global retail sourcing and draws qualifications between universal sourcing by makers and worldwide sourcing by retailers. Drawing upon the orders of business strategy, economics, and authoritative conduct, they build up a structure for global retail sourcing that connections the unique circumstance, universal sourcing technique, and execution. Paul TM buru and koketso paules undertake a study on consumer behavior on food retailing and furnished the following: A study should be carried out to get the retailers perspective with regards to in store foods and how they counter act the negative perceptions of the in-store foods. It would be desirable to contrast the results in other reprehensive geographical areas in Botswana. Objectives of the Study • To reveal the profile of the respondents(retailers) • To understand the retailers’ attitude towards parle-G Biscuits • To know the retailers’ satisfaction towards parle-G Biscuits • To know the customer awareness of parle-G Biscuits through retailers Scope of the Study This study explores Retailers profile and Retailers attitude towards Parle-G in Madurai. It also brings customer awareness & current market situation. The findings of the study have significant implications for the company to provide quality services to Retailers and as well as to the customers. Limitations of the Study • The Study is carried out in Madurai City Only. So, the result of the study cannot be generalized. • The period of study was short, and the data relevance would confine to this period only. • The study of Retailers attitude is a qualitative one, which gives room for interviewer and respondents bias. Suggestions The company should introduce new variety of biscuits in different quantities of packs for keeping the market position and for stable sales volume. The sales persons must be visited the shops more than 3 times/week and, they collect the feedbacks from the retailers. The company
  • 32.
    should introduce newadvertisements like Shakthi man advertisements to increase sales volume. Conclusion All the retailers are dissatisfied on the sales of the Parle biscuits. They also has good opinion about Parle biscuits but profit margin is insufficient. The retailer’s attitude about Parle-G biscuits is fair. Research Paper-02 CUSTOMERS PREFERENCE AND ATTITUDE TOWARDS BRITANNIA PRODUCTS –A STUDY WITH SPECIAL REFERENCE TO THENI DISTRICT – TAMILNADU. Dr. V. Kannan, M.Com,M.Phil.,Ph.D.,SET., Head, PG Department of Commerce, Theni Kammavar Sangam College of Arts and Science, Koduvilarpatti, Theni, India ABSTRACT Britannia products are liked by all individuals irrespective of age and sex. So from childhood to retirement age everyone is used to take Britannia biscuits as a delicious food during morning and evening for tea breaks. Hence the Britannia products are moving fast in the market as all the people consumes variety of biscuits, bread, rusk, cakes and dairy products. Now a days Britannia has established its own market in major parts of the country. The retailers are the main intermediaries who frequently meet the ultimate consumer of the Britannia product. They now show the consumer preference and attitude towards products having different brands. Once they lose the existing customer, they could not get them back. Further, they could not get potential customers. Hence it is inevitable to have a thorough study on customer preference and attitude towards Britannia product in Theni district. The study also reveals the reason for buying the Britannia products. Random sampling and convenience sampling are used for the study. The techniques that are used for data collection is questionnaire. The study covered 300 respondents belonging to Theni district. Tools and techniques used are simple percentage, Chi Square test, Garret ranking techniques and Factor analysis. The study shown that the majority
  • 33.
    of consumed Britanniaproduct and the entire respondents are aware of Britannia products. Various factors are analyzed for buying Britannia product. INTRODUCTION: The word biscuits have a Latin origin and is derived from two words, ‟biscuit‟ meaning twice and „coctus‟ meaning to cook. This referred to the earliest process of making biscuits where first they were baked and then dried. India’s biscuits industry came into major existence and started gaining a sound status in the bakery industry in the later part of the 20th century when the urbanized society called readymade food products at a tenable cost. Indian biscuits industry seems to be largest among all the food industries and has a turnover of around Rs.3000 crores. Britannia Industries Limited is an India food products corporation based in Kolkata, West Bengal in India. It is famous for its Britannia and tiger brands of biscuits. Which are popular thought the country. Britannia has an estimated 38% market share. The company’s principal activity is manufacture and sales of biscuits, bread, rusk, cakes, and dairy product1. In olden days, Britannia was considered as almost the monopolistic company in confectionary items, but at present there are number of competitors in the market. The Britannia Company has established its own market in major parts of the country. STATEMENT OF THE PROBLEM: Biscuits are small flat cake that is crisp and usually sweet. It is concerned with the taste and habits of the people. Previously, it was used as a diet for patients and energy and taste for kids. Nowadays, biscuits are considered as a good alternative for oily snacks and fast food. So currently, among all biscuits available in the market, Britannia has become one of the popular biscuits among the people of all segments and ages. In business world, many brands of products are produced and marketed by a single manufacture. The decision whether to buy or not depends only based on consumer motives. Modern market is consumer oriented and now the consumer is the decisive force. Hence, it is inevitable to have a thorough study on customers‟ attitudes and preference towards Britannia products and the research world reveals the result about satisfaction level and consumer preference towards Britannia products under study area. REVIEW OF LITERATURE:
  • 34.
    K. M. MubarakAli (1993) in his study endeavoured “to find out the purchasing pattern brand preference, brand loyalty and suggest and suitable measures to improve the brand loyalty. The study was concluded that a carefully chosen promotion strategy is to be used to increase the brand loyalty of the product. The purchases of consumer durables are influenced by personal opinions. Well brand sales force may be used to persuade the prospective customers2. Renuka and Hireken chanagoudar (2008) in them on a “study on consumer buying behaviour of ready-to-eat food products”. To determine the market penetration of Britannia Marie biscuits by retailers. The data were collected from 150 respondents. The tools used in are simple percentage and correlation co efficient. It is concluded that the main factors influencing brand preference for biscuits, chips, fruit juice and ice creams were quality, taste and reasonable price. Thus, the study revealed that the younger generation preferred more ready-to-eat food products than the other age groups. The consumer behaviour also varies from product to product3. F. Mohamed Sabura, and Dr. T. Vijayakumar (2009) made a” study on retailer attitude towards Britannia biscuits with special reference to rural areas of Coimbatore city”. To analyse the customer satisfaction about Britannia biscuits. the total sample respondents were fixed at judgment randam basis. The data was collected from 250 respondents in Coimbatore city. Different statistical tools are for used by analysis of the collected data, such as tabulation, percentage analysis, bar diagram, ANOVA and Karl Pearson‟s co efficient of correlation. The conclusion draws from the retailer‟s point and that, the distribution system of Britannia biscuits needs improvement through the direct selling method to satisfy the customer. Mr. S.D. Nidhyananth, and Mr. B. Vigneshwaran (2011) in made a “study on customer satisfaction towards Britannia biscuits in Coimbatore city”. To find out the factors those influence the purchase of Britannia biscuits. The data are collected directly from the sample by interviewing or mailing questionnaires at particular period of time. In this study the sample size was 100 respondents. Tools used in this study are percentage analysis, chi square test. It is concluded that consumer’s satisfaction with preferable taste, awareness about various brands, about choice and their frequency of preference satisfaction of Britannia biscuits 5. Suresh Garg (2010) carried out a study entitled “A study on consumer preference towards Britannia Good day biscuit” Detailed that Day by day the intensifying global competition is throwing challenges in the form of uncertainty and fluctuation in demand, necessity to provide wide variety to attract and hold the ever-demanding customer. To survive and succeed under such competitive environment, organizations are forced to find and adopt efficient and effective ways for their operations. Organizations are seeking ways to increase the value of their products
  • 35.
    and services byeliminating unnecessary processes and practices from all systems. Lean manufacturing is a systematic team-based approach for finding and eliminating waste. The implementation of Lean manufacturing system helps organisations to reduce lead-time and inventory, improve quality, and achieve better on-time deliveries and utilisation of resources leading towards increased sales and profit through customer satisfaction. The Indian biscuit industry is the third largest manufacturer of biscuit in the world producing around 60% of the total production in organised sector and the balance 40% by the unorganized bakeries 6. According to Moye & Kincade, Consumers express preference or lack of preference for stores, brands, advertisements and other marketing stimuli by reflecting a favourable or unfavourable attitude. In this sense, consumers with a favourable attitude towards a store will most likely select the store and buy its products, but consumers with unfavourable attitudes will not select the store and not purchase the products. Problems of Britannia Products Users: Health issue factors occupied 1st rank position and last rank is allotted to of smell factor among Britannia products during the under-study period. Factor analysis towards Purchase of Britannia Products: The important factors motivating buying decision behaviour of Britannia product are quality, advertisement, cost and goodwill during the study period. An analysis of explanation of higher factor loading revealed that the above said variables recorded factor to the extent of 71.0 percent, 63.9 percent, 68.3 percent, and 75.5 percent respectively during the study period. SUGGESTIONS: Based on the findings of the study, the researcher would like to give following suggestions to strengthen business and consumer satisfaction level.  The company to retain its market leadership should concentrate in sales promotion activities, which would enhance the sales of Britannia products.  Special programs me can be organized to motivate the dealers and retailer to gain awareness about various schemes and to push the sales.  Point of purchases display for Britannia should be increased. Britannia is found to be preferred by majority of the customers.
  • 36.
     Some ofthe respondents informed that the Britannia Company demand more deposits from the dealer, Hence the company should try to reduce the deposits amount from the dealers that will help the company to retain the existing dealers.  A few respondents informed that the Britannia Company does not give more advertisement compared to other companies. Hence the company may concentrate on advertisement to attract major customers.  Mostly respondents suggested in reduction of price.  They may also use innovative packing methods for covering the biscuits packs.  Britannia industries may bring a variety of new tastes in biscuits. CONCLUSION: The modern marketing and business are fully consumer and customer oriented. These ideas should be kept in mind with all the manufacturers. Otherwise,they have to lose the existing customers. All the companies should try to satisfy the desires and needs of the customers in all possible ways. As there are heavy competitions in the confectionary items, the Britannia industry should be very careful about customer satisfaction. The Company new products contribute considerable market share in the total market. Britannia products are most popular among its users mainly because of its taste and preferences,low price and much more availability. Customers ask for specific biscuits of Britannia in retail shop because of their advertisement. If the brand is not available, they would not recommend any other brand. Research Paper -03 An Overview of Indian FMCG Sector February 2016 ISSN - 2250-1991 | IF: 5.215 |
  • 37.
    Dr. Pramod H.Patil Assistant Professor, School of Management Sciences, SRTMU Sub-centre Latur. INTRODUCTION The Fast-Moving Consumer Goods (FMCG) sector is the key contributor of the Indian economy. This fourth largest sector of Indian economy provides employment to around 3 million people which accounts for approximately 5% of the total factory employment in the country. These products are daily consumed by each strata of the society irrespective of social class, income group, age group etc. FMCG sector is more lucrative because of low penetration levels, well established distribution network, low operating cost, lower percapita consumption, large consumer base and simple manufacturing processes for most of products resulting in low capital investments. The industry is highly competitive due to presence of multinational companies, domestic companies and unorganized sector. A major portion of the market is captured by unorganized players selling unbranded and unpackaged products. More than 50 per cent of the total revenues of FMCG companies come from products worth Rs 10 or less1. This has made the proliferation of localized brands which are offered in loose form in small towns and rural part where brand awareness is low. In last 10 years domestic players are giving tough competition to multinationals; infect they have outstripped many MNCs in growth and market cap. Between 2005- 2014 the profit of domestic companies increased by 24% against 14% increase of multinational companies. OBJECTIVES • To understand the concept of FMCG • To present an overview Indian FMCG sector • To critically analyze Indian FMCG sector Part A) Fast Moving Consumer Goods Fast Moving Consumer Goods are inexpensive products that require little shopping efforts These are non-durable products which are sold in packaged forms. These products are
  • 38.
    purchased by theend-consumer in small quantities and frequently. The main FMCG segments can be classified as Personal Care, Household care, Branded and Packaged food and Tobacco. • Personal Care: It consists of oral care; hair care; skin care; personal wash (soaps); cosmetics and toiletries; deodorants; perfumes; paper products (tissues, diapers, sanitary); shoe care etc. • Household Care: It comprises of fabric wash (laundry soaps and synthetic detergents); household cleaners (dish/utensil cleaners, floor cleaners, toilet cleaners, air fresheners, insecticides and mosquito repellants, metal polish and furniture polish). • Branded and Packaged Food and Beverages:It consists of health beverages; soft drinks; staples/cereals; bakery products (biscuits, bread, cakes); snack food; chocolates; ice cream; tea; coffee; processed fruits, vegetables and meat; dairy products; bottled water; branded flour; branded rice; branded sugar; juices etc. • Spirits and Tobacco: An exact product-wise sale breaks up for each of the items is difficult. (Graphical representation of Different category of FMCG Sector) Part B) Overview of Indian FMCG Sector History The Indian Fast-Moving Consumer Goods (FMCG) industry began to shape during the last fifty odd years. The growth of FMCG industry was not significant between 1950’s to the 80’s.
  • 39.
    The FMCG industrypreviously was not attractive from investor’s point of view due to low purchasing power and the government’s favoring of the small-scale sector. FMCG’s growth story further continued following the deregulation of Indian economy in early 1990s. With relatively lesser capital and technological requirements, several new brands emerged domestically as well, while the relaxed FDI conditions led to entry of many global players in this segment. These factors made FMCG market in India highly competitive and one of the important contributors in the Indian economy. In the mid - nineties, the growth of the sector was very fast whereas it declined rapidly at the end of the decade. The initial growth was due to increase in product penetration and consumption levels4. Riding on a rapidly growing economy, increasing per-capita incomes, and rising trend of urbanization, the FMCG market in India is expected to further expand to $100 billion by 2025. FINDINGS & DISCUSSION Indian FMCG sector has almost tripled in last decade, much faster than past decades. Even in the meltdown years of FY 2008 and FY 2009 the FMCG industry witnessed sustained growth rates of 14% and 11% respectively, this sector was relatively recession-proof12. This growth in FMCG sector is due to increase in demand, developments in supply side and favorable changes in Government Policy. CONCLUSION Today, Fast Moving consumers goods have become an integral part of human life. This sector is recession proof and created huge employment opportunity in India, hence becoming one of the key pillars of the Indian economy. FMCG companies should encase opportunities like increasing consumer income, changing consumer life style, aspiring rural consumer, consistent economic growth by utilizing its strengths. The competition from unorganized sector can be overcome by increasing brand awareness and by reducing cost through sharing resources such as distribution network. Favorable developments happening in demand side, supply side and systematic drivers shows that this sector has very bright future. Research Paper-04 Consumer Behavior towards selected FMCG (Fast Moving Consumer Goods) in Delhi NCR. Paper ID IJIFR/ V2/ E7/ 027
  • 40.
    M. Shehbaz Qasim ResearchScholar || Department of Management Shri Venkateshwara University Gajraula, Uttar Pradesh Swati Agarwal Director Research||Department of Education Shri Venkateshwara University Gajraula, Uttar Pradesh Abstract The aim of this research work is to study the consumers’ attitude towards Non-Alcoholic Beverages. The data for the study has been collected by performing face to- face interview with the respondents with the help of questionnaire. This study collects data from 400 consumers across Delhi NCR. This study is started with objectives of examining socio-economic background of respondents, analyzing the factors influencing consumer preferences towards selected FMCG products that is Non- Alcoholic Beverages, checking the level of satisfaction of consumers and knowing expectation of the consumers. This study reveals that consumer preferences are largely affected by age, sex, place, product, price, availability, psychological, people and brand influences. INTRODUCTION FMCG industry, alternatively called as CPG (Consumer packaged goods) industry primarily deals with the production, distribution and marketing of consumer-packaged goods. These are products that have a quick turnover, and relatively low cost. Consumers generally put less thought into the purchase of FMCG than they do for other products. Though the absolute profit made on FMCG products is relatively small, they generally sell in large numbers and so the cumulative profit on such products can be large. Some of the prime activities of FMCG industry are selling, marketing, financing, purchasing, etc. The industry also engaged in operations, supply chain, production and general management. The Indian FMCG sector is the fourth largest sector in the economy with a total market size in excess of US$ 44 billion. It has a strong MNC presence and is characterized by a well-established distribution network, intense competition between the organized and unorganized segments and low operational cost. Availability of key raw materials, cheaper labour costs and presence across the entire value
  • 41.
    chain gives Indiacompetitive advantage. The Indian consumers today are unique in the sense of being value sensitive and are not much price sensitive, as earlier. If they feel that a product offers them more value, they will buy it even if the price is high. The Indian consumers also follow strictly, their culture, tradition and values, as a result of which foreign companies are forced to give an Indian touch to their products in order to succeed in India. Objective of the study I. To examine consumers‟ preference towards various non-alcoholic beverages. II. To analyses motives of different age group for selection of non-alcoholic beverages. Research Methodology 1: Research Design This research is descriptive in nature as the study aims to find out the consumer behavior about FMCG product. The study is carried out the naturalistic observation and survey questioning, which are attributes of descriptive research. 2: Data Collection techniques The sources of data are primary as well as secondary. Primary data are collected through a survey of the consumers, using a well framed questionnaire. Information is also gathered through secondary sources like books, journals, magazines, dailies, and from the internet. The data collected from the two sources are scrutinized, analyzed, edited and tabulated. 3: Designing the Questionnaire Questionnaire is designed by the researcher in such a way that there are several questions designed based on scaling namely Likert Scales which have five scales like strongly agree, agree, neutral, disagree, strongly disagree. This enables the respondent to answer the questions in a structured manner by choosing one option among the five options. It provides a sense of comfort by choosing the precise answers. Each construct has minimum five sub constructs related to the key factor of the main construct. 4: Sampling Design The sampling technique involved is Convenient Sampling. This study conducted in various place in Delhi NCR city. Due to time constraint convenient sample was followed. Interpretation
  • 42.
    A buying decisioncan either be a planned one which is characterized by deliberate thoughtful search and evaluation, that will result in rational and accurate decisions or it can be an impulse purchase decision, which is spontaneous, unplanned and immediate. Sales promotional strategies play a major role in stimulating more of unplanned purchases. Food selection is a complex phenomenon. depending on a lot of factors, which affect human behaviour in different ways, resulting in the sum, and rejection of other products (Wadolowskaet al., 2008). Factors that affect food choices may be divided into three main groups: i)product-related factors, which rely on chemical and physical properties, sensory attributes (taste, aroma, texture, visual appearance), functional factors(packaging, accessibility, convenience), nutrient content etc.; ii) consumer-related factors, including personality (age, gender, education level), psychological factors (personality, experience, mood),physiological effects (satiety, hunger, appetite etc.);iii) environmental-related, which include economic(price, incomes), Our result agrees with a study in which it has been shown that about forty percent of those who rated the important health aspects of dairy beverages consumption were more than 45 years of age, a fact that supports the observation that consumers „health concerns increase with increasing age (Bech-L arsen and Scholderer, 2007). while males in higher percentage consumed other beverages. Fig 7.3 shows consumers up to 15 yrs like cold drink most. This may be due to taste, cost, celebrity and refreshment. Nutritious and juice drink accepted by all the groups equally. Health may be the reason for the same. Milk is accepted by all the age group of consumers as it has the great importance for human body growth. Social and psycho factor also work Dairy beverages exhibit beneficial health effects due to the presence of bioactive component. Research Paper no-05 A Case Study on Labeling Regulations of Pre-Packaged Food Product (Biscuits) Saista Anjum , Er.Chitra Sonkar, Er.Dorcus Masih M.Tech. Food Laws & Policies, Department of Food Process Engineering, Sam HigginBottom Institute of Agriculture, Technology and Sciences- Deemed University P.O-Naini, Allahabad, U.P-211007, India
  • 43.
    Abstract After a casestudy on labeling regulations in India it was observed that most of the companies are aware of FSSAI regulation and are maintaining the Acid Insoluble Ash and Acidity of Extracted Fat Level in their Products like Britannia has 0.026% and 0.73%, Sunfeast has 0.029% and 1.062%, Parle has 0.027% and 0.77% of acid insoluble ash and acidity of extracted fat. From the survey it was shown that most of the customers are not aware of the mandatory and voluntary labeling. For the awareness of consumers, the companies also provide some voluntary details on their products like USFDA norms, HACCP certified, FSSAI license number etc. This project is an investigation of the nutritional value of biscuits in the Indian market as claimed on the packaging material and it is also a study on the effect of packaging on consumer’s buying behavior. A questionnaire was set containing appropriate questions and survey was made on 100 consumers belonging to different categories. Introduction In their broadest and most conventional application, food labelling policies have a dual purpose: to protect consumers and to ensure fair marketing. To facilitate the development and use of food labelling, more understanding of good labelling practices is needed among governments, industry, civil society organizations and A color used on packaging greatly impacts the perception of the consumer. Shoppers judge the product attributes by the color on its packaging. (Delabyet al.,1999). Prepackaged food shall not be described or presented on any label or in any labelling in a manner that is false, misleading or deceptive or is likely to create an erroneous impression regarding its character in any respect; Prepackaged food shall not be described or presented on any label or in any labelling by words, pictorial or other devices which refer to or are suggestive either directly or indirectly, of any other product with which such food might be confused, or in such a manner as to lead the purchaser or consumer to suppose that the food relates to such other product. Even at the point of purchase it is packaging that influences the buying decision and dominates a product over its competitors. Packaging creates a positive perception on the consumers and can even result in brand switching in case of children. (Louw et al., 2007). “Nutrition claim means any representation which states, suggests or implies that a food has nutritional properties which are not limited to the energy value but include protein, fat carbohydrates, vitamins and minerals”. Some of the authorized nutrition claims are “free of fat/ saturated fat/cholesterol/sodium/salt/sugars and
  • 44.
    calories”, “very Lowin sodium”, “high or good source of calcium”, etc. (Food Safety and Standards regulations, 2011). The present study was undertaken with the objectives to investigate the claims regarding nutritional composition of packed food products (Biscuits), to perform a survey on mandatory and voluntary labeling on food productand.to study the effect of packaging requirements on consumer’s behavior. Brand of biscuits consumed by the people currently Reported that consumption of Britannia Burborn was 85%, Dark fantasy 78%, Parle-G 75% while Horlicks consumed 25% and 38% of Dream lite were consumed. So, it can be concluded that maximum consumed biscuit was Britannia Burborn and minimum biscuit consumed was Horlicks. Most of the consumers prefer Britannia Burborn, Dark fantasy, Parle – G as their first preference than Horlicks, Dream lite because of their quality, price and taste. Effect of parameters on consumer’s behavior Results clearly indicates that there is a strong association of packaging as more than 70% consumers stated that they believe on packaging to facilitate their decision-making process at the POP (point of Purchase). (Wells et al., 2007). Brand of the food product plays the most important role with 65% consumers admitting that this is the most important attribute. Taste and price of the food product are other attributes in order of importance assigned by the. Net quantity and Labelling regulation of such products are the least important reasons for buying them. The reason for buying Biscuits is mostly for its Taste, Quality, Brand, Attractive packaging and Offer while few of them prefer because of their cheap prices. Packaging also plays an important role in influencing the buying behavior of the consumers as shown in fig 3.9. These finding are in accordance with the findings of Bone, 2001. Conclusions From the investigation study (survey), it can be concluded that most of the customers are not aware about the mandatory and voluntary labeling. Inspite of that the company strictly follow the mandatory rules of FSSAI and for the awareness of consumers they also provide some voluntary details like USFDA norms, HACCP certified, FSSAI license no. Sunfeast, Britannia
  • 45.
    and Parle isthe most popular amongst its users, so to be on top of mind of the customers, the company need to do something outstanding every time. 2.2 Identification of the Gap where no substantial work has been done. Traditionally the FMCG industry is an extremely competitive business. The diverse, broad and hard-to-predict influencing factors in sales, marketing and supply chain make it an ever- changing field. In this environment of constant change, FMCG executives not only have to strategize for the present but also plan. Since the consumer base is huge and distributed across various geographical locations, the competition from local players also impacts business. Also, with the advent of digital media and increase in delivery channels, tapping the most spot-on growth opportunities has become more complicated in an already complex system. To sum it up in a few lines, the success of an FMCG company heavily relies on two crucial aspects speed and accuracy. Whether it is to run the right sales promotions or choosing the best marketing campaign or picking the most cost-effective supply chain, the overall success depends on 1. The accuracy of decisions in each scenario. 2. How fast every decision is taken However, when it comes it to accessing required information, FMCG companies typically face these 4 major challenges: 1. Dependence on a standalone BI Tool/Application Half knowledge is more dangerous than ignorance. Most FMCG firms depend on analytics or a BI tool for obtaining insights and decision making. While the data obtained is still useful, the data acquired doesn’t give a 360-degree view of each scenario. For example, using the tool you might easily notice that there is a drop in soft drinks’ sales in London. However, you may not conveniently spot the exact reason and problem source for this
  • 46.
    drop. You againneed to check numerous related hierarchy reports/spreadsheets (product, sales, region etc.) to find the cause. In an industry where there are multitudinous influencing factors and time is a crunch factor, the usage of such a singular tool leads to an inaccurate and time- consuming decision making. 2. Customizable Reports The one thing an FMCG executive can’t survive without – Reports. This is obvious and understandable. Customarily for FMCG users, reports were the go-to visual formats for accessing data. However, in most FMCG firms, report generation is a job of MIS or developer teams. Whenever executives need new reports or updating of existing reports, they must constantly hover around these teams. This tedious procedure wastes time and decreases the work productivity of both groups. 3. Insights from limited data sources Typically, FMCG companies use internal market research data, organizational historical data or/and syndicated data from vendors like Nielsen, IRI, SPINS etc. These types of data are important. We won’t deny that. But in an industry which possesses multifarious consumer touch points, the sole dependence on syndicated data providers results in limited insights. There will be an additional need to combine the internal sales, market research and finance data with syndicated data to get the right insights. Also, combining this data with external data sources like Social feeds from Twitter, Facebook, weather forecasts, events related data make these insights far richer to study cause and effect. 4. Lack of forecasting and evaluation intelligence As mentioned earlier, FMCG executives not only have to strategize for today but also plan for tomorrow. They need to continuously factor in various market scenarios and forecast growth for the future. An effective BI system should not just provide insight but also help users in evaluating understanding the consequences of every decision. For instance, if the CMO decides to increase the marketing budget by 30% in London, the BI system should be able to analyze and forecast the effect on sales in that region.
  • 47.
    or If the brandmanager wants to cut costs on dogs (as in the BCG matrix) and explore new market/product segments, the BI system should be able to detect and recommend growth opportunities or How will external factors like weather or events in the city going to impact sales – If it is going to be colder than usual temperatures, certain products will be sold more and If there is a football event there will be an increase in demand for certain beverages and snacks. However, these elements are missing in several FMCG BI systems today and most executives still depend on intuition-based strategies. Conclusion To wrap it up, speed and accuracy of decision-making are extremely critical for the success of any FMCG business.
  • 48.
    CHAPTER-03 Research Methodology 3.1 DataSource  The present study is largely based on the primary data collected from rural and urban consumers through field survey. Field survey was conducted by intensively interviewing individuals of different families considering them as the representative of the household. For this purpose, a structured questionnaire was administrated. .  Preliminary study in order to evaluate feasibility, time, cost, adverse events and statistical availability to predict an appropriate sample size and improve upon the study design prior to the execution of a full-scale study.  A pilot study is usually carried out on respondents from target population, but not on those who constitute the final sample because it may influence the latter’s behavior over research subjects.  The pilot study introduced some changes in the hypotheses which were set previously; some were changed, some were dropped, and some were developed newly. The response set of 50 respondents had brought in new ideas and clues that increased the chances of getting clearer findings in the main study. With no more ambiguities, the study became more defined and paved the way to make much required alterations in the data collecting methods in order to assist in analyzing the data more efficiently. 3.2 Method of Data Collection. The survey approach has been chosen for the study to gather descriptive information; structured survey with formal lists of direct questions was conducted among the respondents. Generally, this approach is used to collect data for different kinds of studies. Moreover, this approach is quick and carries low cost as compared to observation and experimental methods.
  • 49.
    3.3 SAMPLE METHOD& SIZE Multiple-stage sampling has been used for selecting the sample. In the research study, probability systematic random sampling has been used for collecting the data; it is also called an Nth name selection technique. This method is used because under this procedure each element in the population has a known and equal probability of selection. Further, probability random sampling has been used for giving equal probability to every unit. The size of the sample is 100 and data has been taken for the further use. 3.4 Data Analysis techniques I. Quantitative Data Analysis Methods After collection of data by direct questionnaires (Google Forms) , the data is ready for analysis. The two most commonly used quantitative data analysis methods are descriptive statistics and inferential statistics. A. Descriptive Statistics Typically, descriptive statistics (also known as descriptive analysis) is the first level of analysis. It helps researchers summarize the data and find patterns. A few commonly used descriptive statistics are: Mean: numerical average of a set of values. Median: midpoint of a set of numerical values. Mode: most common value among a set of values. Percentage: used to express how a value or group of respondents within the data relates to a larger group of respondents. Frequency: the number of times a value is found. Range: the highest and lowest value in a set of values.
  • 50.
     Descriptive statisticsprovide absolute numbers. However, they do not explain the rationale or reasoning behind those numbers. Before applying descriptive statistics, it’s important to think about which one is best suited for your research question and what you want to show. For example, a percentage is a good way to show the gender distribution of respondents.  Descriptive statistics are most helpful when the research is limited to the sample and does not need to be generalized to a larger population. For example, if you are comparing the percentage of children vaccinated in two different villages, then descriptive statistics is enough.  Since descriptive analysis is mostly used for analyzing single variable, it is often called univariate analysis. B. Inferential Statistics Often, researchers collect data on a sample of their population, then they generalize the results to the entire population or target group. Inferential statistics are used to generalize results and make predictions about a larger population. These are complex analyses that show the relationship between several different variables, rather than describing a single variable. They are used when the researcher needs to go beyond absolute values and understand the relations between variables. A few types of inferential analysis are: Correlation: This describes the relationship between two variables. If a correlation is found, it means that there is a relationship among the variables. For example, taller people tend to have a higher weight. Hence, height and weight are correlated with each other. However, this
  • 51.
    doesn’t necessarily meanthat one variable causes the other (e.g. gaining weight doesn’t cause people to grow taller). Regression: This shows the relationship between two variables. For example, regression can help us guess someone’s weight based on their height. Analysis of variance: This is a statistical procedure used to test the degree to which two or more groups vary or differ in an experiment. In most experiments, a great deal of variance indicates that there was a significant finding from the research. For example, to understand the relationship between the number of children in a family and the socio-economic status, a researcher may recruit a sample of families from each socio-economic status and ask them about their ideal number of children. Analysis of variance will be used to check if the difference between the groups’ answers is statistically significant or due to random chance. II. QUALITATIVE DATA ANALYSIS METHOD Qualitative data analysis works a little differently from quantitative data, primarily because qualitative data is made up of words, observations, images, and even symbols. Deriving absolute meaning from such data is nearly impossible; hence, it is mostly used for exploratory research. While in quantitative research there is a clear distinction between the data preparation and data analysis stage, analysis for qualitative research often begins as soon as the data is available. Data Preparation and Basic Data Analysis Analysis and preparation happen in parallel and include the following steps:  Getting familiar with the data: Since most qualitative data is just words, the researcher should start by reading the data several times to get familiar with it and start looking for basic observations or patterns. This also includes transcribing the data.  Revisiting research objectives: Here, the researcher revisits the research objective and identifies the questions that can be answered through the collected data.  Developing a framework: Also known as coding or indexing, here the researcher identifies broad ideas, concepts, behaviors, or phrases and assigns codes to them. For example, coding age, gender, socio-economic status, and even concepts such as the
  • 52.
    positive or negativeresponse to a question. Coding is helpful in structuring and labeling the data.  Identifying patterns and connections: Once the data is coded, the research can start identifying themes, looking for the most common responses to questions, identifying data or patterns that can answer research questions, and finding areas that can be explored further. Brief Description of the choice of techniques and justification of their use. i. I’ll start with a quick definition of them both. Quantitative research is the empirical investigation of the research question using scientific methods. The results gathered are numerical and can therefore be analyzed statistically to answer the hypothesis. Qualitative research is done on a much more individual basis. It is the analysis of social phenomena, and statistics are not used at all. Instead researchers will look at biographies, interviews, case studies, and try to understand why people act as they do. ii. I can see why some people insist that quantitative research is better than qualitative research. One reason for this is that it is more scientific. A large amount of data is gathered and then analyzed statistically. This allows for very little bias, and if 100 researchers ran the analysis on the data, they would always end up with the same numbers at the end of it. The researcher also has more control over how the data is gathered and is more distant from the experiment. However, in qualitative, the researcher is often the person doing the interview or involved in some other way. This does not allow them the outside perspective gained from doing quantitative research. There is also more bias involved in qualitative research. This is because most of the results come from the researcher’s interpretation of the data. This does not seem all that accurate – two different people looking at the same interview could interpret in two very different ways, depending on their mood, personality, upbringing, and a huge number of other factors. Think about our seminar groups! Everyone had a different idea about the friendship spoken about in the interview. iii. Qualitative research is defined as a market research method that focuses on obtaining data through open-ended and conversational communication. iv. This method is not only about “what” people think but also “why” they think so. For example, consider a convenience store looking to improve its patronage. A systematic
  • 53.
    observation concludes thatthe number of men visiting this store are more. One good method to determine why women were not visiting the store is to conduct an in-depth interview of potential customers in the category. v. On successfully interviewing female customers, visiting the nearby stores and malls, and selecting them through random sampling, it was known that the store doesn’t have enough items for women and so there were fewer women visiting the store, which was understood only by personally interacting with them and understanding why they didn’t visit the store, because there were more male products than female ones. Therefore, the qualitative research methods allow for in-depth and further probing and questioning of respondents based on their responses, where the interviewer/researcher also tries to understand their motivation and feelings