Download as PDF, PPTX

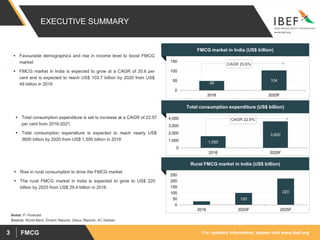
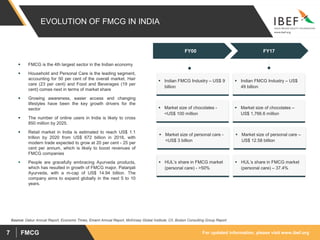
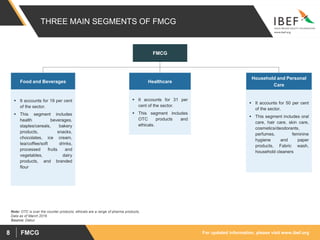
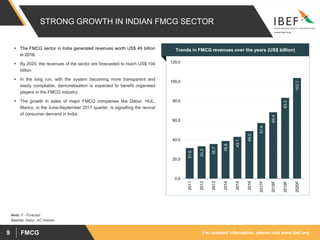
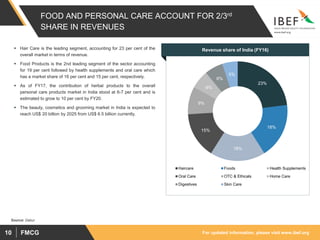
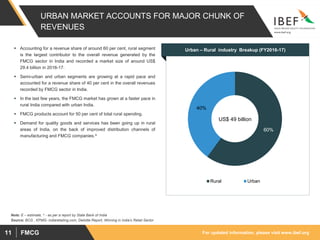
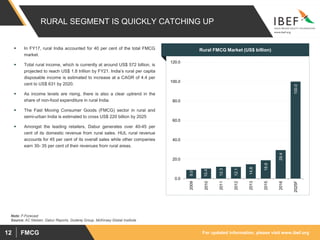
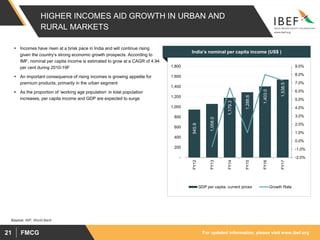


The document summarizes key information about the fast moving consumer goods (FMCG) sector in India: 1) The FMCG market in India is expected to grow at a CAGR of 20.6% to reach $103.7 billion by 2020 from $49 billion in 2016. Total consumption expenditure is also forecasted to increase significantly in this period. 2) Rural consumption is a major driver of growth in the FMCG sector, with the rural FMCG market expected to reach $220 billion by 2025. 3) Food and personal care account for around two-thirds of total FMCG revenues in India. Hair care and food products are the largest segments currently.


