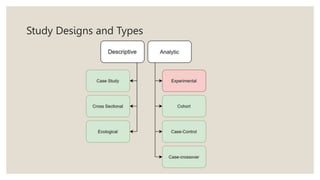
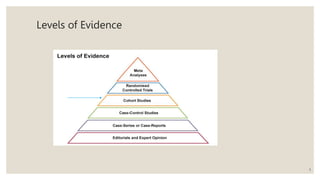
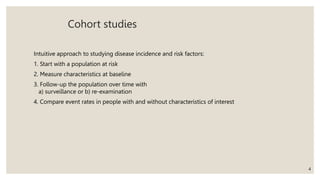
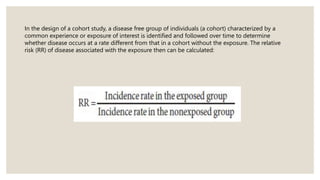
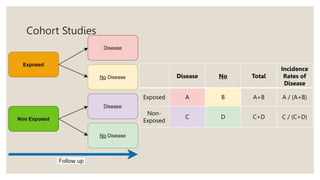
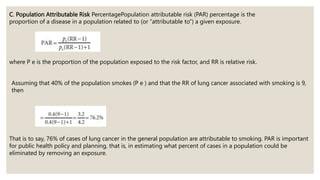
EPIDEMIOLOGICAL
STUDIES
Cohort Studies
Dr Adhya Dubey
JR-2
Department of Community Medicine
Pt. BD Sharma PGIMS, Rohtak
Study Designs and Types
3
Levels of Evidence
4
Cohort studies
Intuitive approach to studying disease incidence and risk factors:
1. Start with a population at risk
2. Measure characteristics at baseline
3. Follow-up the population over time with
a) surveillance or b) re-examination
4. Compare event rates in people with and without characteristics of interest
Cohort studies
Can be large or small
Can be long or short
Can be simple or elaborate
Can be local or multinational
For rare outcomes need many people and/or lengthy follow-up
May have to decide what characteristics to measure long in advance
In the design of a cohort study, a disease free group of individuals (a cohort) characterized by a
common experience or exposure of interest is identified and followed over time to determine
whether disease occurs at a rate different from that in a cohort without the exposure. The relative
risk (RR) of disease associated with the exposure then can be calculated:
Cohort Studies
Disease No Total
Incidence
Rates of
Disease
Exposed A B A+B A / (A+B)
Non-
Exposed
C D C+D C / (C+D)
An example of the prospective cohort design is the followup study of British physicians
• Smoking habits were ascertained by means of a mailed questionnaire
• The doctors were grouped according to smoking habits, and their deaths were subsequently
monitored.
• Lung cancer rates for those exposed to various levels of smoking were compared with the rates
for nonsmokers by means of the RR.
• Other examples of cohort studies include investigations of longterm cancer incidence among
atomic bomb survivors exposed to varying degrees of radiation, deaths among British coal
miners and monitoring for disease among firefighters exposed to the 9/11 site.
The prospective cohort study is ideal because the hypothesized cause or exposure precedes the effect or disease.
• The disease rates and RRs can be calculated directly.
• When cohorts are followed prospectively the exposure of interest can be recorded accurately at the time of
exposure; it is not based on recall of past events.
• This approach has been popular in occupational studies in which the disease experience of workers exposed to
putatively hazardous substances has been compared with that of other workers without the exposure or
compared with that of the general population.
• The expense, the time involved, and the number of subjects required, the model prospective
cohort study is relatively rare.
• To avoid some of these constraints, a historical cohort study might be done, whereby a group of
persons who in the past experienced an exposure of interest is identified, and their disease
record up to the present is investigated.
• An example is the followup of mortality among insulation workers exposed to asbestos. The
population of union insulation workers in the 1940s was identified, and their cause specific
mortality rates through the 1970s were determined. Mortality rates for lung cancer and other
causes in this population were tabulated and compared with those expected on the basis of
mortality rates for all US men. Because the historical cohort study is a retrospective approach, the
terms cohort study and prospective study should not be used synonymously.
Many terms, many meanings
E.g., “attributable risk” can mean:
◦ Risk difference
◦ Population attributable risk percent
◦ Concept of assessing impact
“Absolute” perspective
How much risk?
◦ In exposed persons:
risk difference (R1– R0)
◦ In the total population:
(R1– R0) x exposure prevalence (p1)
How many cases?
(R1– R0) x # of exposed persons (n1)
Relative perspective
What proportion of the risk is attributable?
(What proportion of cases could be eliminated?)
In exposed persons: (R1– R0) / R1 = (RR–1) / RR
(Relative strength of association)
In the population: (R – R0) / R
(Strength of association and prevalence)
Attributable risk diagram
R1 R1 R1 – R0 =
"Attributable
R0
R0 n0 R0 n1
R0 risk"
n0 n1 p1= n1/n
Attributable cases
Prevented fraction diagram
R0 R0
R1
R0 n0 R0 n1
R1
n0 n1 p1= n1/n
Prevented
(potential) cases
16
Measures of Association in a Cohort Study
A. Relative RiskRelative risk (RR) is the risk of disease among people exposed to a factor relative to the risk among
people not exposed and is a measure of the strength of association between an exposure and a disease
• An RR greater than 1 implies a positive association of the disease with the exposure of interest.
• An RR less than 1 implies a negative association (or protective effect) between the disease and the exposure.
• The results in the preceding example suggest that the risk of lung cancer among smokers is nine times greater
than the risk for nonsmokers. RR is important for testing etiologic hypotheses.
B. Attributable RiskAttributable risk (AR) is the rate in the exposed population minus the rate in the
nonexposed population.
• It indicates the rate of occurrence of death or disease that is caused by a specific exposure factor.
• Of the 63 lung cancer deaths that occur annually among 100,000 smokers, 56 (89%) are attributable to
smoking.
• A disease may have multiple risk factors that interact with each other, the sum of ARs may be greater than
100%.
• AR can be an important tool for counseling individuals with specific risk factors because it helps give an
idea about the amount of disease that could be avoided by reducing risk factors in individuals.
C. Population Attributable Risk PercentagePopulation attributable risk (PAR) percentage is the
proportion of a disease in a population related to (or “attributable to”) a given exposure.
where P e is the proportion of the population exposed to the risk factor, and RR is relative risk.
Assuming that 40% of the population smokes (P e ) and that the RR of lung cancer associated with smoking is 9,
then
That is to say, 76% of cases of lung cancer in the general population are attributable to smoking. PAR is important
for public health policy and planning, that is, in estimating what percent of cases in a population could be
eliminated by removing an exposure.
THANK YOU!

EpidemiologicalstudiesCohort studies.pptx

  • 1.
    EPIDEMIOLOGICAL STUDIES Cohort Studies Dr AdhyaDubey JR-2 Department of Community Medicine Pt. BD Sharma PGIMS, Rohtak
  • 2.
  • 3.
  • 4.
    4 Cohort studies Intuitive approachto studying disease incidence and risk factors: 1. Start with a population at risk 2. Measure characteristics at baseline 3. Follow-up the population over time with a) surveillance or b) re-examination 4. Compare event rates in people with and without characteristics of interest
  • 5.
    Cohort studies Can belarge or small Can be long or short Can be simple or elaborate Can be local or multinational For rare outcomes need many people and/or lengthy follow-up May have to decide what characteristics to measure long in advance
  • 6.
    In the designof a cohort study, a disease free group of individuals (a cohort) characterized by a common experience or exposure of interest is identified and followed over time to determine whether disease occurs at a rate different from that in a cohort without the exposure. The relative risk (RR) of disease associated with the exposure then can be calculated:
  • 7.
    Cohort Studies Disease NoTotal Incidence Rates of Disease Exposed A B A+B A / (A+B) Non- Exposed C D C+D C / (C+D)
  • 8.
    An example ofthe prospective cohort design is the followup study of British physicians • Smoking habits were ascertained by means of a mailed questionnaire • The doctors were grouped according to smoking habits, and their deaths were subsequently monitored. • Lung cancer rates for those exposed to various levels of smoking were compared with the rates for nonsmokers by means of the RR. • Other examples of cohort studies include investigations of longterm cancer incidence among atomic bomb survivors exposed to varying degrees of radiation, deaths among British coal miners and monitoring for disease among firefighters exposed to the 9/11 site.
  • 9.
    The prospective cohortstudy is ideal because the hypothesized cause or exposure precedes the effect or disease. • The disease rates and RRs can be calculated directly. • When cohorts are followed prospectively the exposure of interest can be recorded accurately at the time of exposure; it is not based on recall of past events. • This approach has been popular in occupational studies in which the disease experience of workers exposed to putatively hazardous substances has been compared with that of other workers without the exposure or compared with that of the general population.
  • 10.
    • The expense,the time involved, and the number of subjects required, the model prospective cohort study is relatively rare. • To avoid some of these constraints, a historical cohort study might be done, whereby a group of persons who in the past experienced an exposure of interest is identified, and their disease record up to the present is investigated. • An example is the followup of mortality among insulation workers exposed to asbestos. The population of union insulation workers in the 1940s was identified, and their cause specific mortality rates through the 1970s were determined. Mortality rates for lung cancer and other causes in this population were tabulated and compared with those expected on the basis of mortality rates for all US men. Because the historical cohort study is a retrospective approach, the terms cohort study and prospective study should not be used synonymously.
  • 11.
    Many terms, manymeanings E.g., “attributable risk” can mean: ◦ Risk difference ◦ Population attributable risk percent ◦ Concept of assessing impact
  • 12.
    “Absolute” perspective How muchrisk? ◦ In exposed persons: risk difference (R1– R0) ◦ In the total population: (R1– R0) x exposure prevalence (p1) How many cases? (R1– R0) x # of exposed persons (n1)
  • 13.
    Relative perspective What proportionof the risk is attributable? (What proportion of cases could be eliminated?) In exposed persons: (R1– R0) / R1 = (RR–1) / RR (Relative strength of association) In the population: (R – R0) / R (Strength of association and prevalence)
  • 14.
    Attributable risk diagram R1R1 R1 – R0 = "Attributable R0 R0 n0 R0 n1 R0 risk" n0 n1 p1= n1/n Attributable cases
  • 15.
    Prevented fraction diagram R0R0 R1 R0 n0 R0 n1 R1 n0 n1 p1= n1/n Prevented (potential) cases
  • 16.
    16 Measures of Associationin a Cohort Study
  • 17.
    A. Relative RiskRelativerisk (RR) is the risk of disease among people exposed to a factor relative to the risk among people not exposed and is a measure of the strength of association between an exposure and a disease • An RR greater than 1 implies a positive association of the disease with the exposure of interest. • An RR less than 1 implies a negative association (or protective effect) between the disease and the exposure. • The results in the preceding example suggest that the risk of lung cancer among smokers is nine times greater than the risk for nonsmokers. RR is important for testing etiologic hypotheses.
  • 18.
    B. Attributable RiskAttributablerisk (AR) is the rate in the exposed population minus the rate in the nonexposed population. • It indicates the rate of occurrence of death or disease that is caused by a specific exposure factor. • Of the 63 lung cancer deaths that occur annually among 100,000 smokers, 56 (89%) are attributable to smoking. • A disease may have multiple risk factors that interact with each other, the sum of ARs may be greater than 100%. • AR can be an important tool for counseling individuals with specific risk factors because it helps give an idea about the amount of disease that could be avoided by reducing risk factors in individuals.
  • 19.
    C. Population AttributableRisk PercentagePopulation attributable risk (PAR) percentage is the proportion of a disease in a population related to (or “attributable to”) a given exposure. where P e is the proportion of the population exposed to the risk factor, and RR is relative risk. Assuming that 40% of the population smokes (P e ) and that the RR of lung cancer associated with smoking is 9, then That is to say, 76% of cases of lung cancer in the general population are attributable to smoking. PAR is important for public health policy and planning, that is, in estimating what percent of cases in a population could be eliminated by removing an exposure.
  • 20.