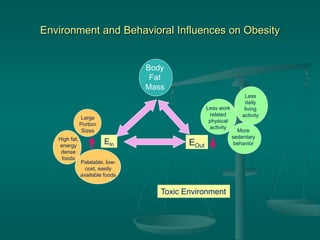
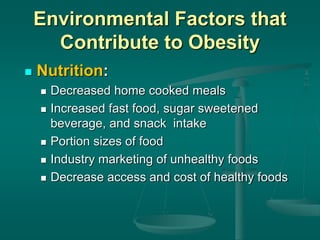
Environmental Factors
Environment and Behavioral Influences on Obesity
EIn EOut
Body
Fat
Mass
High fat,
energy
dense
foods
Palatable, low-
cost, easily
available foods
Large
Portion
Sizes
Less work
related
physical
activity
Less
daily
living
activity
More
sedentary
behavior
Toxic Environment
Selected Behaviors That Lead to
a Higher Risk of Weight Gain
 Excessive TV watching
 Too little physical activity
 Eating out frequently (Esp. Fast Food)
 Snacking on energy dense food and drink
 Skipping breakfast
 Consuming large portions
2010 Dietary Guidelines
Environmental Factors that
Contribute to Obesity
 Nutrition:
 Decreased home cooked meals
 Increased fast food, sugar sweetened
beverage, and snack intake
 Portion sizes of food
 Industry marketing of unhealthy foods
 Decrease access and cost of healthy foods
Environmental Contributions
 Decreased energy expenditure
 Increased sedentary activities such as TV &
electronic media use
 Increase labor saving devices
 Reduction in energy expenditure of daily
activities
 Reduction of physical activity in the workplace
 Declined participation of children in physical
education classes
Energy Expenditure in Adults
and Children
 About 1 in 5 (21%) adults meet the 2008 Physical Activity
Guidelines.
 Less than 3 in 10 high school students get at least 60 minutes of
physical activity every day.
 Physical activity can improve health. People who are physically
active tend to live longer and have lower risk for heart disease,
stroke, type 2 diabetes, depression, and some cancers. Physical
activity can also help with weight control, and may improve
academic achievement in students.
 Inactive adults have a higher risk for early death, heart disease,
stroke, type 2 diabetes, depression, and some cancers.
http://www.cdc.gov/physicalactivity/data/facts.htm
Energy Intake Trends
 Ages 2 to 17 have increased daily total
calorie intake by ~ 60 kcal
 21,900 kcal/year  ~ 6 pounds/year
 Men ages 20 to 39 have increased daily
total calorie intake by ~ 200 kcal
 73,000 kcal/year  ~ 21 pounds/year
 Women ages 20 to 39 have increased
daily total calorie intake by ~ 280 kcal
 102,200 kcal/year  ~ 29 pounds/year
What are Americans eating
Average daily per capita calories from the US
food availability in 1970, 1990 and 2008,
adjusted for spoilage and other waste
Recent literature has tried to quantify the
energy gap that has led to the current
obesity epidemic, with estimations ranging
from 100 to 400 extra calories per day
 The chart on the following slide shows how the average
American diet compares to recommendations found in
the 2010 Dietary Guidelines. Whole grains, vegetables,
fruits, dairy products, seafood, and oils are consumed
below recommended amounts. Nutrients of concern are
fiber, potassium, calcium, and vitamin D. Note that the
intake shown for vitamin D only includes food sources,
not supplements or vitamin D manufactured in response
to sun exposure.
 The excessive amounts consumed of solid fats and
added sugars, refined grains, and sodium are clearly
shown in comparison to recommended limits.
Comparison of Consumption
to Recommendations
Comparison of Consumption
to Recommendations
What’s New:
2015 Dietary Guideline Report
Top Sources of Calories
Table D1.12. Percent of total energy intake from the 32 as-consumed food subcategories,* NHANES 2009-10.
Rank Subcategory % of total energy
consumption
Cumulative %
1 BURGERS, SANDWICHES, and TACOS 13.8 13.8
2 DESSERTS and SWEET SNACKS 8.5 22.3
3 SUGAR-SWEETENED and DIET BEVERAGES 6.5 28.8
4 RICE, PASTA, GRAIN-BASED MIXED DISHES 5.5 34.3
5 CHIPS, CRACKERS, and SAVORY SNACKS 4.6 38.9
6 PIZZA 4.3 43.2
http://health.gov/dietaryguidelines/2015-scientific-report/PDFs/06-Part-D-
Chapter-1.pdf
43% of all energy intake comes from these top 6 categories.
Percent of total energy intake from the 32 as-consumed food
subcategories,* NHANES 2009-10
Marketing
 The food industry spends 10 billion
dollars to influence the eating
behavior of children
 McDonalds spends >1 billion dollars
on advertising to children as young as
2 years of age

Environmental Factors

  • 1.
  • 2.
    Environment and BehavioralInfluences on Obesity EIn EOut Body Fat Mass High fat, energy dense foods Palatable, low- cost, easily available foods Large Portion Sizes Less work related physical activity Less daily living activity More sedentary behavior Toxic Environment
  • 3.
    Selected Behaviors ThatLead to a Higher Risk of Weight Gain  Excessive TV watching  Too little physical activity  Eating out frequently (Esp. Fast Food)  Snacking on energy dense food and drink  Skipping breakfast  Consuming large portions 2010 Dietary Guidelines
  • 4.
    Environmental Factors that Contributeto Obesity  Nutrition:  Decreased home cooked meals  Increased fast food, sugar sweetened beverage, and snack intake  Portion sizes of food  Industry marketing of unhealthy foods  Decrease access and cost of healthy foods
  • 5.
    Environmental Contributions  Decreasedenergy expenditure  Increased sedentary activities such as TV & electronic media use  Increase labor saving devices  Reduction in energy expenditure of daily activities  Reduction of physical activity in the workplace  Declined participation of children in physical education classes
  • 6.
    Energy Expenditure inAdults and Children  About 1 in 5 (21%) adults meet the 2008 Physical Activity Guidelines.  Less than 3 in 10 high school students get at least 60 minutes of physical activity every day.  Physical activity can improve health. People who are physically active tend to live longer and have lower risk for heart disease, stroke, type 2 diabetes, depression, and some cancers. Physical activity can also help with weight control, and may improve academic achievement in students.  Inactive adults have a higher risk for early death, heart disease, stroke, type 2 diabetes, depression, and some cancers. http://www.cdc.gov/physicalactivity/data/facts.htm
  • 7.
    Energy Intake Trends Ages 2 to 17 have increased daily total calorie intake by ~ 60 kcal  21,900 kcal/year  ~ 6 pounds/year  Men ages 20 to 39 have increased daily total calorie intake by ~ 200 kcal  73,000 kcal/year  ~ 21 pounds/year  Women ages 20 to 39 have increased daily total calorie intake by ~ 280 kcal  102,200 kcal/year  ~ 29 pounds/year
  • 8.
    What are Americanseating Average daily per capita calories from the US food availability in 1970, 1990 and 2008, adjusted for spoilage and other waste Recent literature has tried to quantify the energy gap that has led to the current obesity epidemic, with estimations ranging from 100 to 400 extra calories per day
  • 9.
     The charton the following slide shows how the average American diet compares to recommendations found in the 2010 Dietary Guidelines. Whole grains, vegetables, fruits, dairy products, seafood, and oils are consumed below recommended amounts. Nutrients of concern are fiber, potassium, calcium, and vitamin D. Note that the intake shown for vitamin D only includes food sources, not supplements or vitamin D manufactured in response to sun exposure.  The excessive amounts consumed of solid fats and added sugars, refined grains, and sodium are clearly shown in comparison to recommended limits. Comparison of Consumption to Recommendations
  • 10.
  • 11.
    What’s New: 2015 DietaryGuideline Report Top Sources of Calories Table D1.12. Percent of total energy intake from the 32 as-consumed food subcategories,* NHANES 2009-10. Rank Subcategory % of total energy consumption Cumulative % 1 BURGERS, SANDWICHES, and TACOS 13.8 13.8 2 DESSERTS and SWEET SNACKS 8.5 22.3 3 SUGAR-SWEETENED and DIET BEVERAGES 6.5 28.8 4 RICE, PASTA, GRAIN-BASED MIXED DISHES 5.5 34.3 5 CHIPS, CRACKERS, and SAVORY SNACKS 4.6 38.9 6 PIZZA 4.3 43.2 http://health.gov/dietaryguidelines/2015-scientific-report/PDFs/06-Part-D- Chapter-1.pdf 43% of all energy intake comes from these top 6 categories.
  • 12.
    Percent of totalenergy intake from the 32 as-consumed food subcategories,* NHANES 2009-10
  • 13.
    Marketing  The foodindustry spends 10 billion dollars to influence the eating behavior of children  McDonalds spends >1 billion dollars on advertising to children as young as 2 years of age