Download to read offline

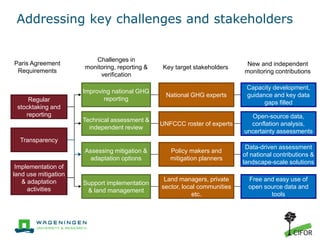

The document discusses the importance of independent monitoring approaches in enhancing transparency within the land use sector post-Paris Agreement. It highlights the unique potential of this sector for negative emissions and addresses key challenges such as data accuracy and stakeholder participation. Recommendations emphasize the need for ongoing capacity building and the use of open-source data to support effective monitoring and reporting efforts.


