Downloaded 94 times

![14
Why data quality?
Data sources (II)
“Learning is a complex social activity”
[Siemens2012]
Lots of data
Lots of tools
Humans to make sense](https://image.slidesharecdn.com/enhancingeducationaldataqualityinheterogeneouslearningcontextsusingpentahodataintegration-150719084339-lva1-app6892/75/Enhancing-educational-data-quality-in-heterogeneous-learning-contexts-using-pentaho-data-integration-14-2048.jpg)
![15
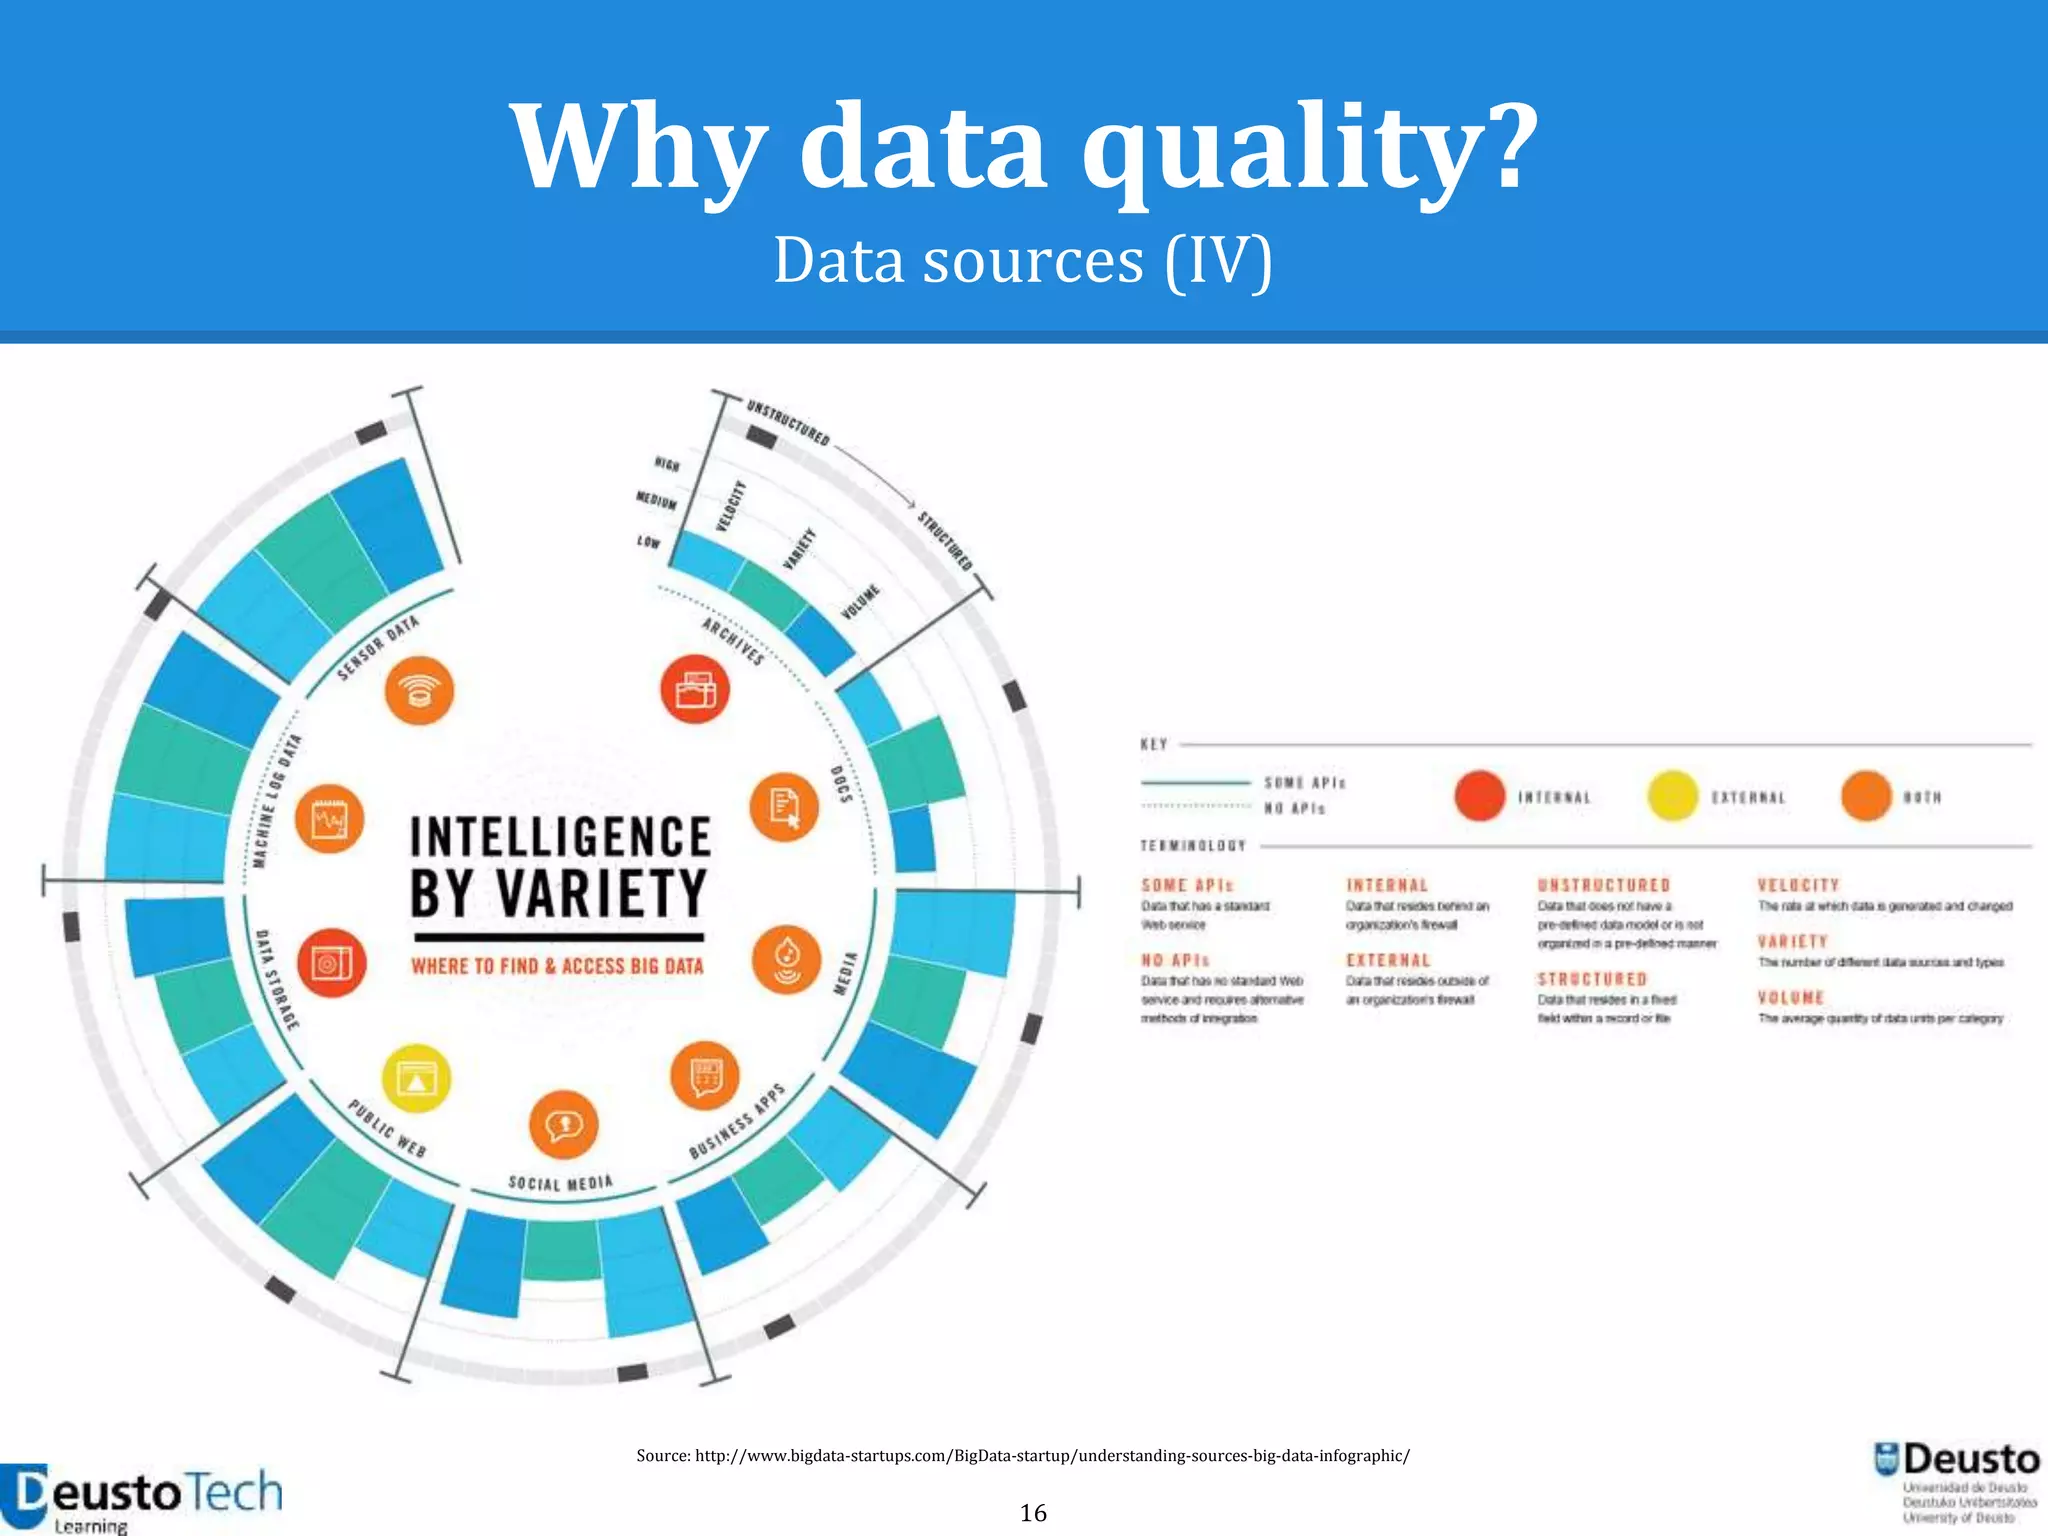
Why data quality?
Data sources (III)
● The world of technology has changed
[Eaton2012]
o 80% of the world’s information is unstructured
o Unstructured data are growing at 15 times the rate
of structured information
o Raw computational power is growing at such an
enormous rate that we almost have a supercomputer
in our hands
o Access to information is available to all](https://image.slidesharecdn.com/enhancingeducationaldataqualityinheterogeneouslearningcontextsusingpentahodataintegration-150719084339-lva1-app6892/75/Enhancing-educational-data-quality-in-heterogeneous-learning-contexts-using-pentaho-data-integration-15-2048.jpg)
![20
Why data quality?
Challenges (II)
● Data is incomplete
● Certain types of usage data are not logged
● Data are not aggregated following a
didactical perspective
● Users are afraid that they could draw
unsound inferences from some of the data
[Mazza2012]](https://image.slidesharecdn.com/enhancingeducationaldataqualityinheterogeneouslearningcontextsusingpentahodataintegration-150719084339-lva1-app6892/75/Enhancing-educational-data-quality-in-heterogeneous-learning-contexts-using-pentaho-data-integration-20-2048.jpg)
![25
Why data quality?
Development of common language for data exchange (V)
[LACE2013]](https://image.slidesharecdn.com/enhancingeducationaldataqualityinheterogeneouslearningcontextsusingpentahodataintegration-150719084339-lva1-app6892/75/Enhancing-educational-data-quality-in-heterogeneous-learning-contexts-using-pentaho-data-integration-25-2048.jpg)
![26
Why data quality?
Development of common language for data exchange (VI)
[LACE2013]
In our case?](https://image.slidesharecdn.com/enhancingeducationaldataqualityinheterogeneouslearningcontextsusingpentahodataintegration-150719084339-lva1-app6892/75/Enhancing-educational-data-quality-in-heterogeneous-learning-contexts-using-pentaho-data-integration-26-2048.jpg)
![27
Why data quality?
Development of common language for data exchange (VII)
[LACE2013]
In our case?](https://image.slidesharecdn.com/enhancingeducationaldataqualityinheterogeneouslearningcontextsusingpentahodataintegration-150719084339-lva1-app6892/75/Enhancing-educational-data-quality-in-heterogeneous-learning-contexts-using-pentaho-data-integration-27-2048.jpg)
![30
Why data quality?
Meaning (II)
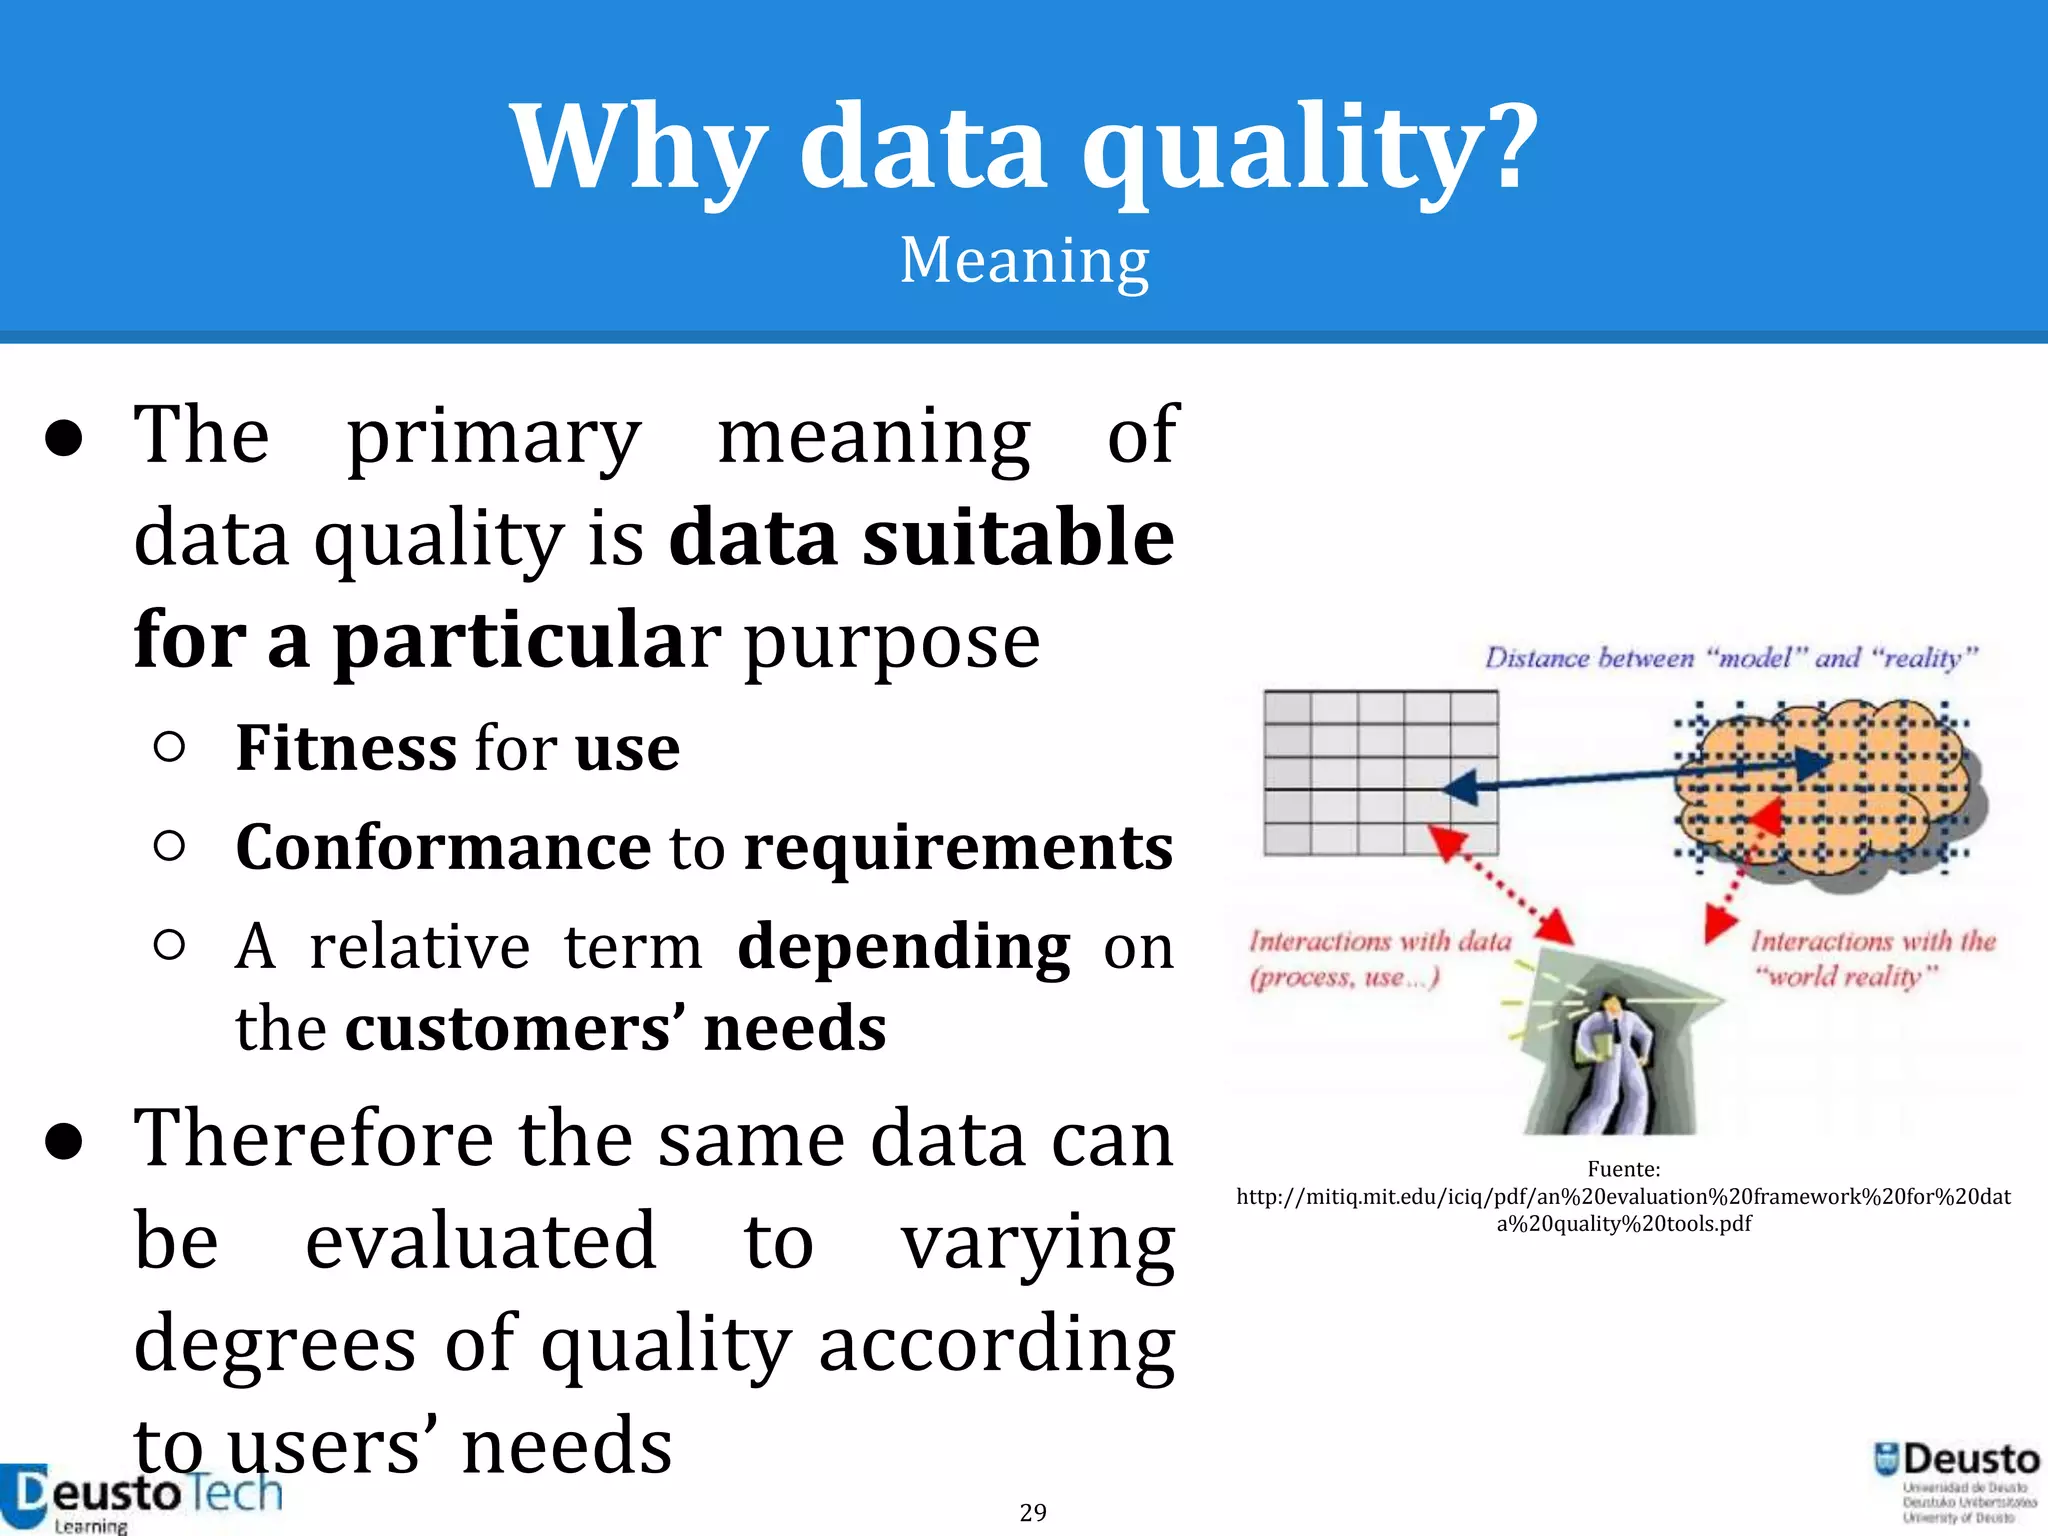
● How well the representation model lines up
with the reality of business processes in the
real world [Agosta2000]
● The different ways in which the project
leader, the end-user or the database
administrator evaluate data integrity
produces a large number of quality
dimensions](https://image.slidesharecdn.com/enhancingeducationaldataqualityinheterogeneouslearningcontextsusingpentahodataintegration-150719084339-lva1-app6892/75/Enhancing-educational-data-quality-in-heterogeneous-learning-contexts-using-pentaho-data-integration-30-2048.jpg)

![37
Data quality framework
Measuring data quality
● A vast number of bibliographic references
address the definition of criteria for
measuring data quality
● Criteria are usually classified into quality
dimensions
○ [Berti1999]
○ [Huang1998]
○ [Olson2003]
○ [Redman2001]
○ [Wang2006]](https://image.slidesharecdn.com/enhancingeducationaldataqualityinheterogeneouslearningcontextsusingpentahodataintegration-150719084339-lva1-app6892/75/Enhancing-educational-data-quality-in-heterogeneous-learning-contexts-using-pentaho-data-integration-37-2048.jpg)
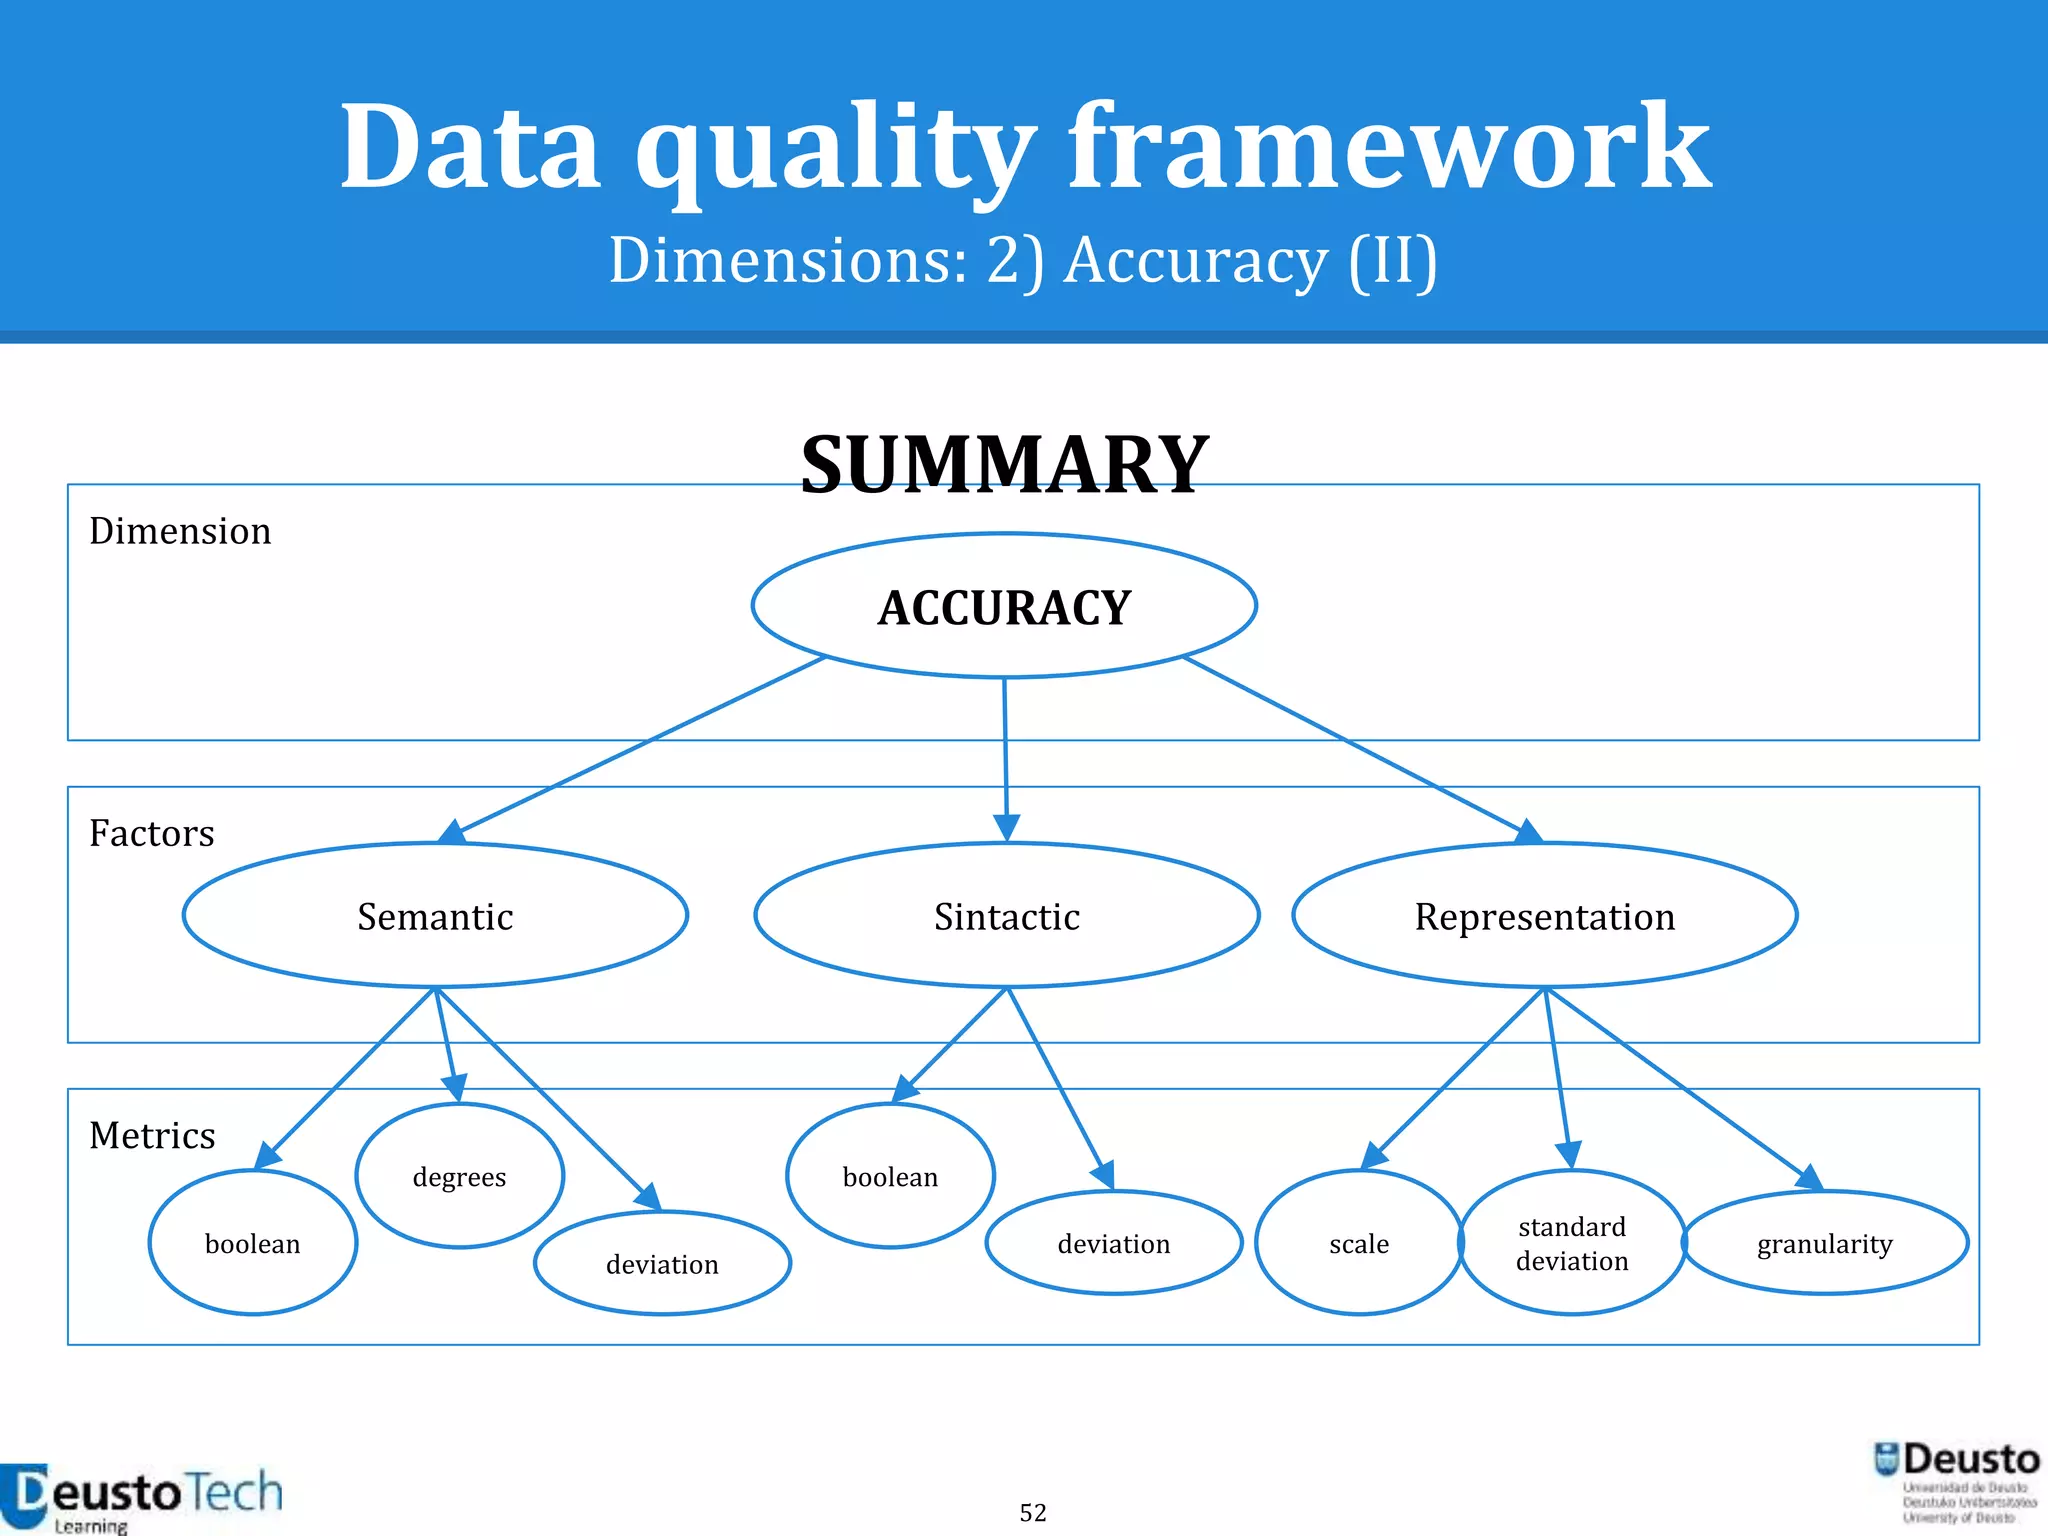
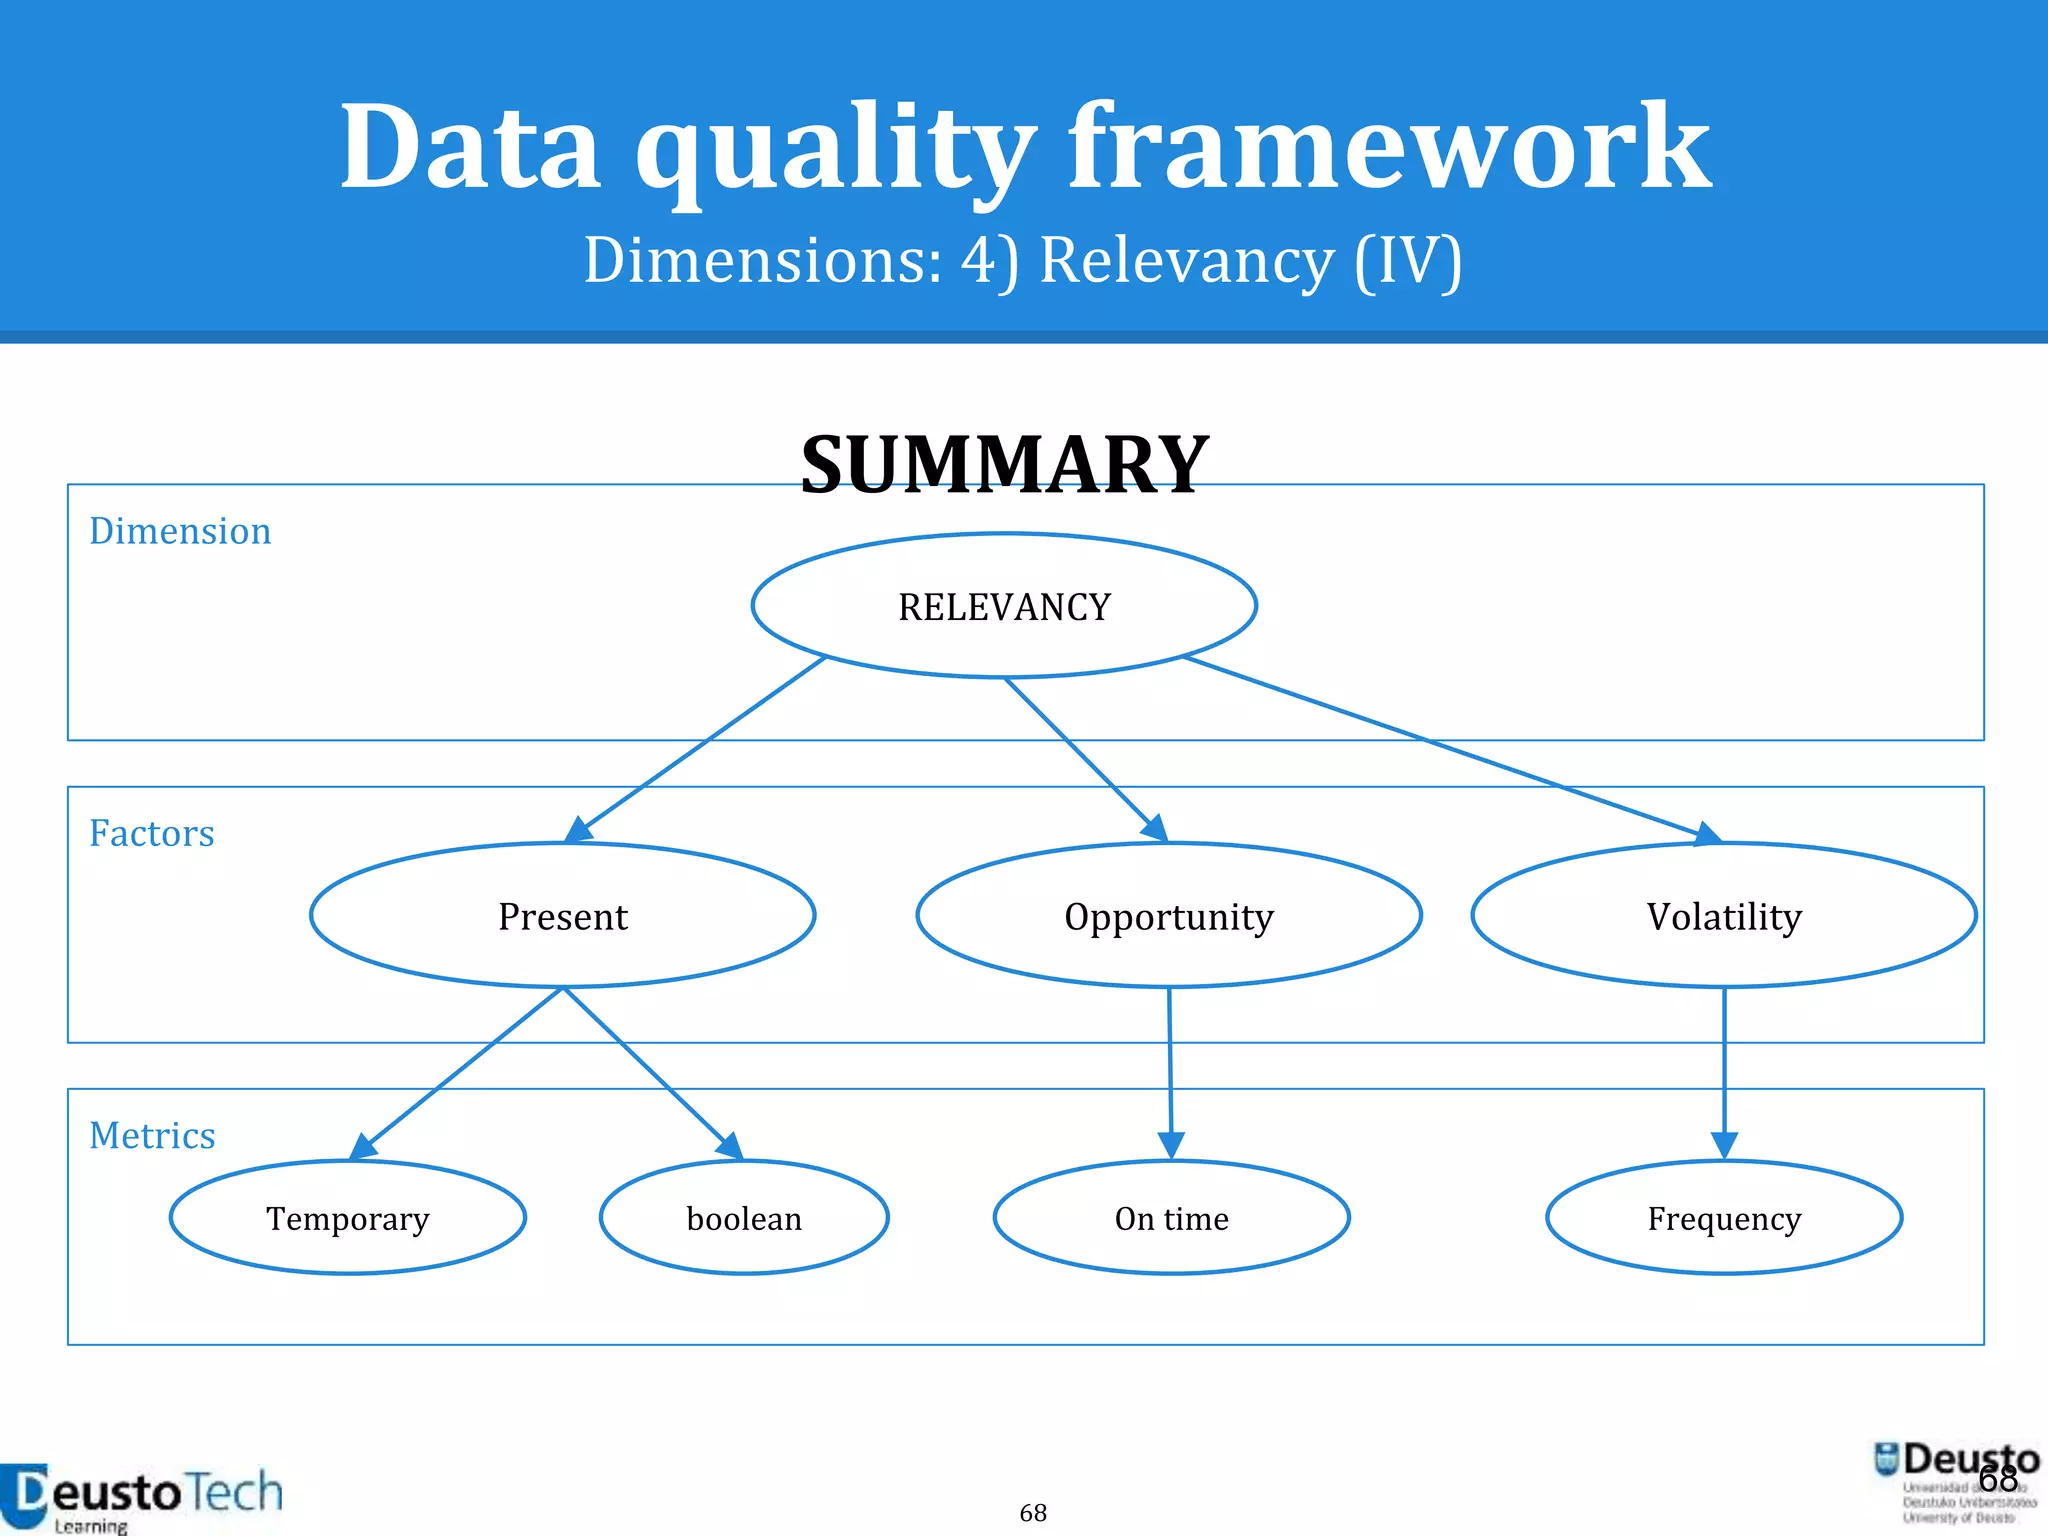
![39
Data quality framework
Dimensions
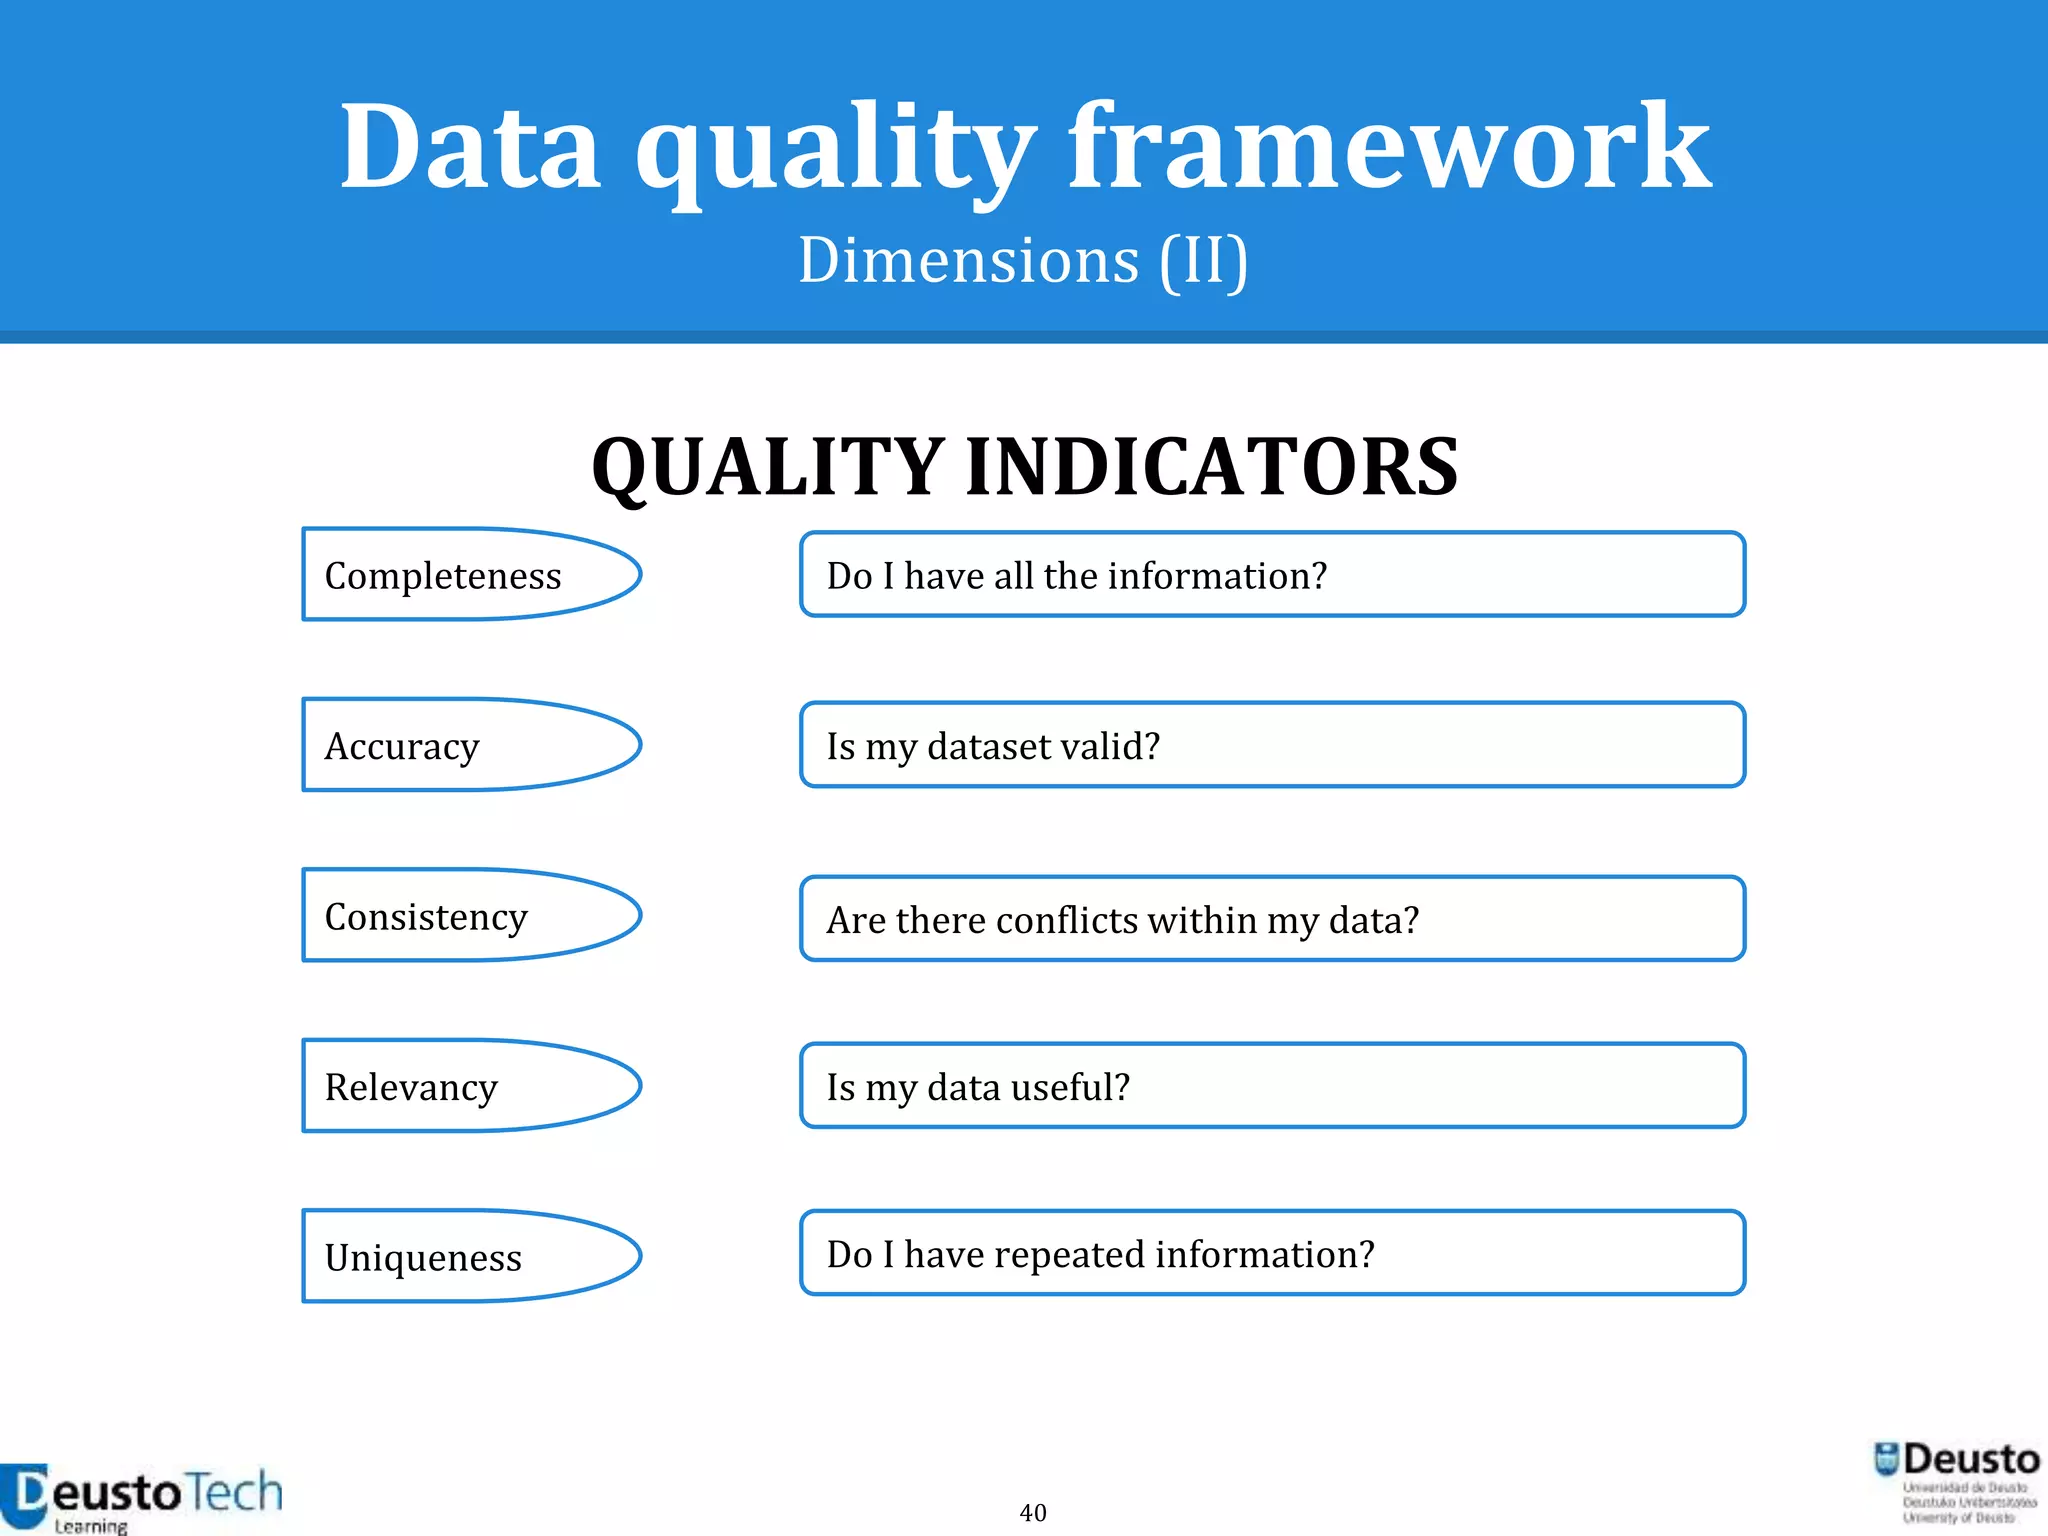
● A dimension captures a facet (at a high level)
of the quality
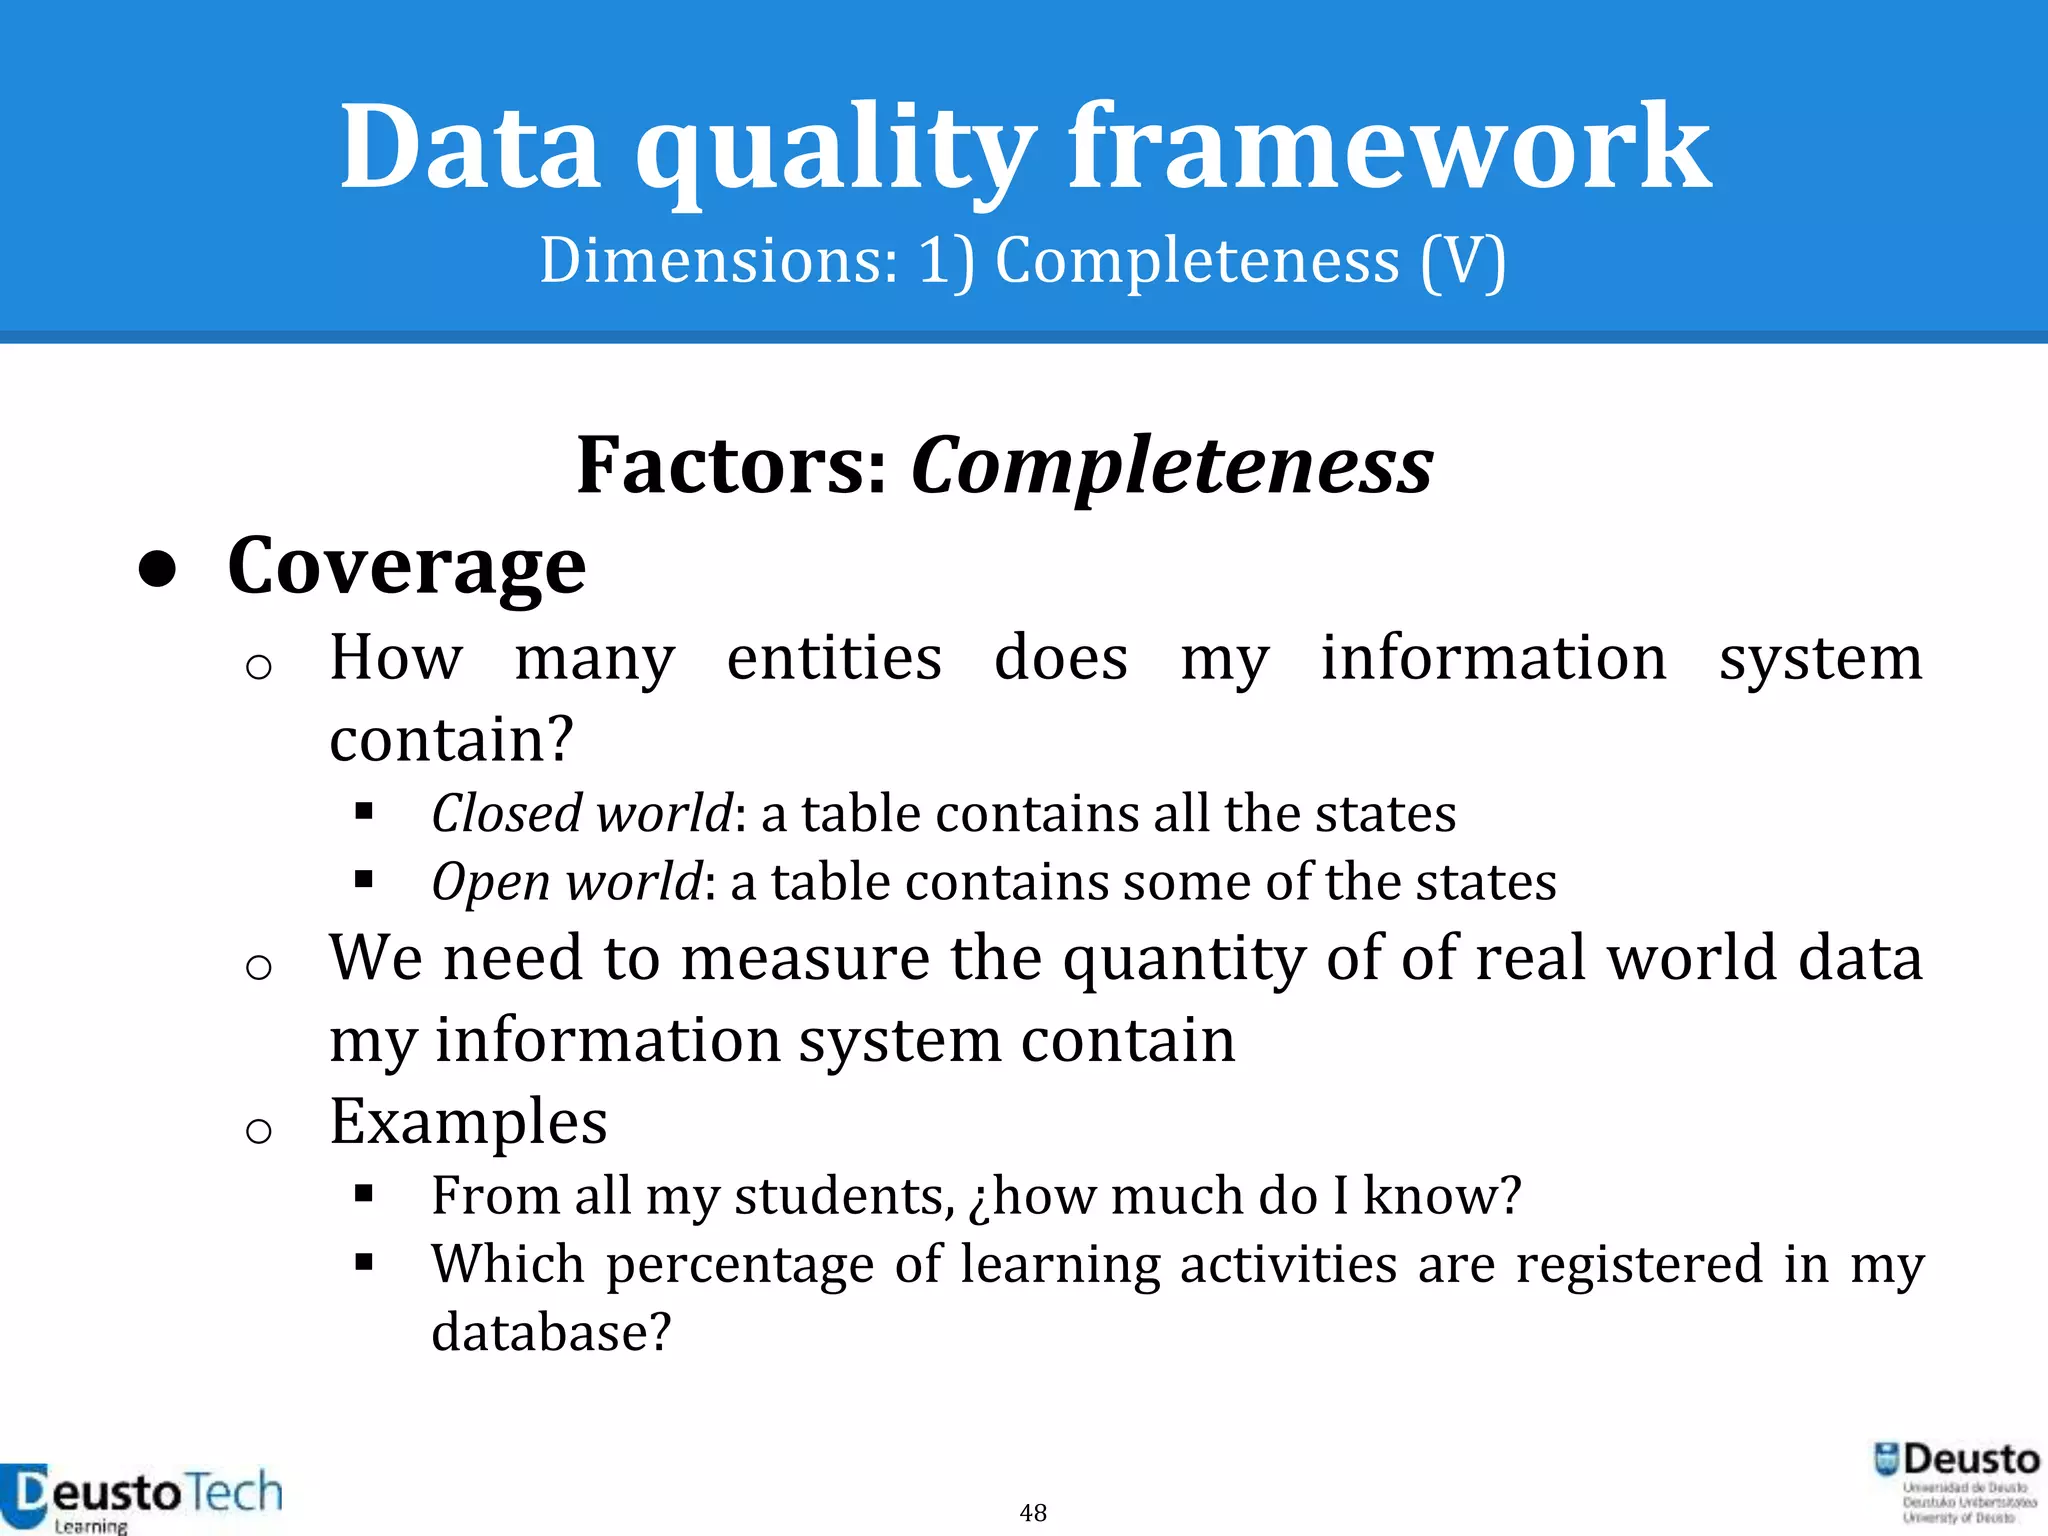
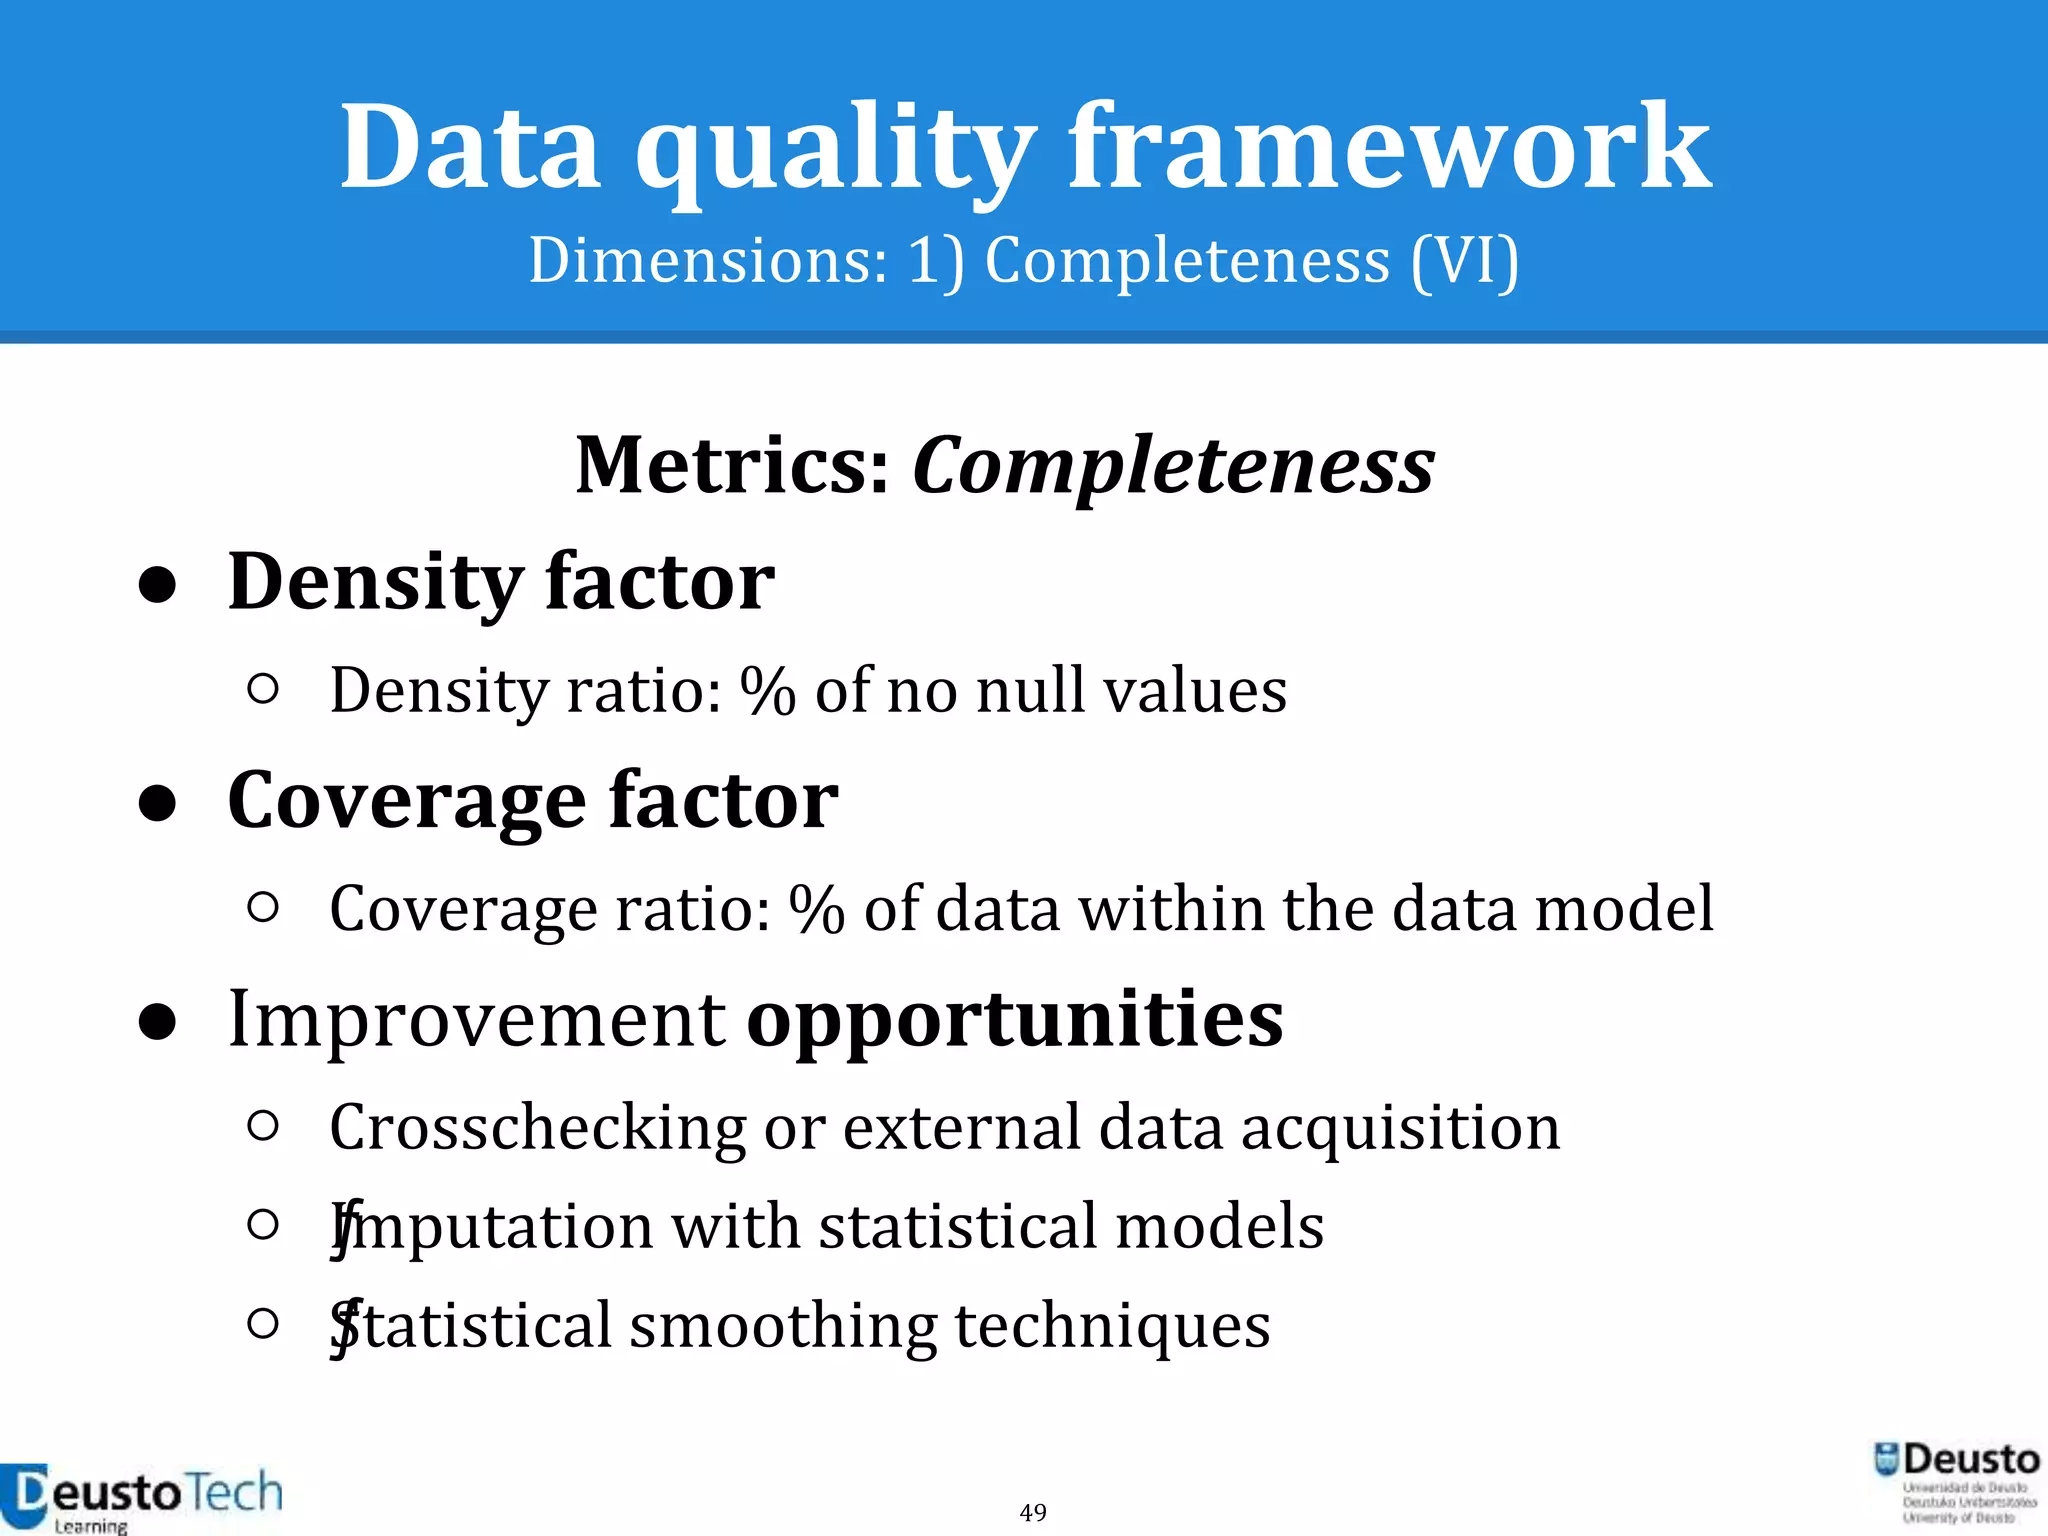
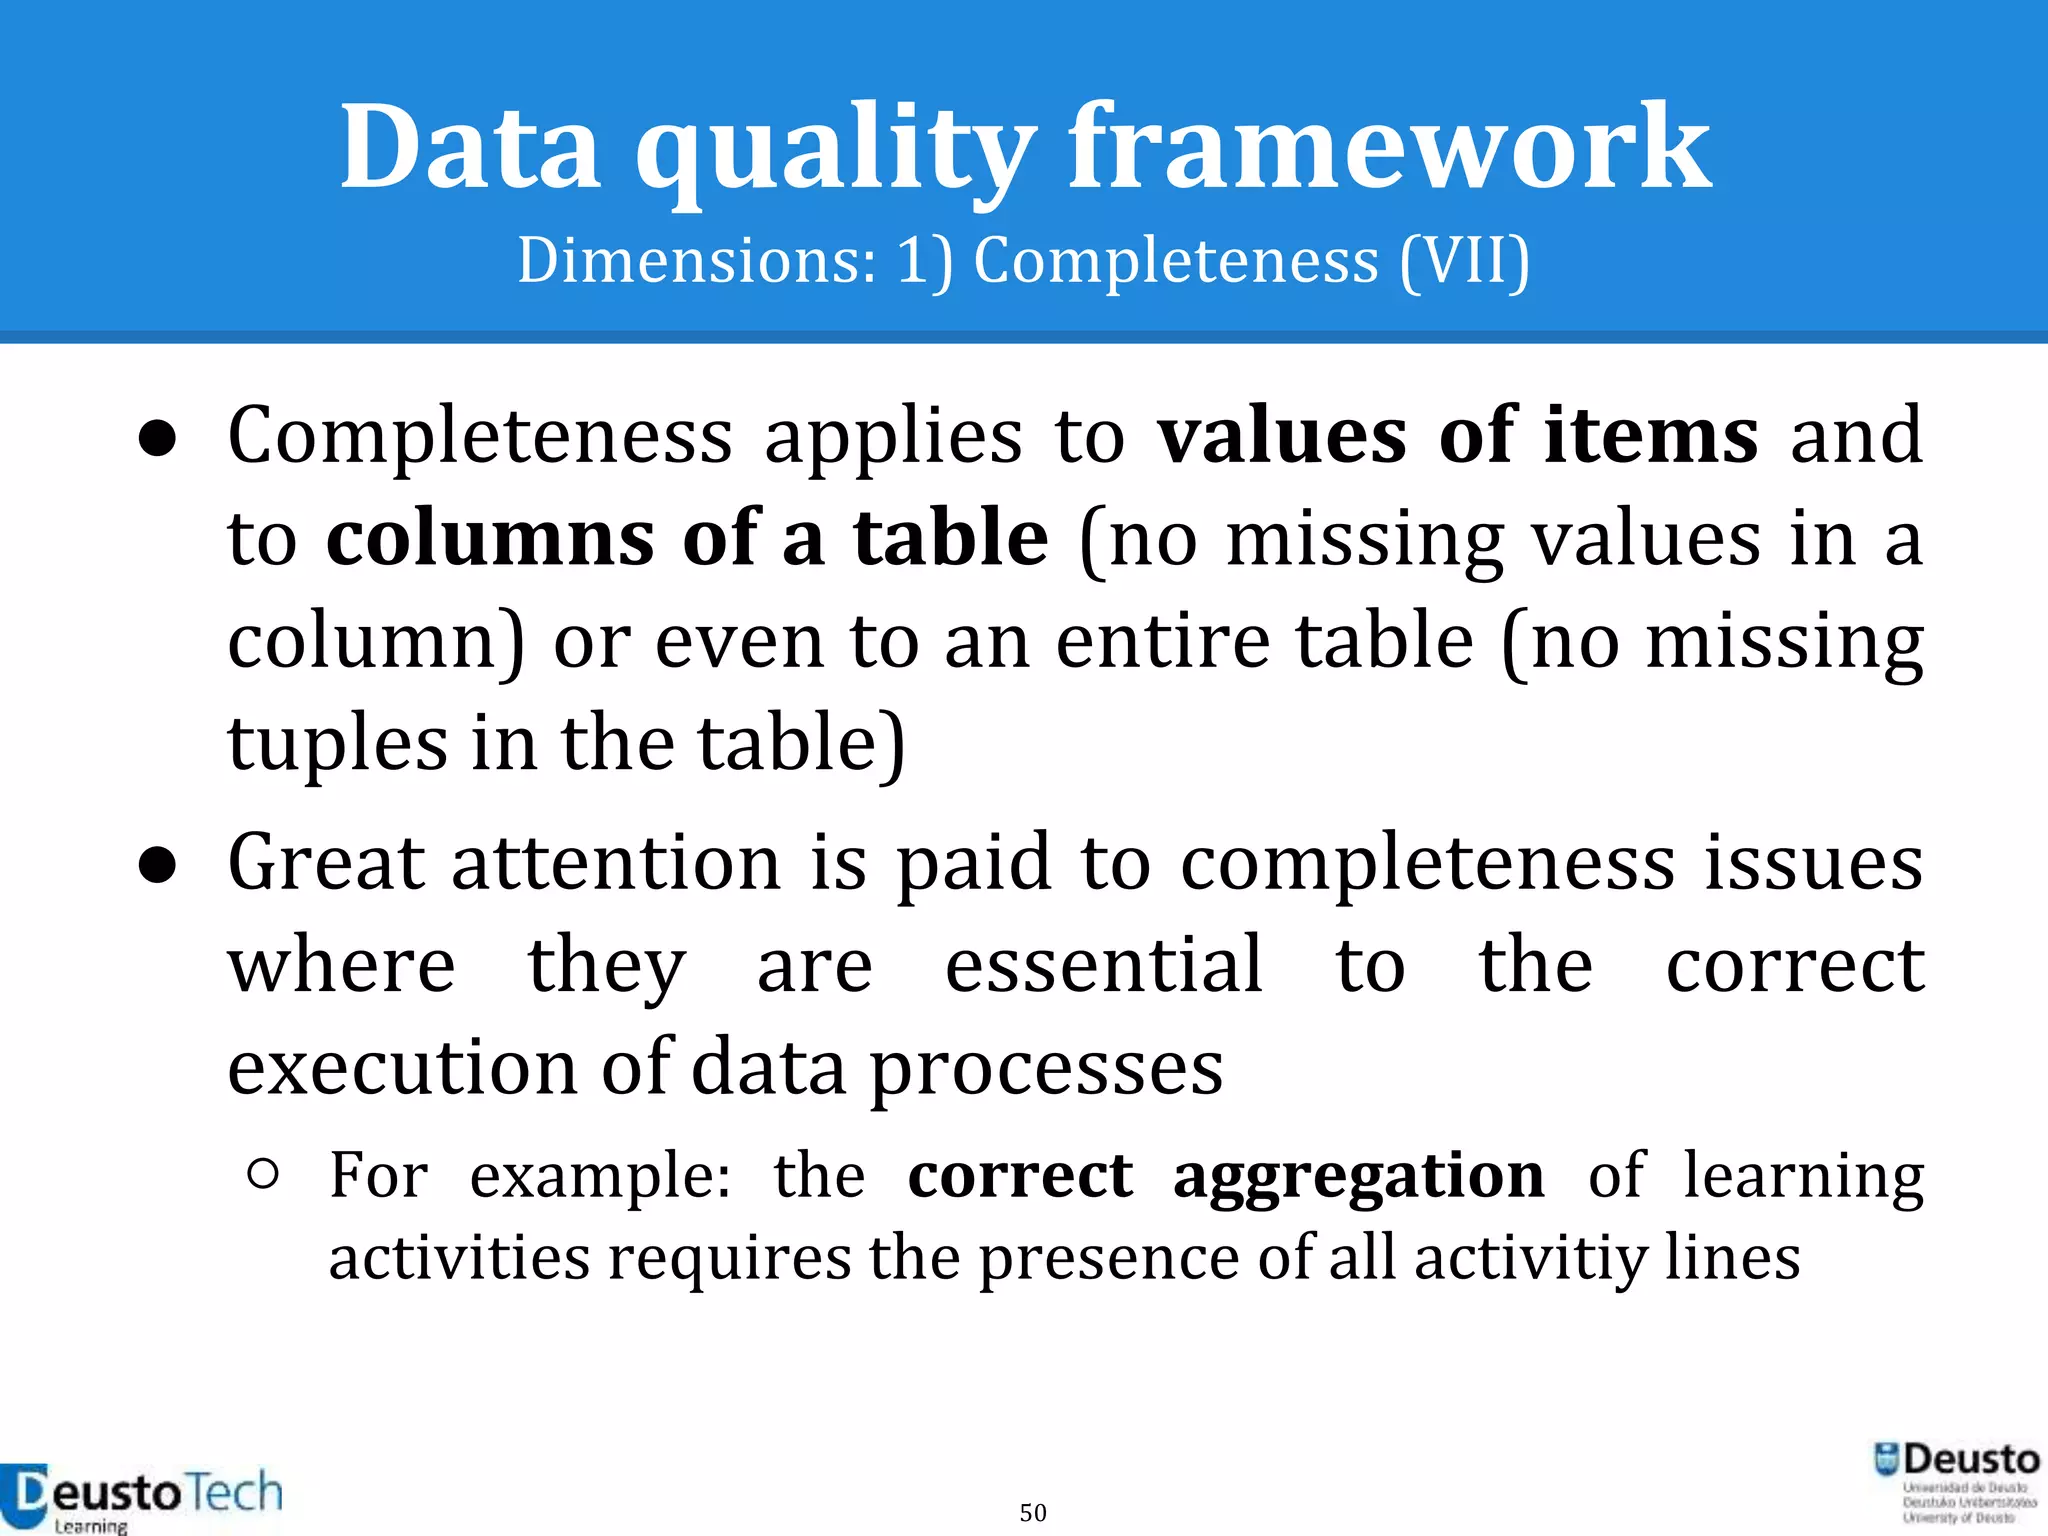
○ Completeness
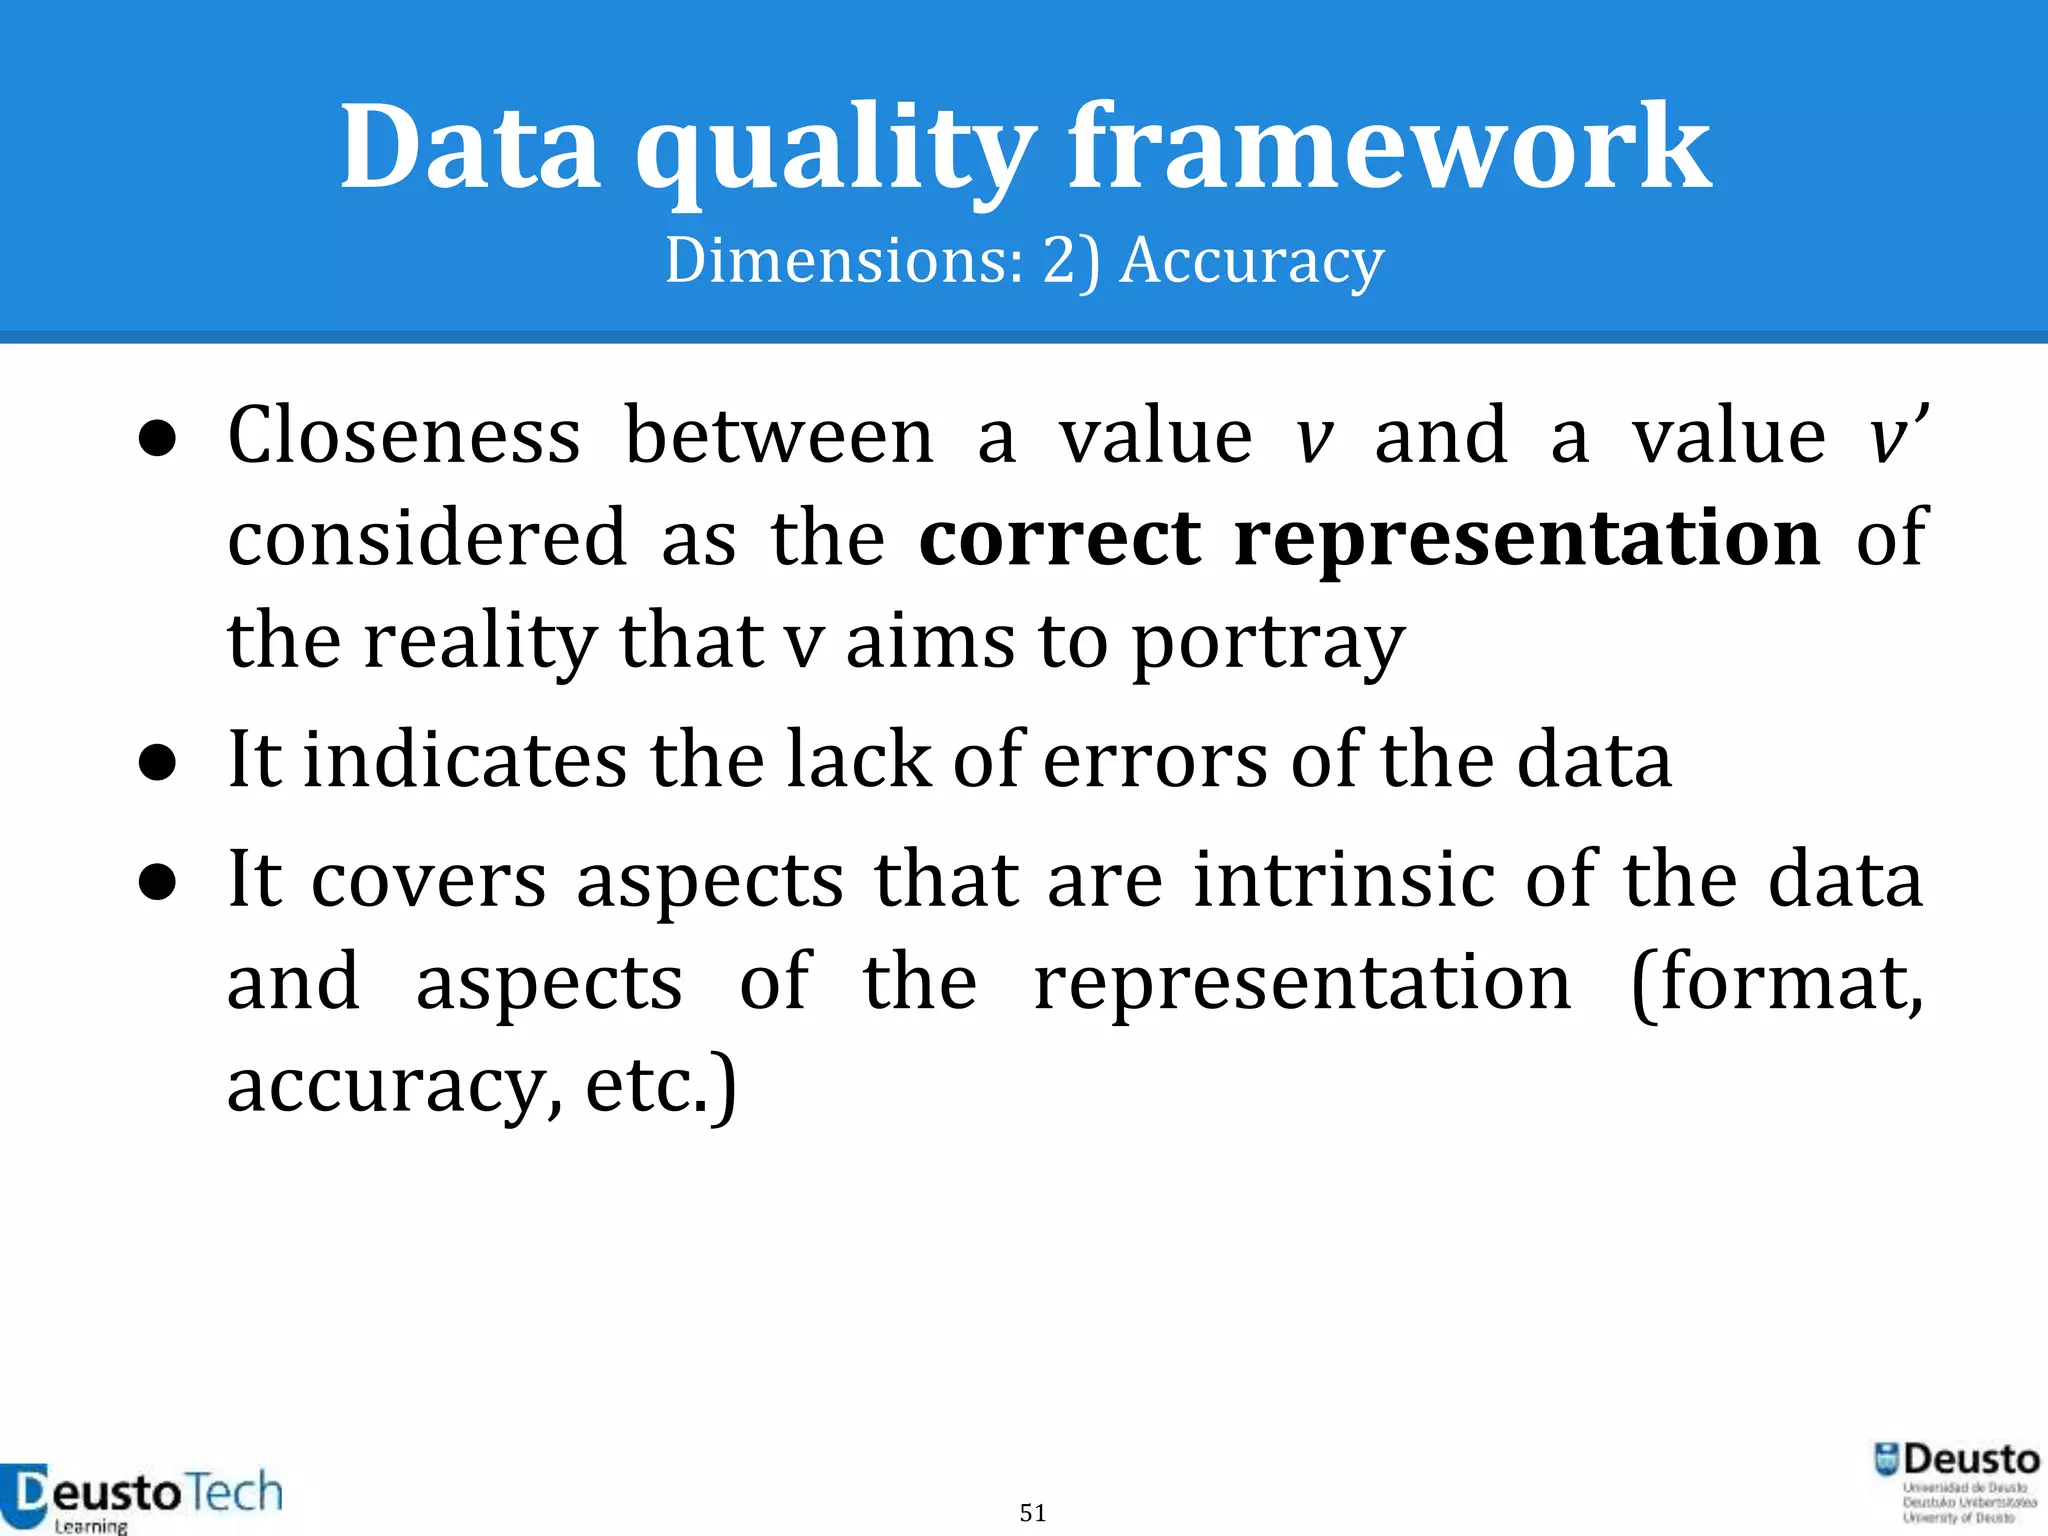
○ Accuracy
○ Consistency
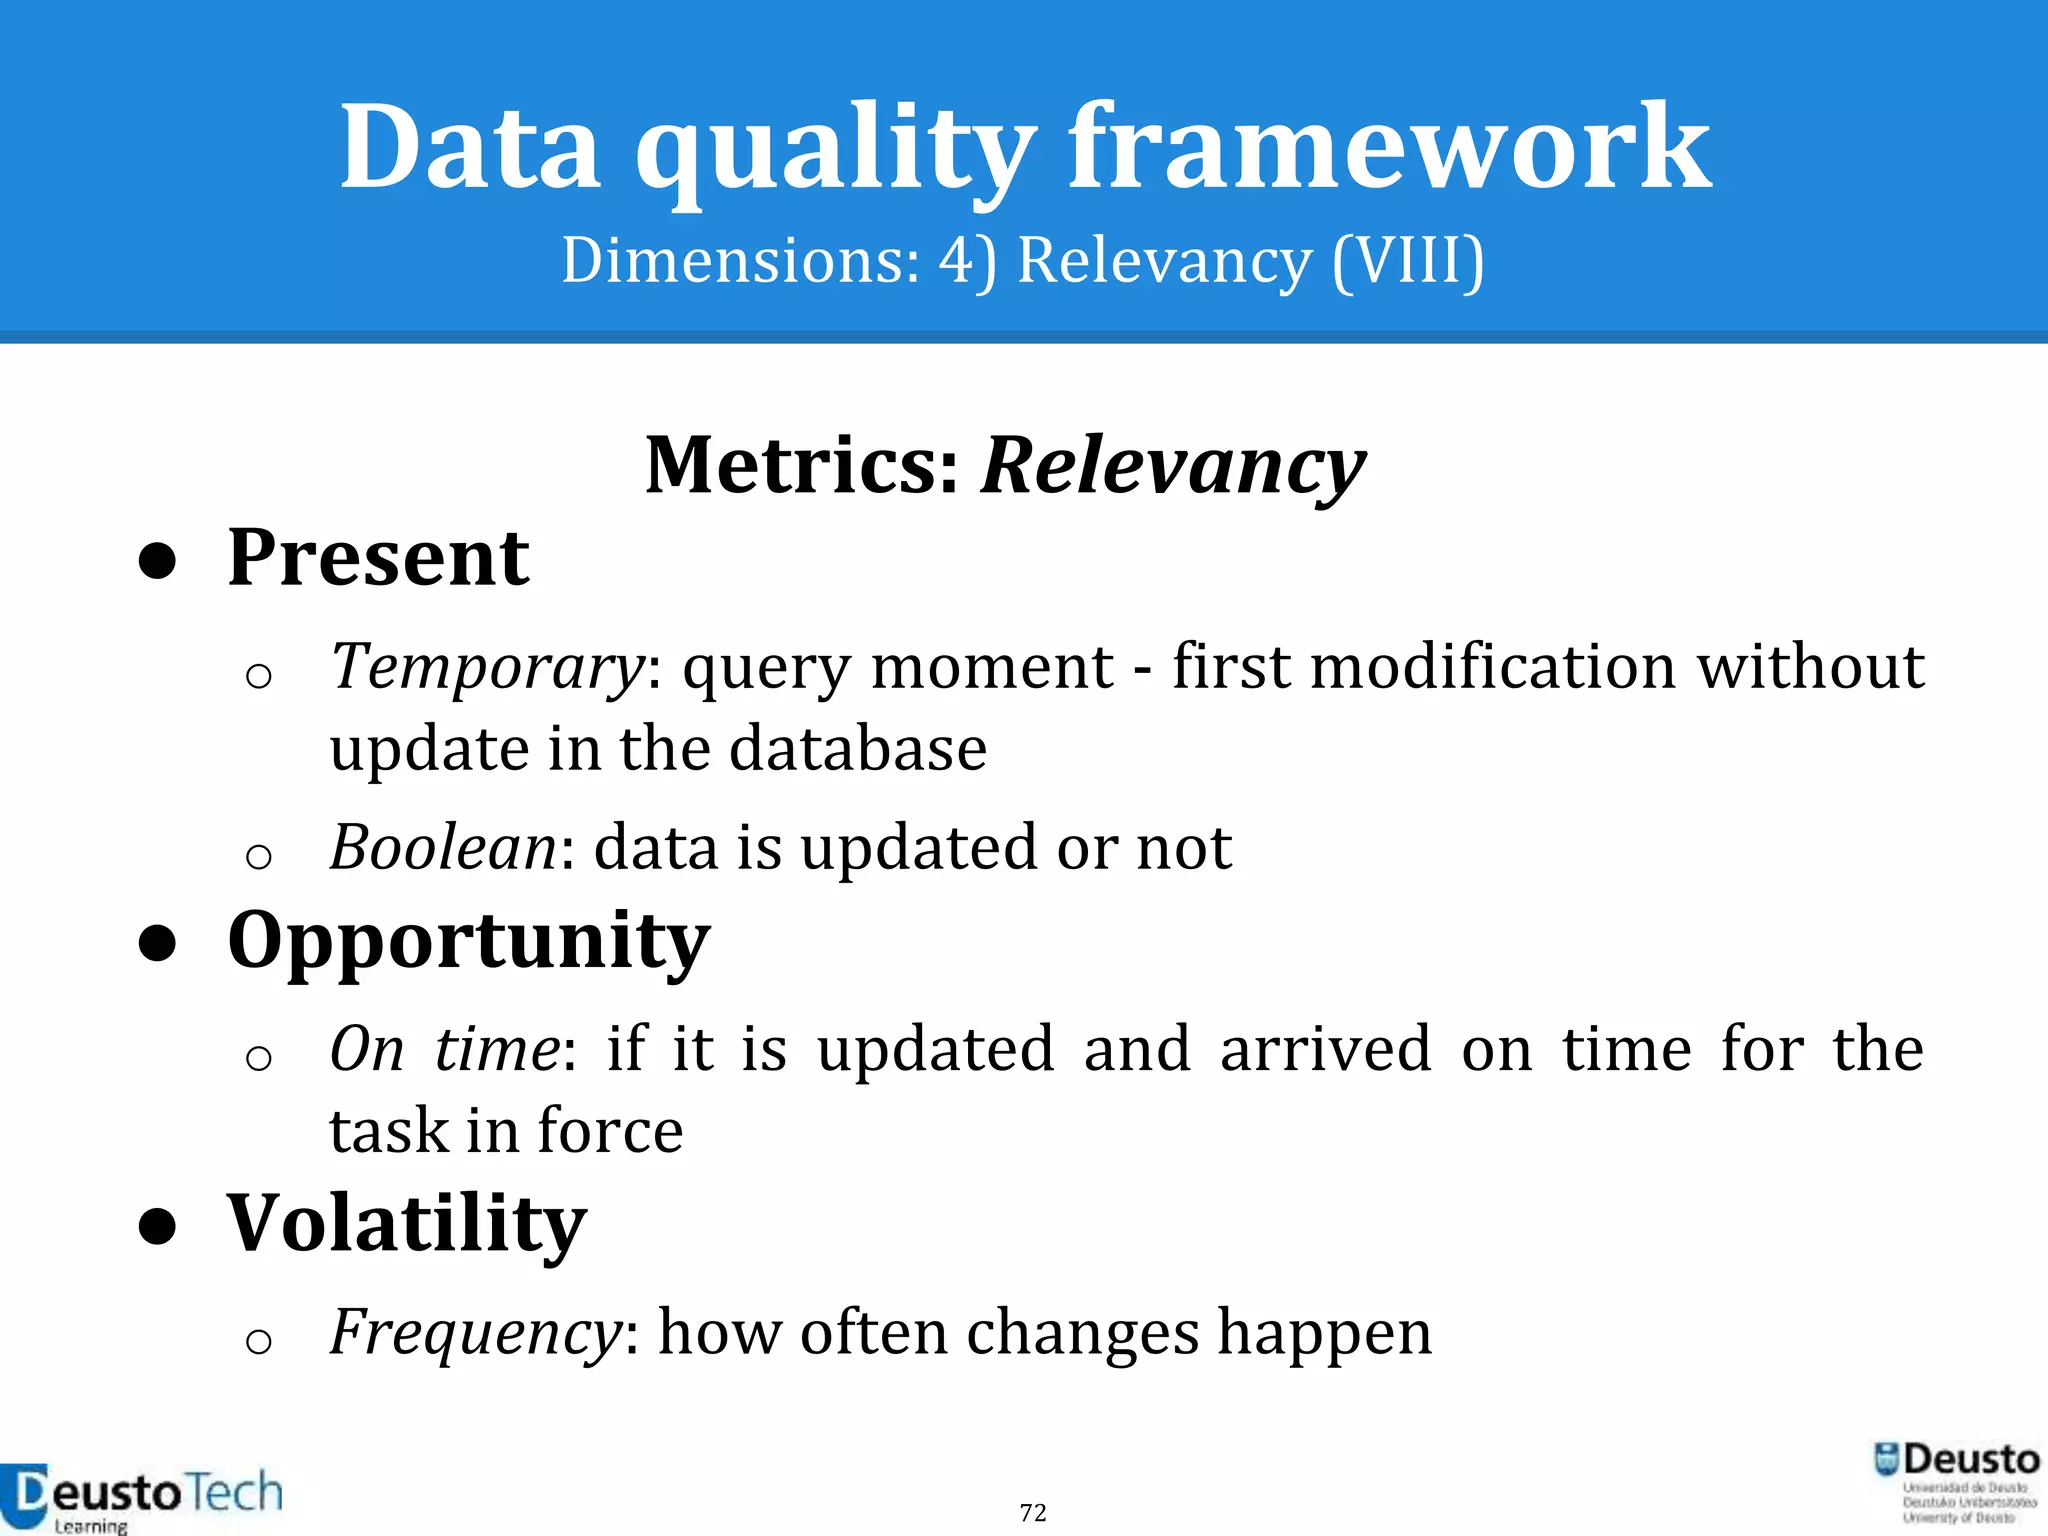
○ Relevancy
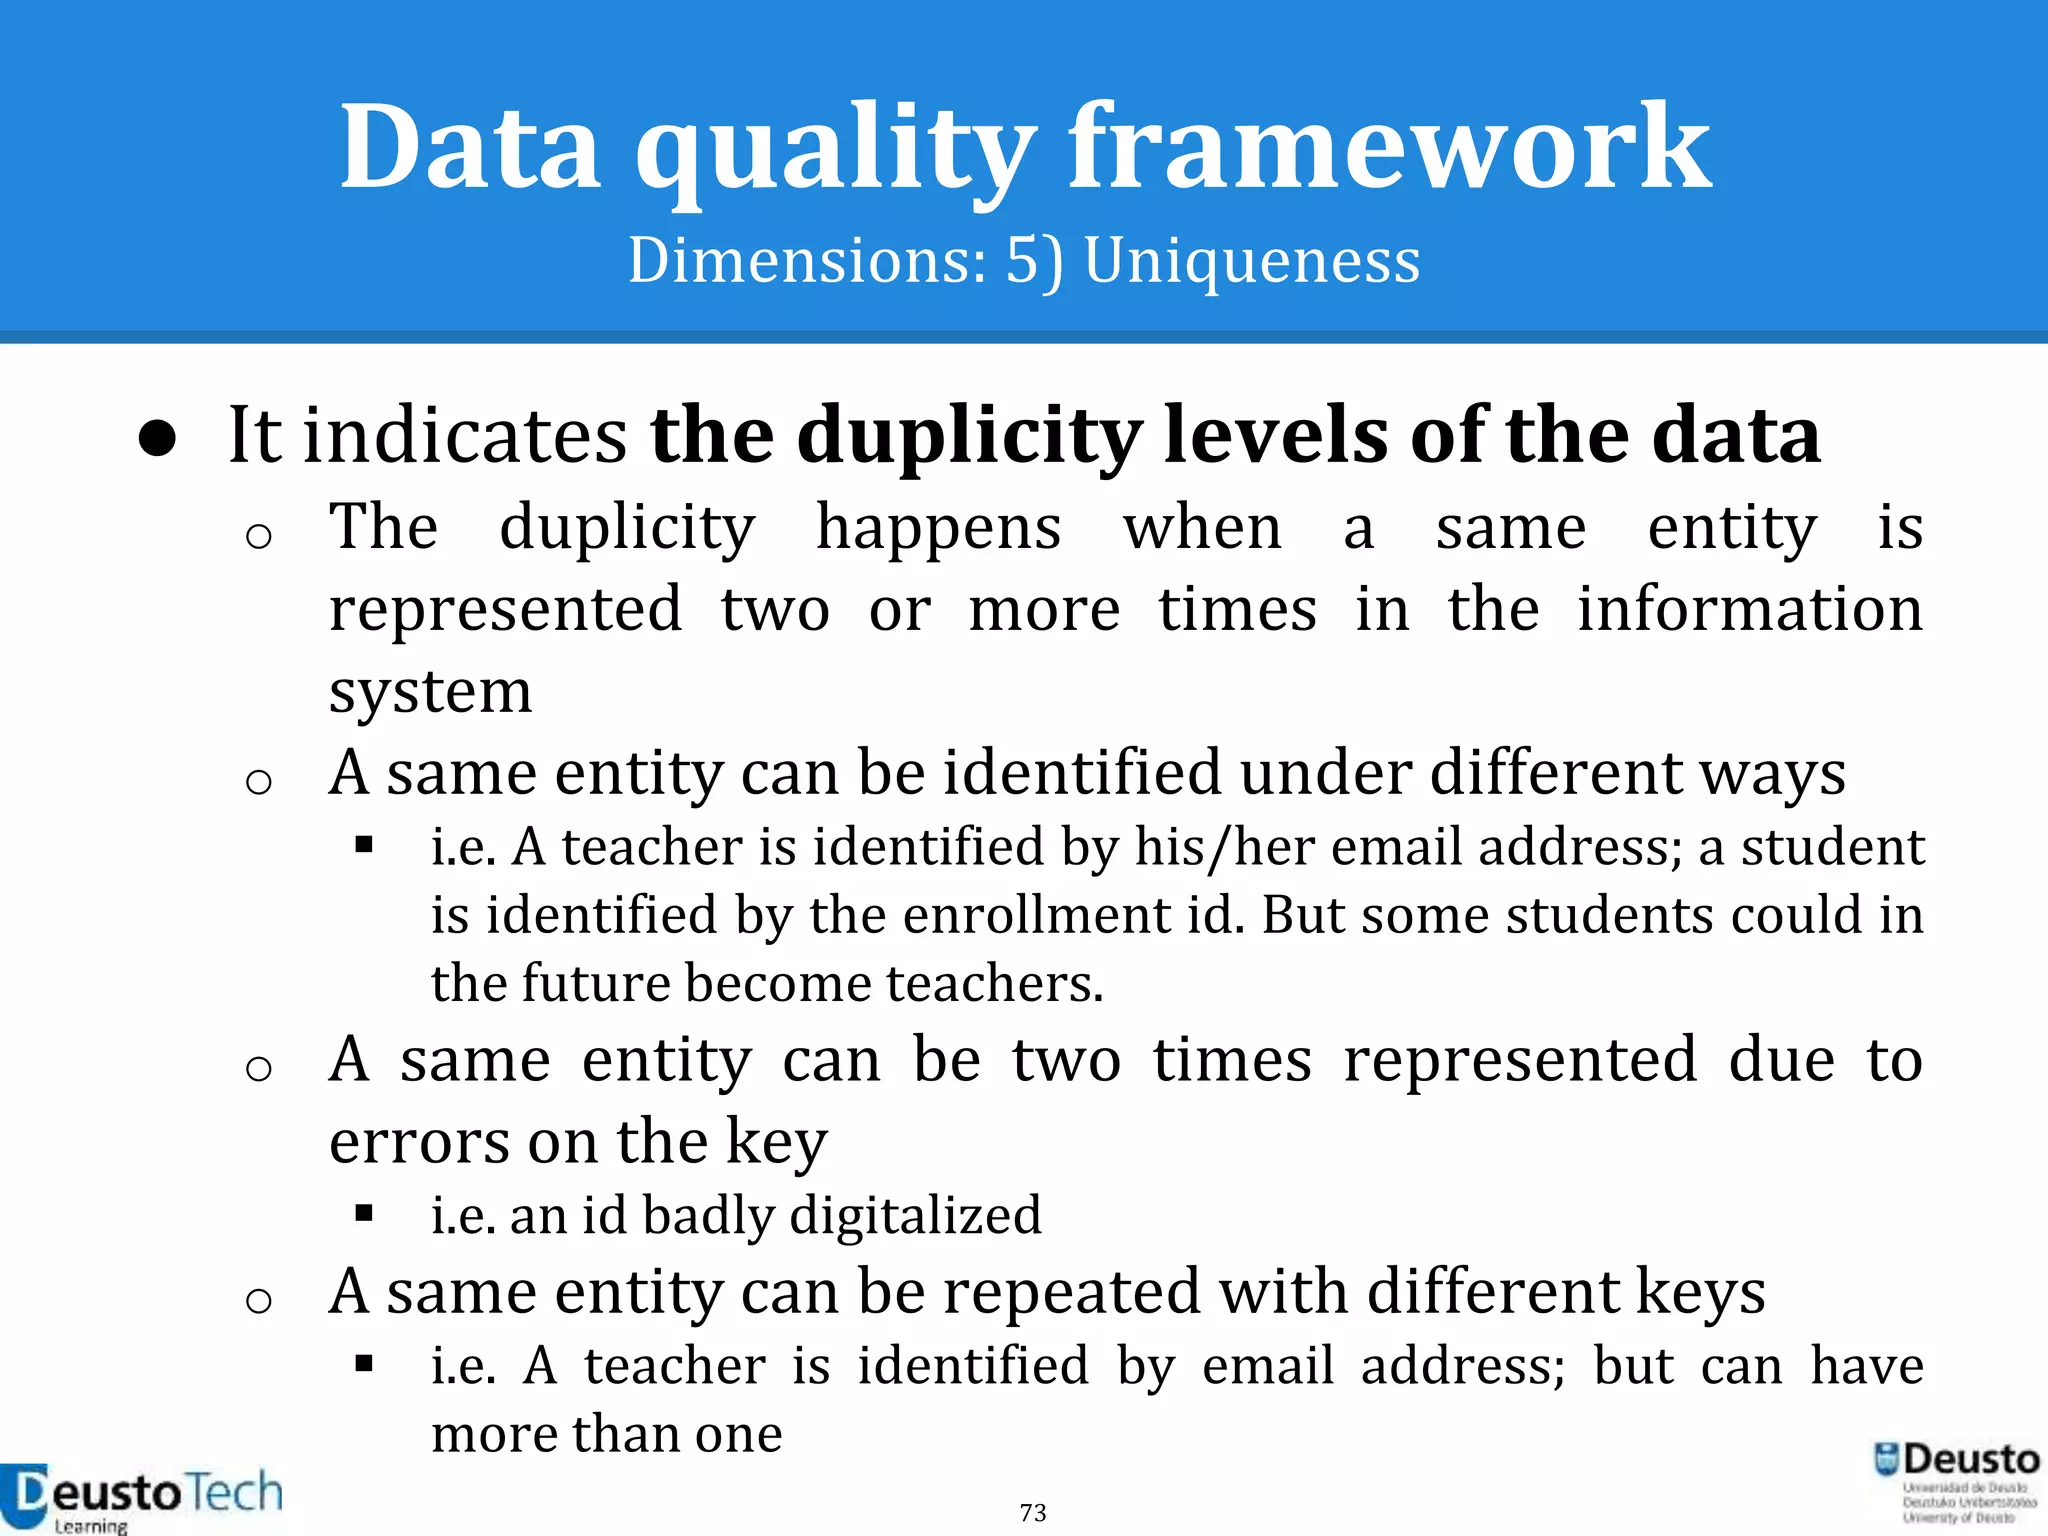
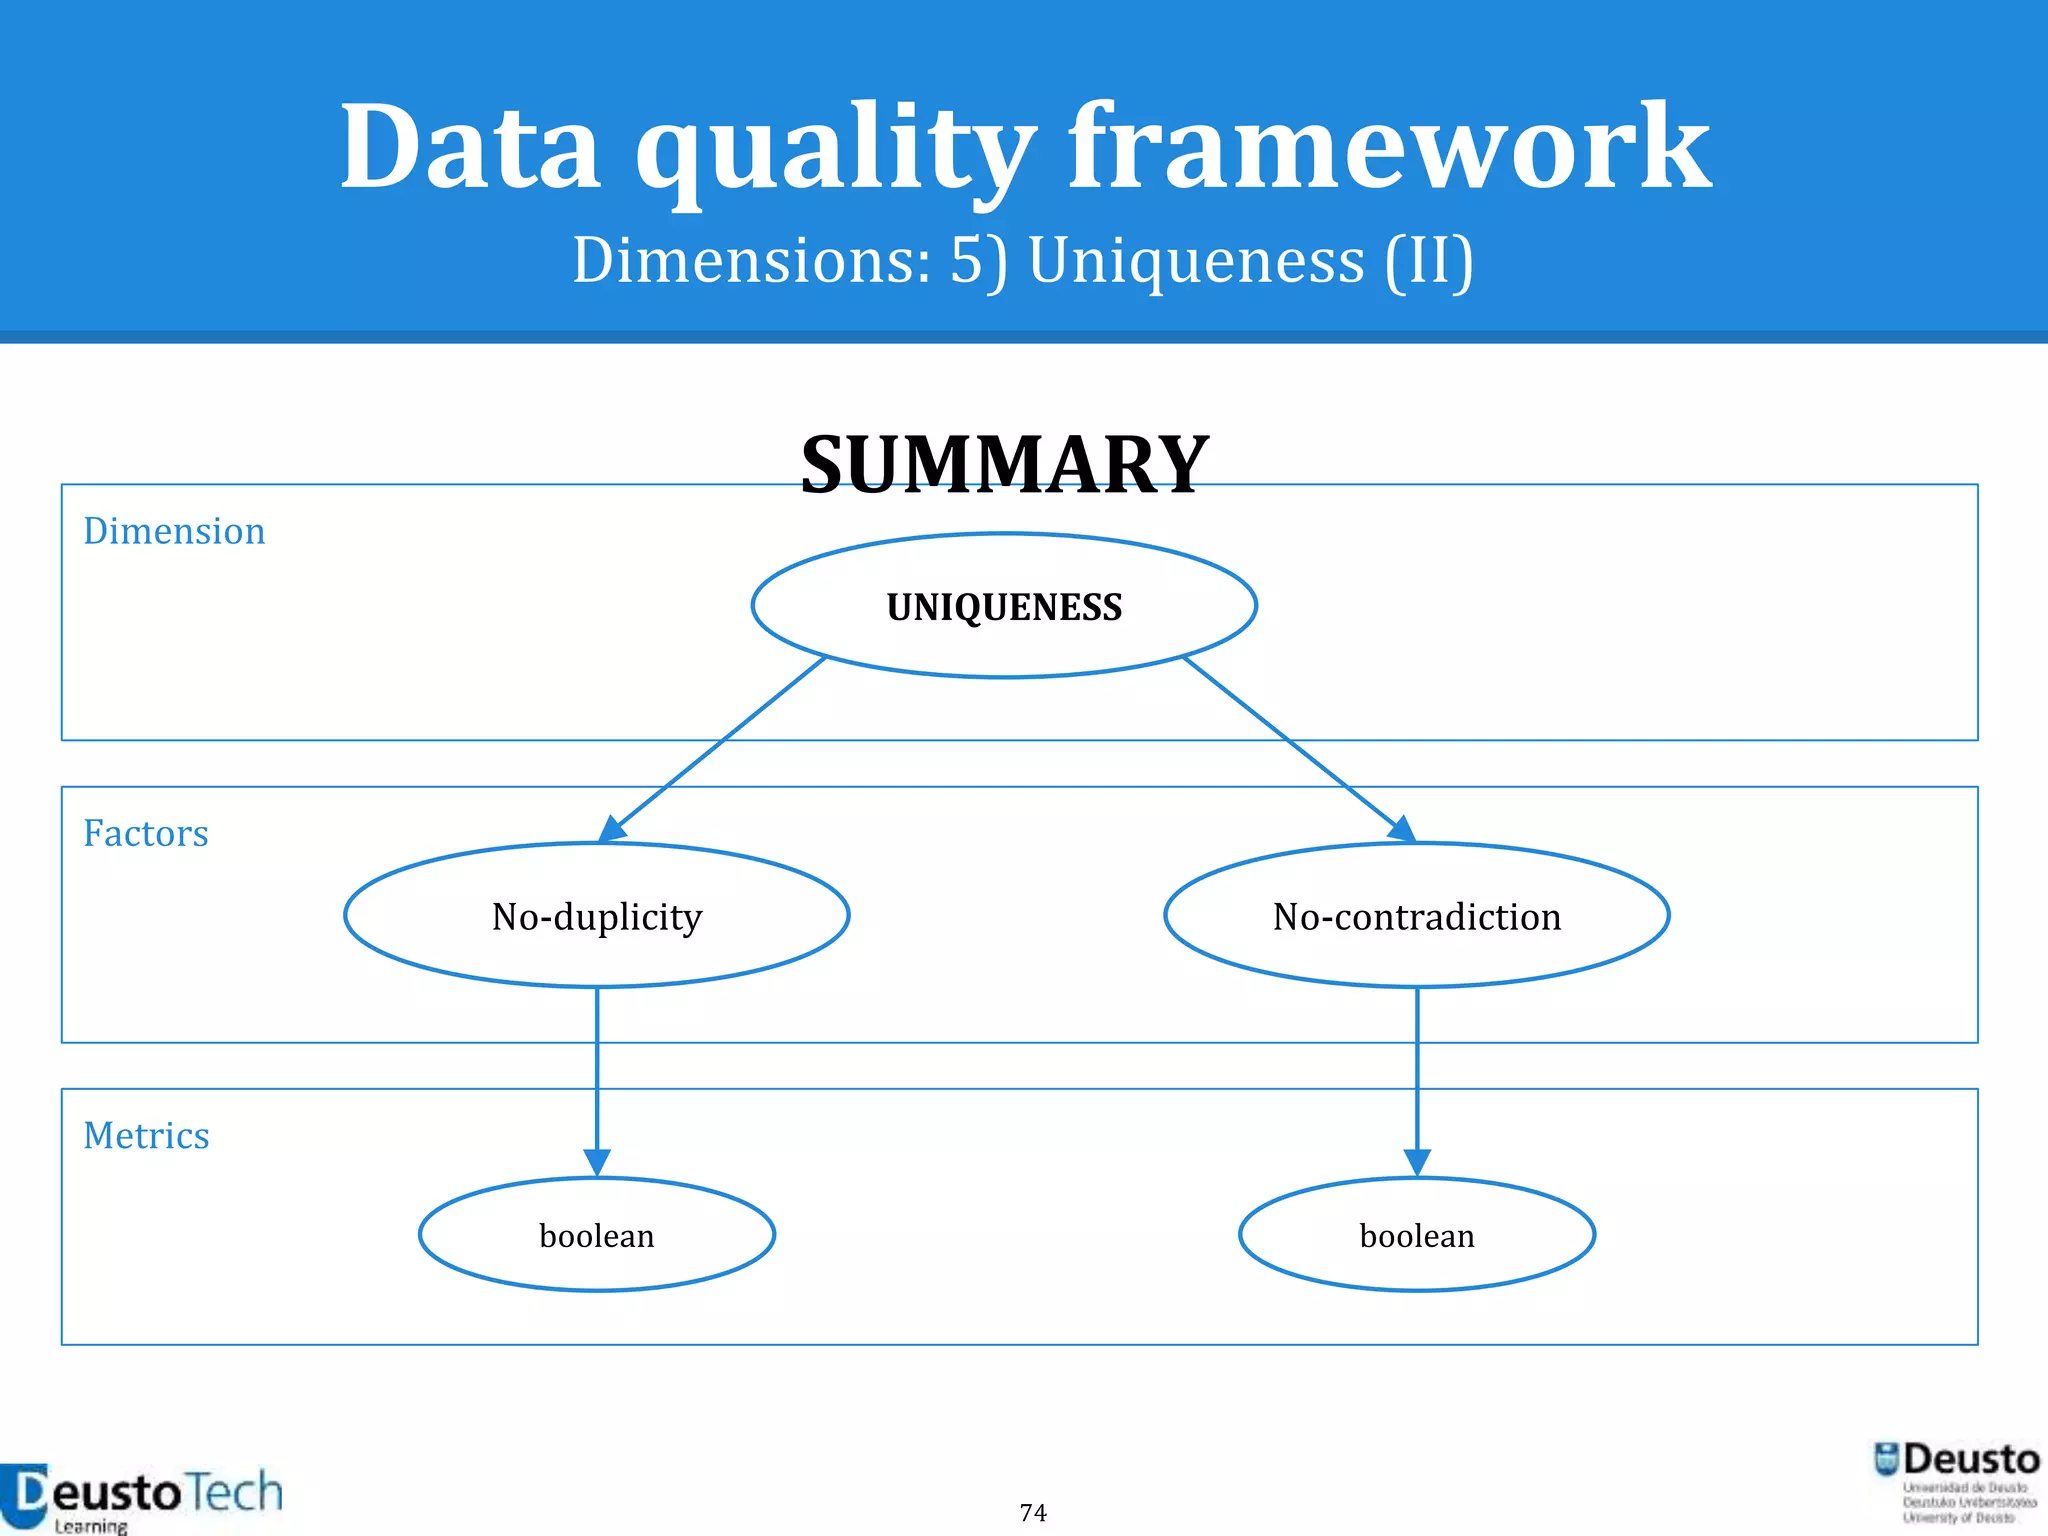
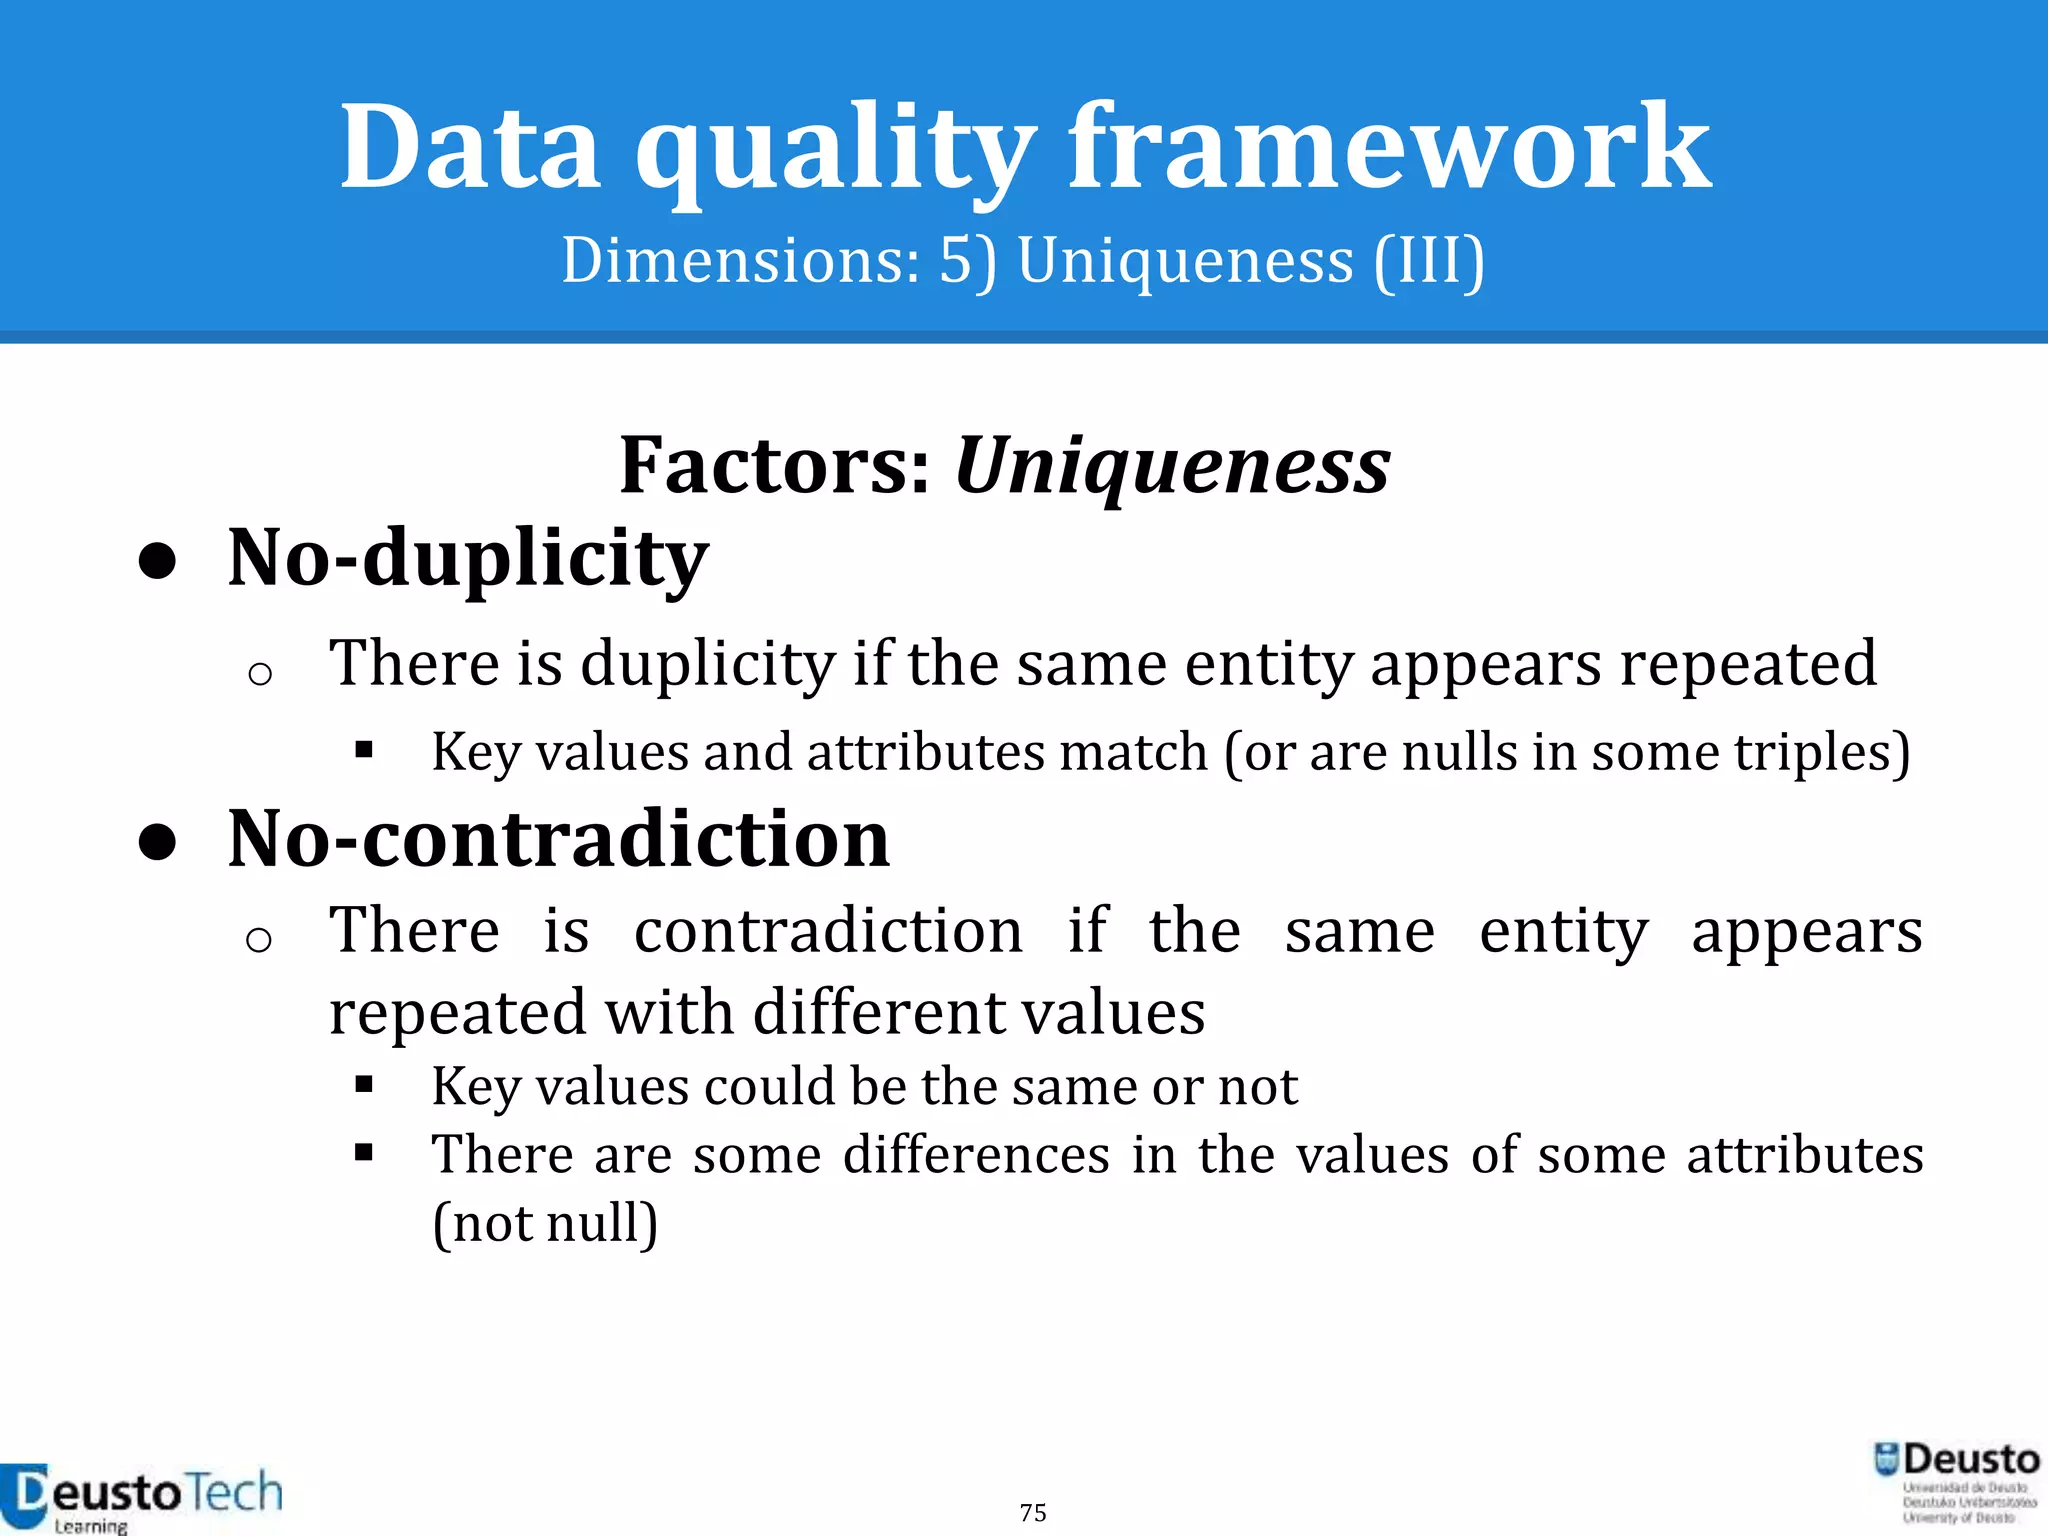
○ Uniqueness
[Goasdoué2007]](https://image.slidesharecdn.com/enhancingeducationaldataqualityinheterogeneouslearningcontextsusingpentahodataintegration-150719084339-lva1-app6892/75/Enhancing-educational-data-quality-in-heterogeneous-learning-contexts-using-pentaho-data-integration-39-2048.jpg)
![104
References
[CampbellOblinger2007] Campbell, John P., Peter B. DeBlois, and Diana G. Oblinger. "Academic analytics:
A new tool for a new era." Educause Review 42.4 (2007): 40.
[Clow2012] Clow, Doug. "The learning analytics cycle: closing the loop effectively." Proceedings of the 2nd
International Conference on Learning Analytics and Knowledge. ACM, 2012.
[Cooper2012] Cooper, Adam. "What is analytics? Definition and essential characteristics." CETIS Analytics
Series 1.5 (2012): 1-10.
[DA09] J. Dron and T. Anderson. On the design of collective applications. Proceedings of the 2009
International Conference on Computational Science and Engineering, 04:368–374, 2009.
[DronAnderson2009] Dron, J., & Anderson, T. (2009). On the design of collective applications. In
Proceedings of the 2009 International Conference on Computational Science and Engineering, 4, 368–374.
[Dyckhoff2010] Dyckhoff, Anna Lea, et al. "Design and Implementation of a Learning Analytics Toolkit for
Teachers." Educational Technology & Society 15.3 (2012): 58-76.
[Eaton2012] Chris Eaton, Dirk Deroos, Tom Deutsch, George Lapis & Paul Zikopoulos, “Understanding Big
Data: Analytics for Enterprise Class Hadoop and Streaming Data”, p.XV. McGraw-Hill, 2012.
[Eli11] Tanya Elias. Learning analytics: definitions, processes and potential. 2011.
[GayPryke2002] Cultural Economy: Cultural Analysis and Commercial Life (Culture, Representation and
Identity series) Paul du Gay (Editor), Michael Pryke. 2002.](https://image.slidesharecdn.com/enhancingeducationaldataqualityinheterogeneouslearningcontextsusingpentahodataintegration-150719084339-lva1-app6892/75/Enhancing-educational-data-quality-in-heterogeneous-learning-contexts-using-pentaho-data-integration-104-2048.jpg)
![105
References (II)
[HR2012] NMC Horizon Report 2012 http://www.nmc.org/publications/horizon-report-2012-higher-ed-
edition
[Jenkins2013] BBC Radio 4, Start the Week, Big Data and Analytics, first broadcast 11 February 2013
http://www.bbc.co.uk/programmes/b01qhqfv
[Khan2012] http://www.emergingedtech.com/2012/04/exploring-the-khan-academys-use-of-learning-
data-and-learning-analytics/
[LACE2013] Learning Analytics Community Exchange http://www.laceproject.eu/
[LAK2011] 1st International Conference on Learning Analytics and Knowledge, 27 February - 1 March
2011, Banff, Alberta, Canada https://tekri.athabascau.ca/analytics/
[Mazza2006] Mazza, Riccardo, et al. "MOCLog–Monitoring Online Courses with log data." Proceedings of
the 1st Moodle Research Conference. 2012.
[Mazza2012] Riccardo Mazza, Marco Bettoni, Marco Far ́, and Luca Mazezola. Moclog–monitoring online
courses with log data. 2012.
[Reinmann2006] Reinmann, G. (2006). Understanding e-learning: an opportunity for Europe? European
Journal of Vocational Training, 38, 27-42.
[SiemensBaker2012] Siemens & Baker (2012). Learning Analytics and Educational Data Mining: Towards
Communication and Collaboration. Learning Analytics and Knowledge 2012. Available in .pdf format at
http://users.wpi.edu/~rsbaker/LAKs%20reformatting%20v2.pdf](https://image.slidesharecdn.com/enhancingeducationaldataqualityinheterogeneouslearningcontextsusingpentahodataintegration-150719084339-lva1-app6892/75/Enhancing-educational-data-quality-in-heterogeneous-learning-contexts-using-pentaho-data-integration-105-2048.jpg)

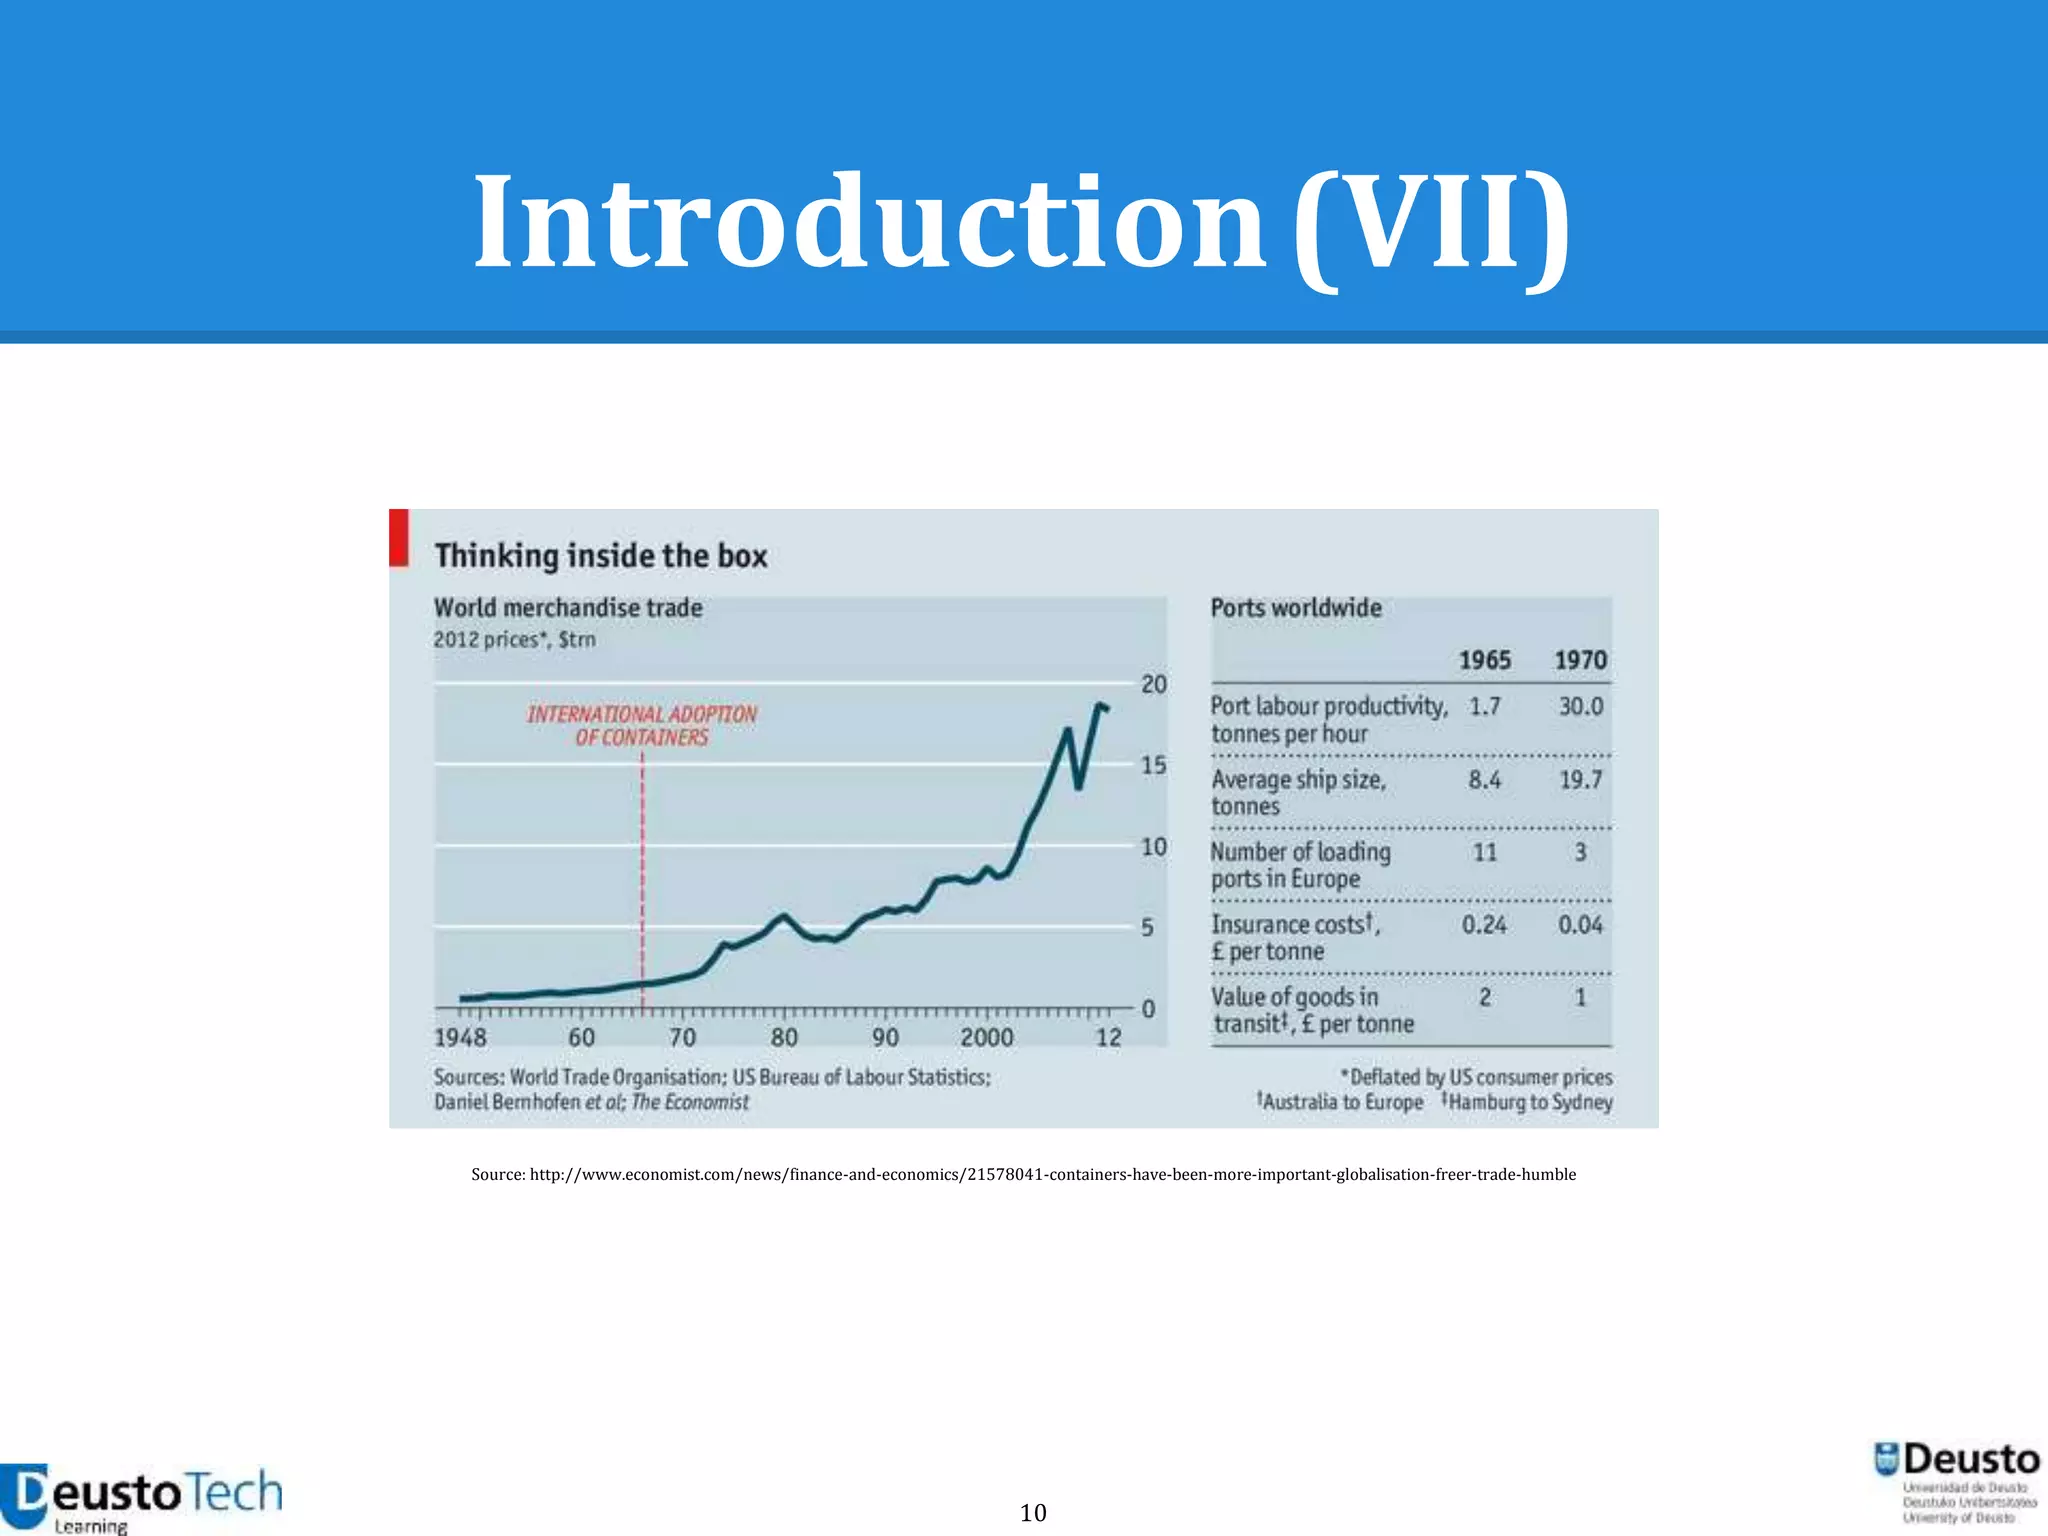
The document discusses the importance of data quality in educational contexts, highlighting challenges and frameworks for managing data lifecycle and quality. It emphasizes the need for interoperability, common language for data exchange, and various dimensions of data quality such as completeness, accuracy, and relevancy. It also outlines measurement metrics and methods to assess data quality effectively.


