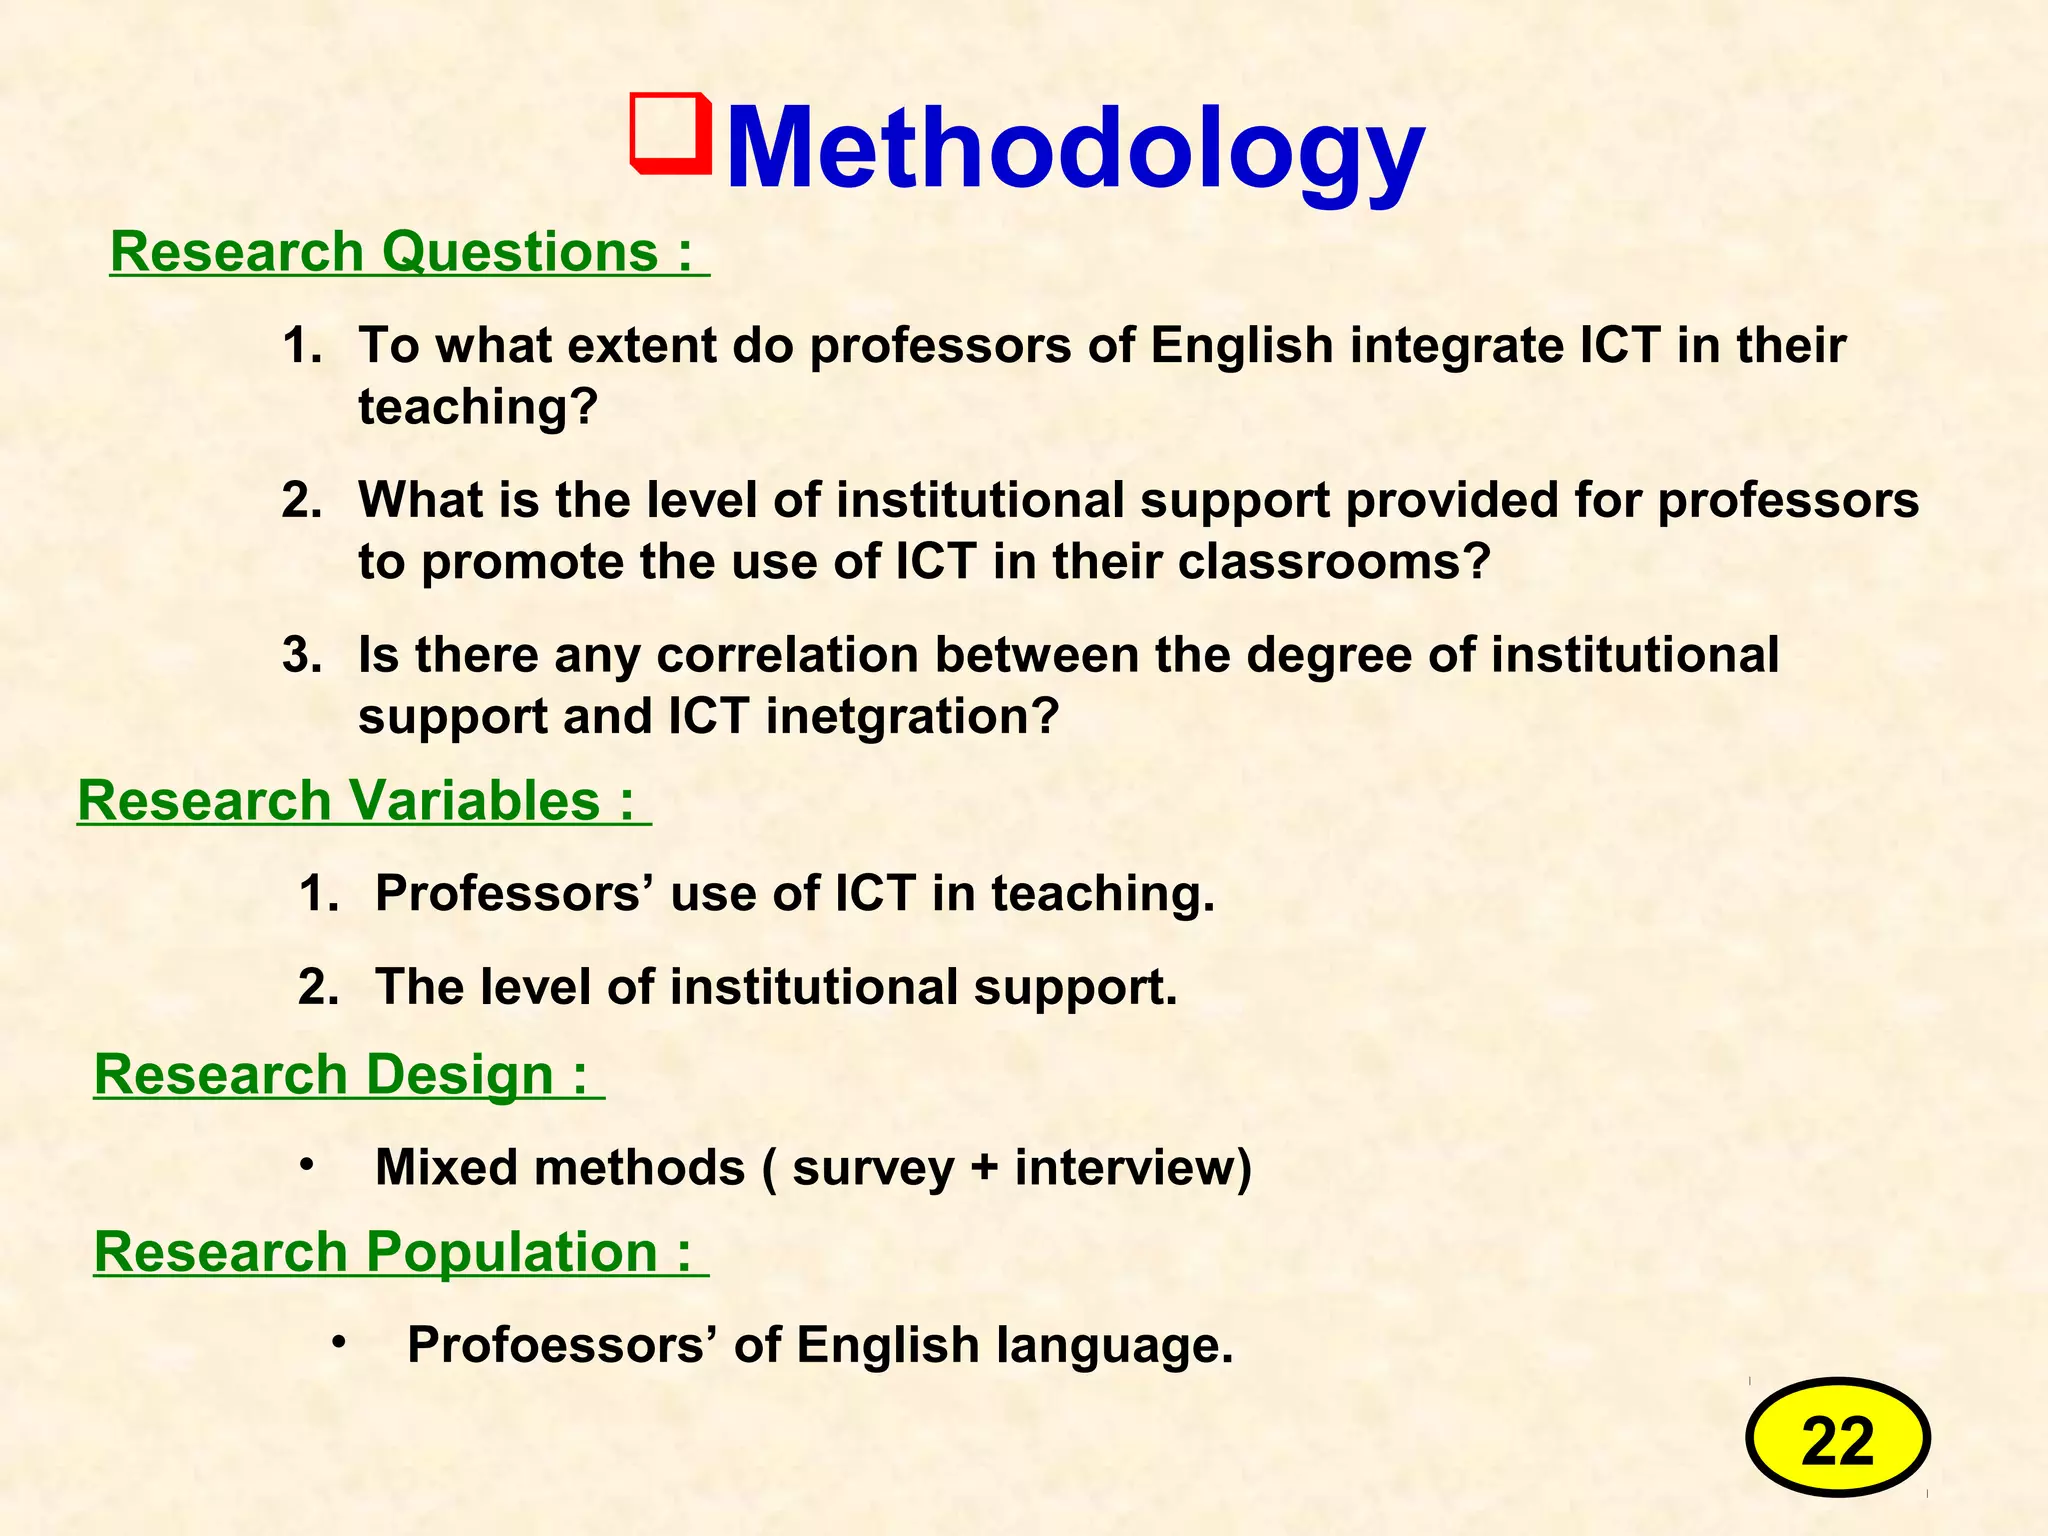
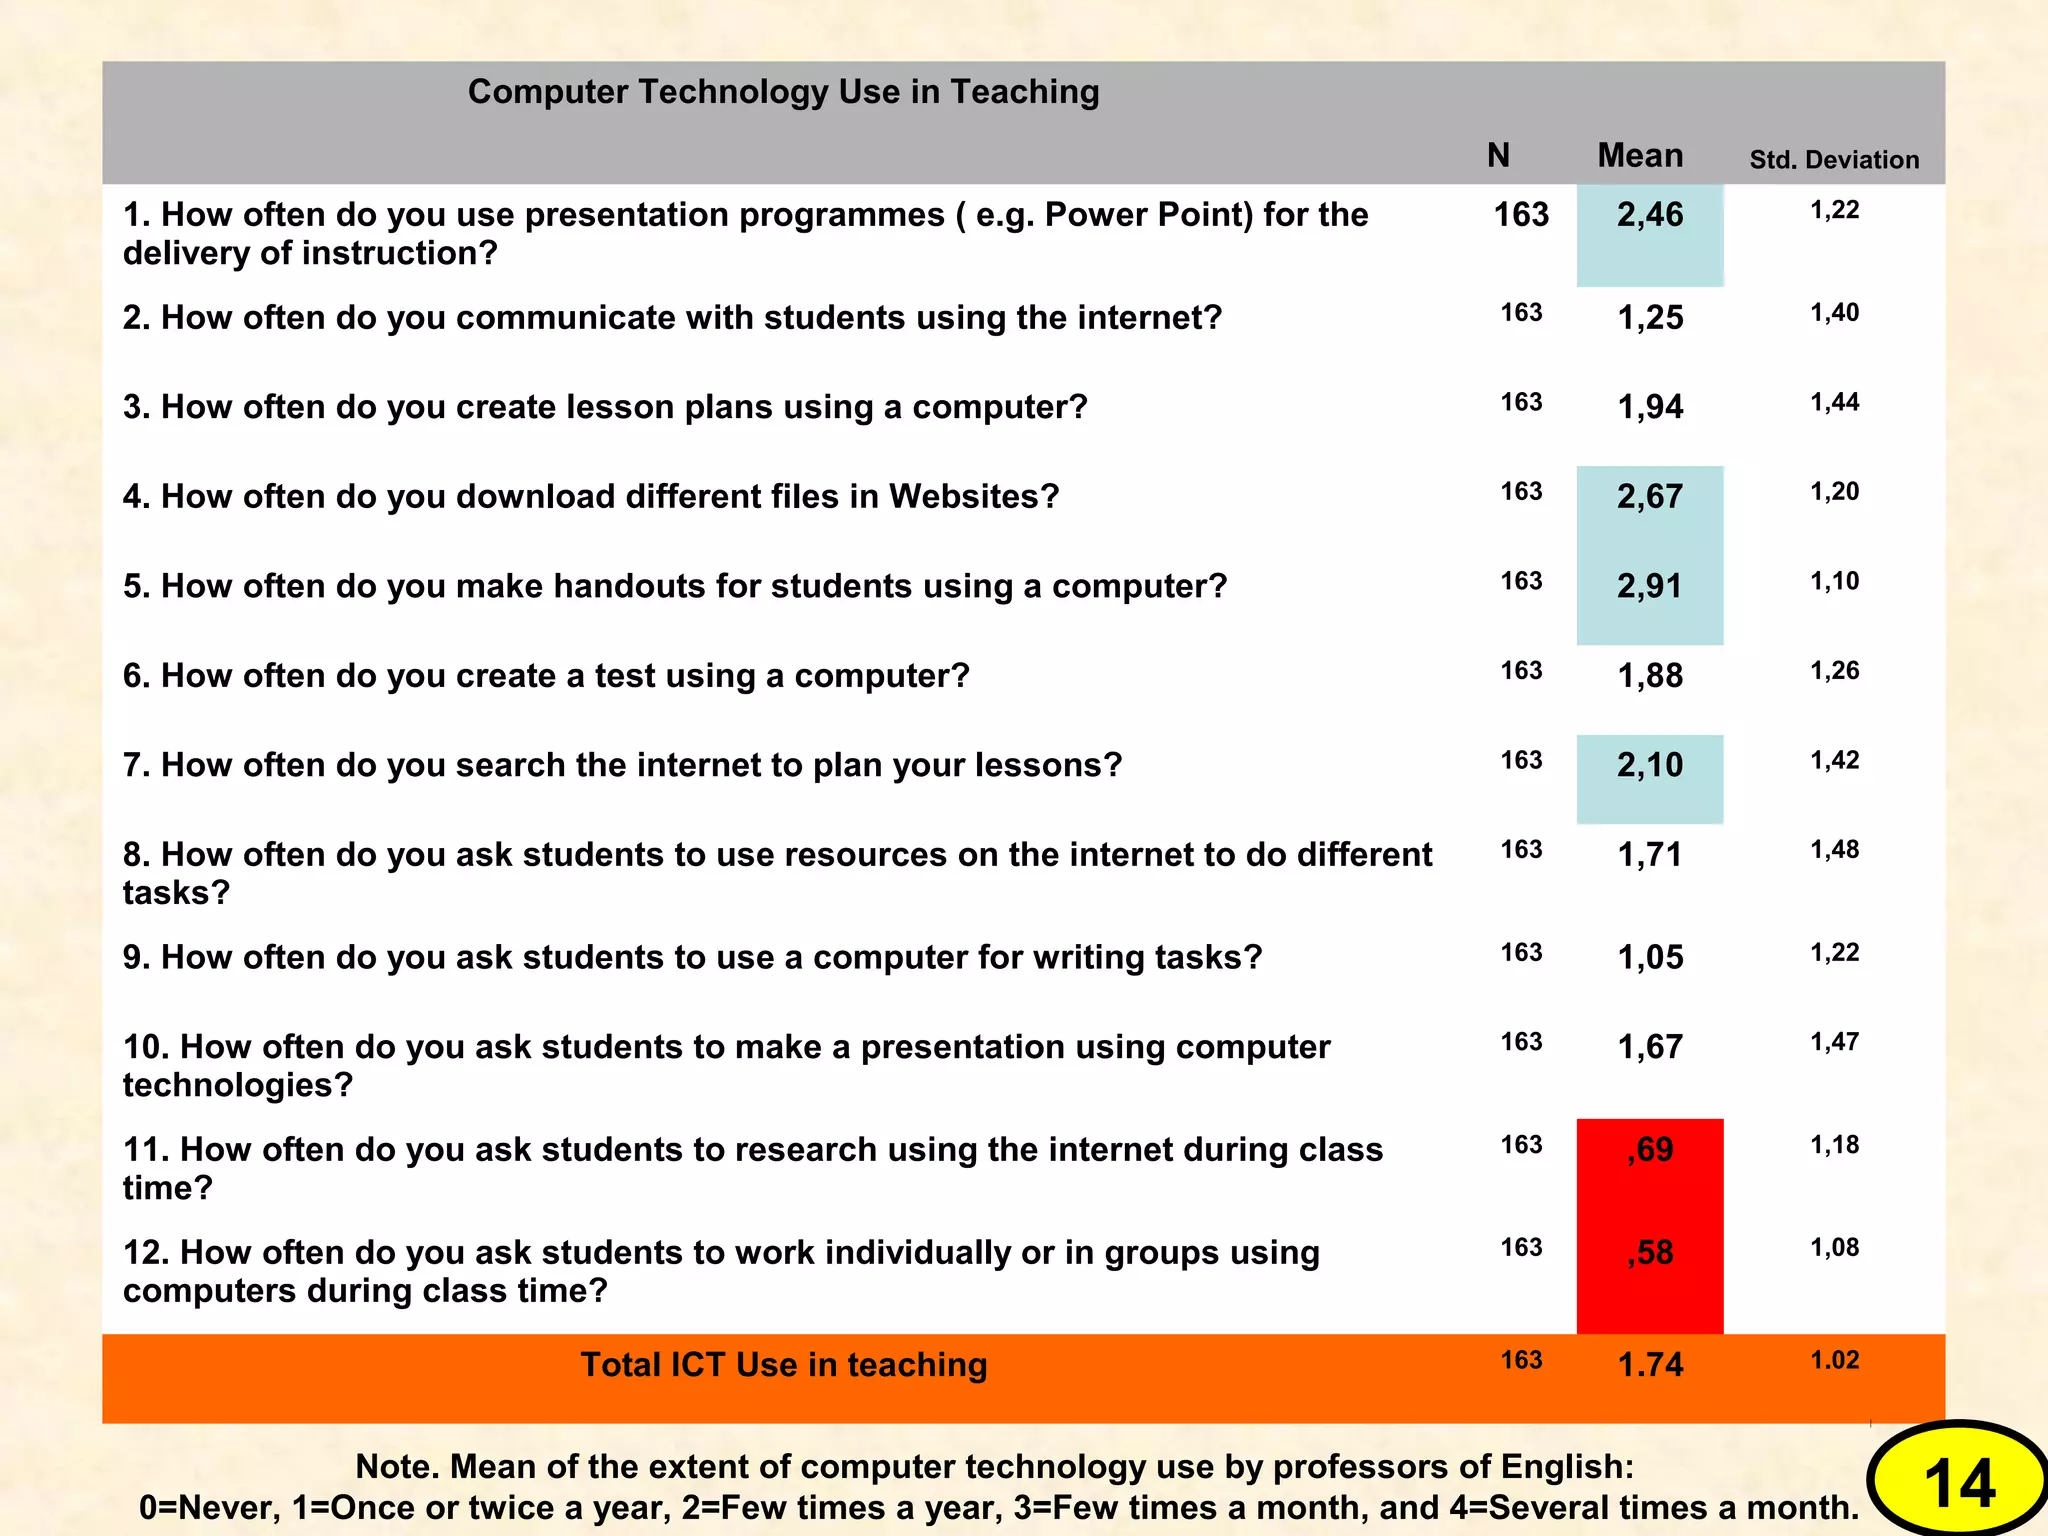
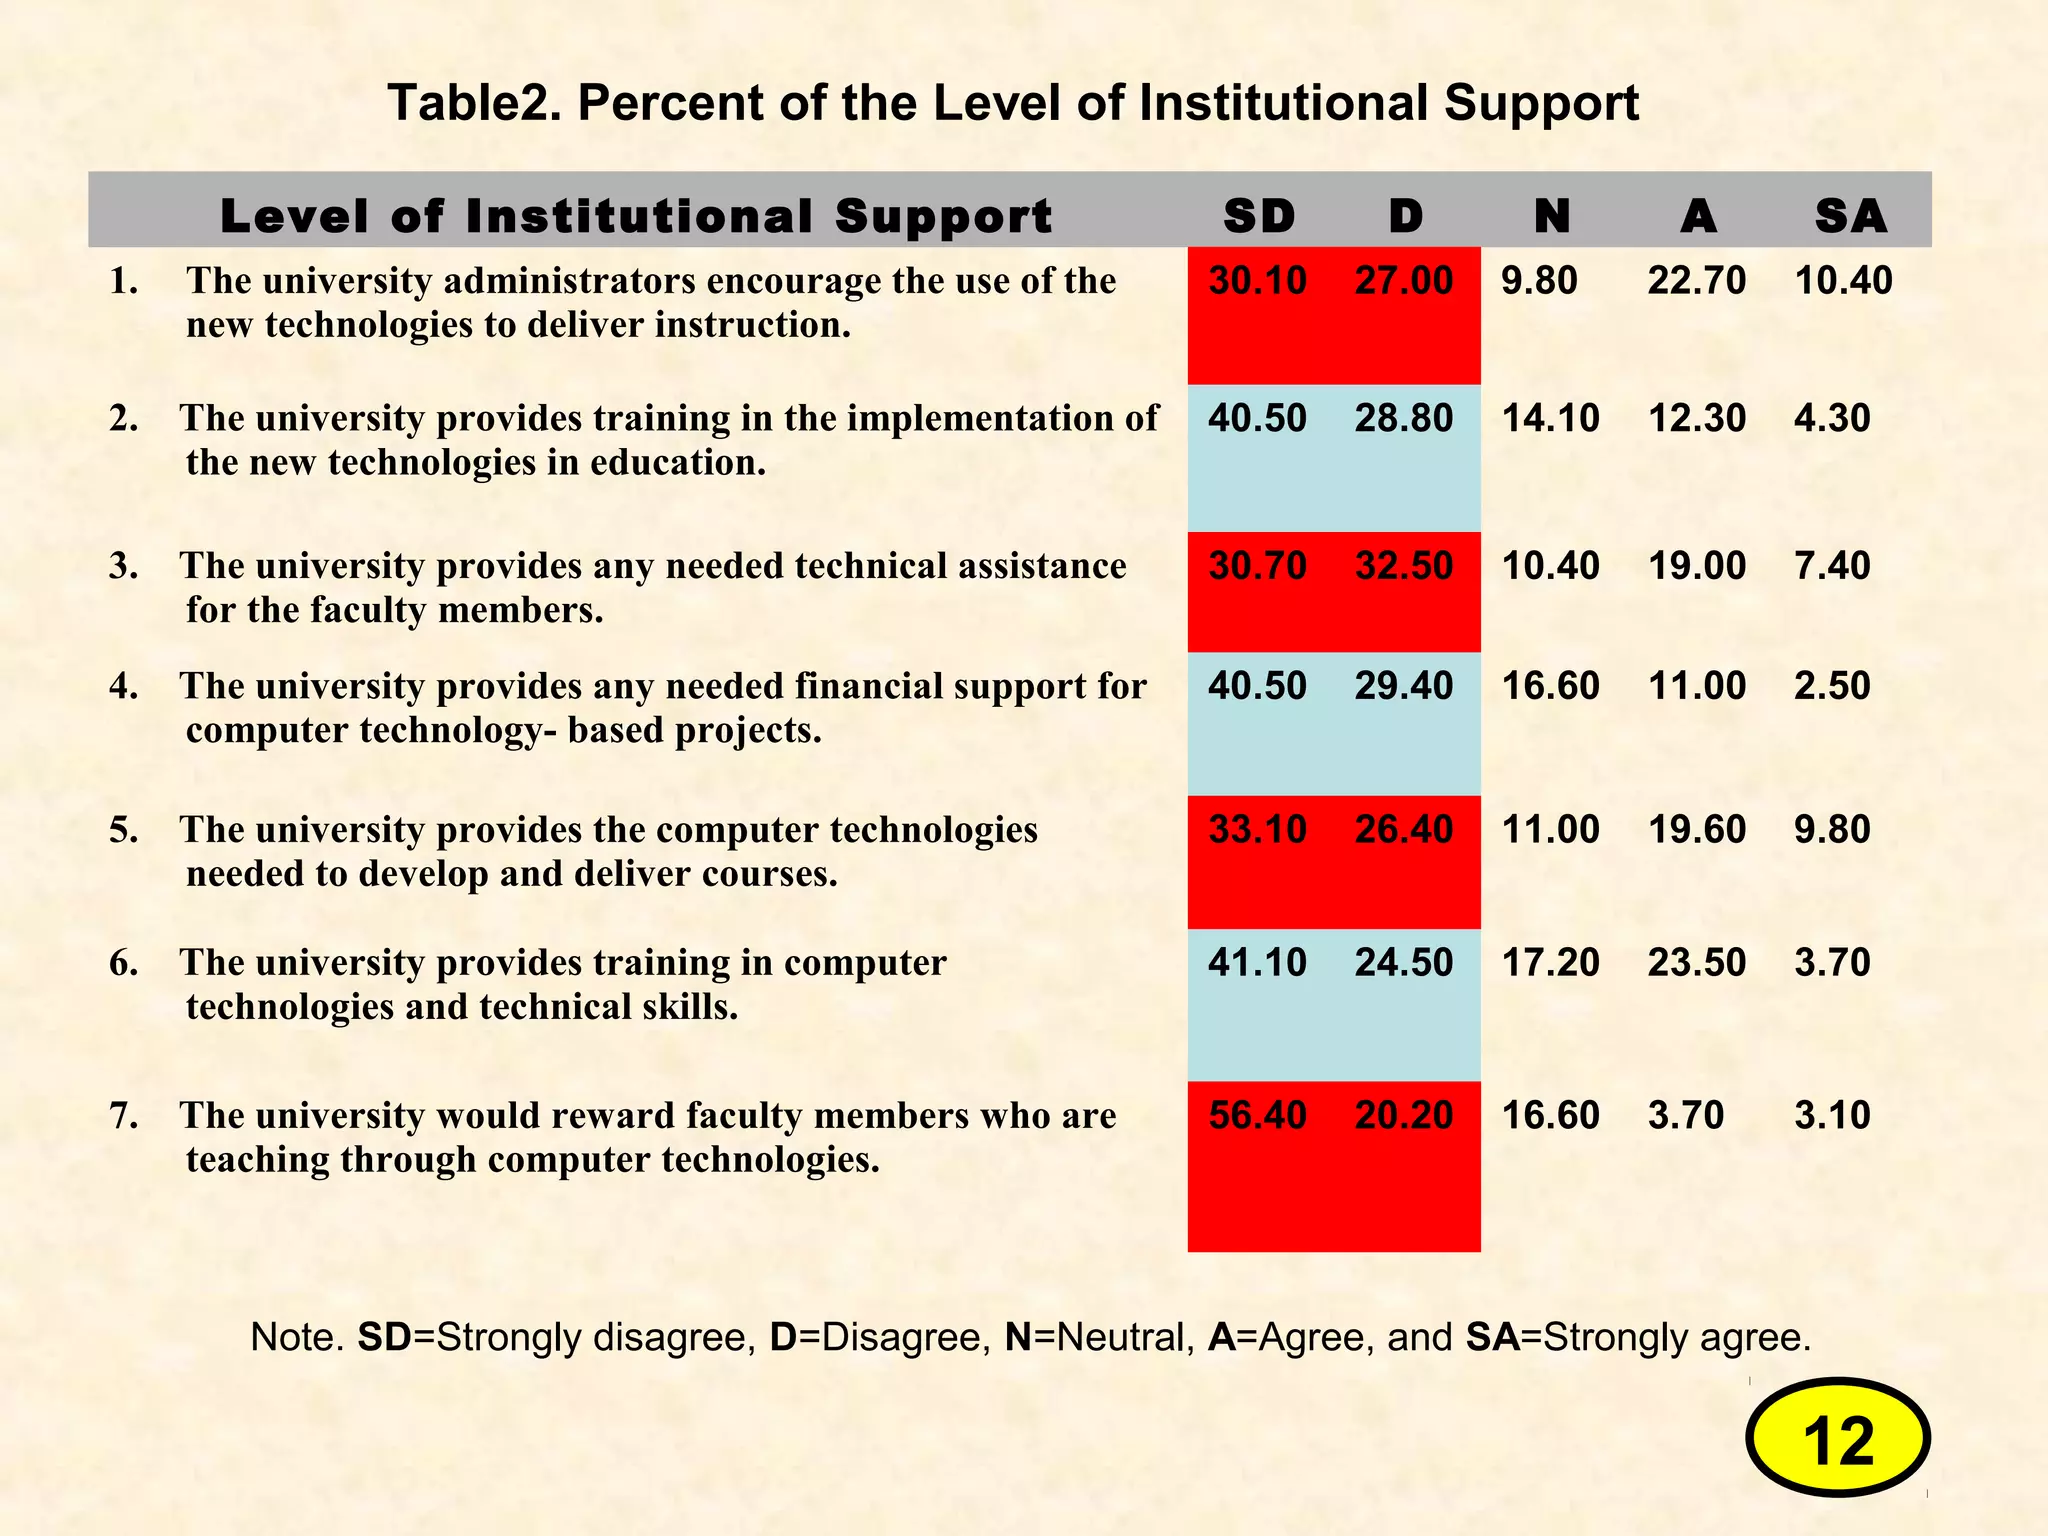
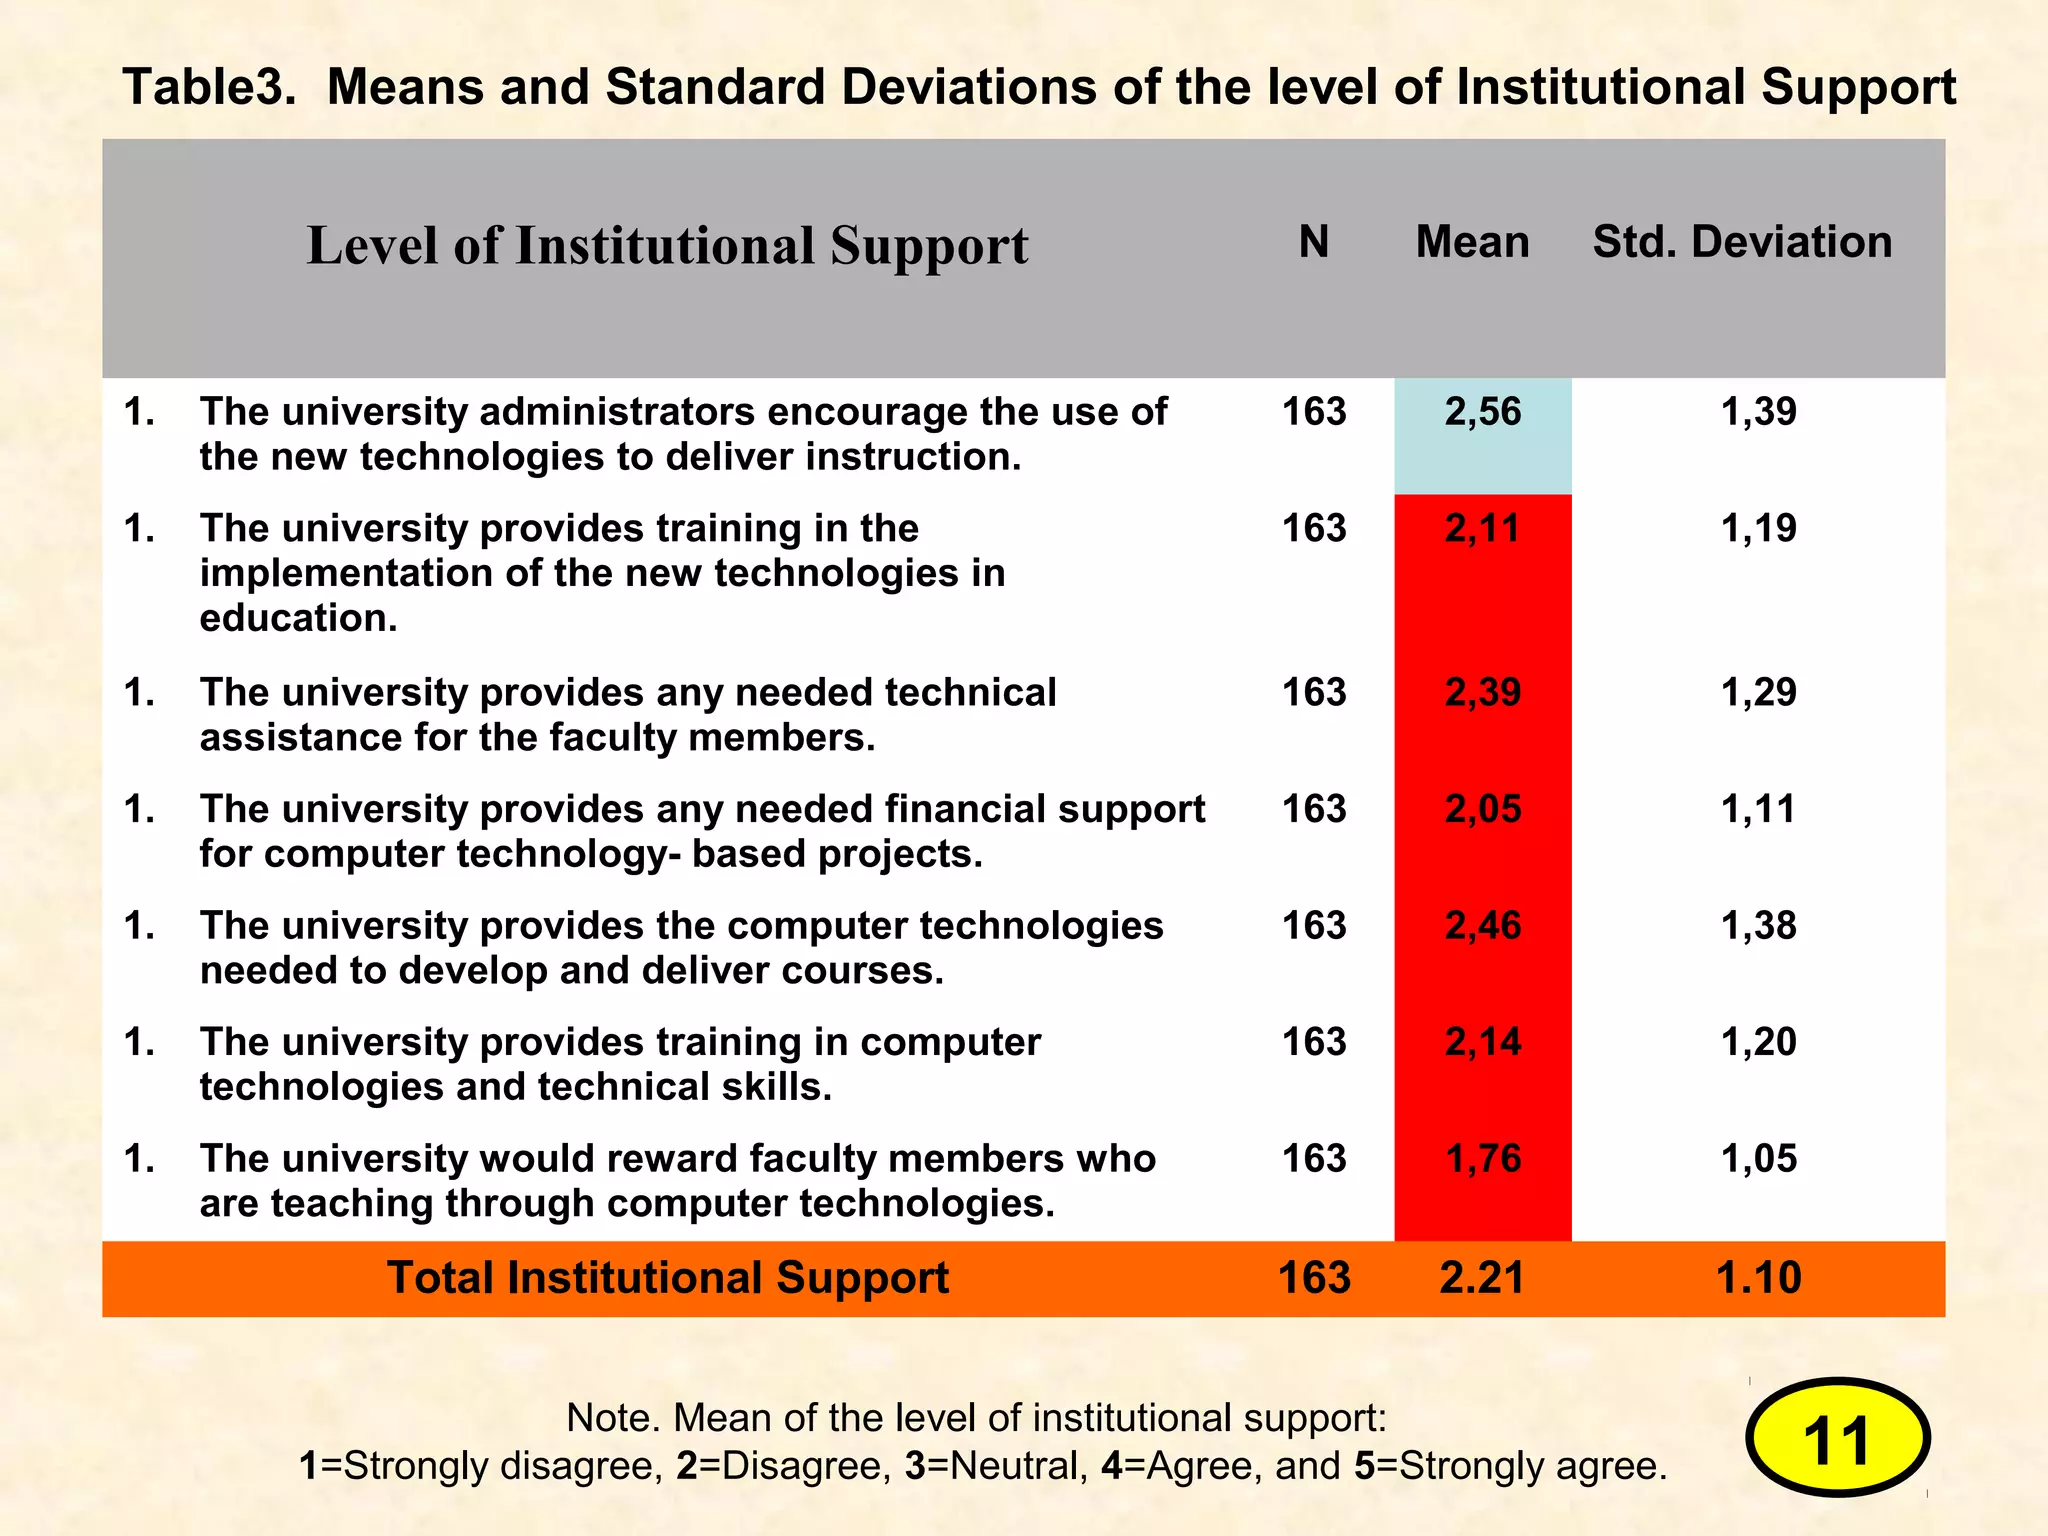
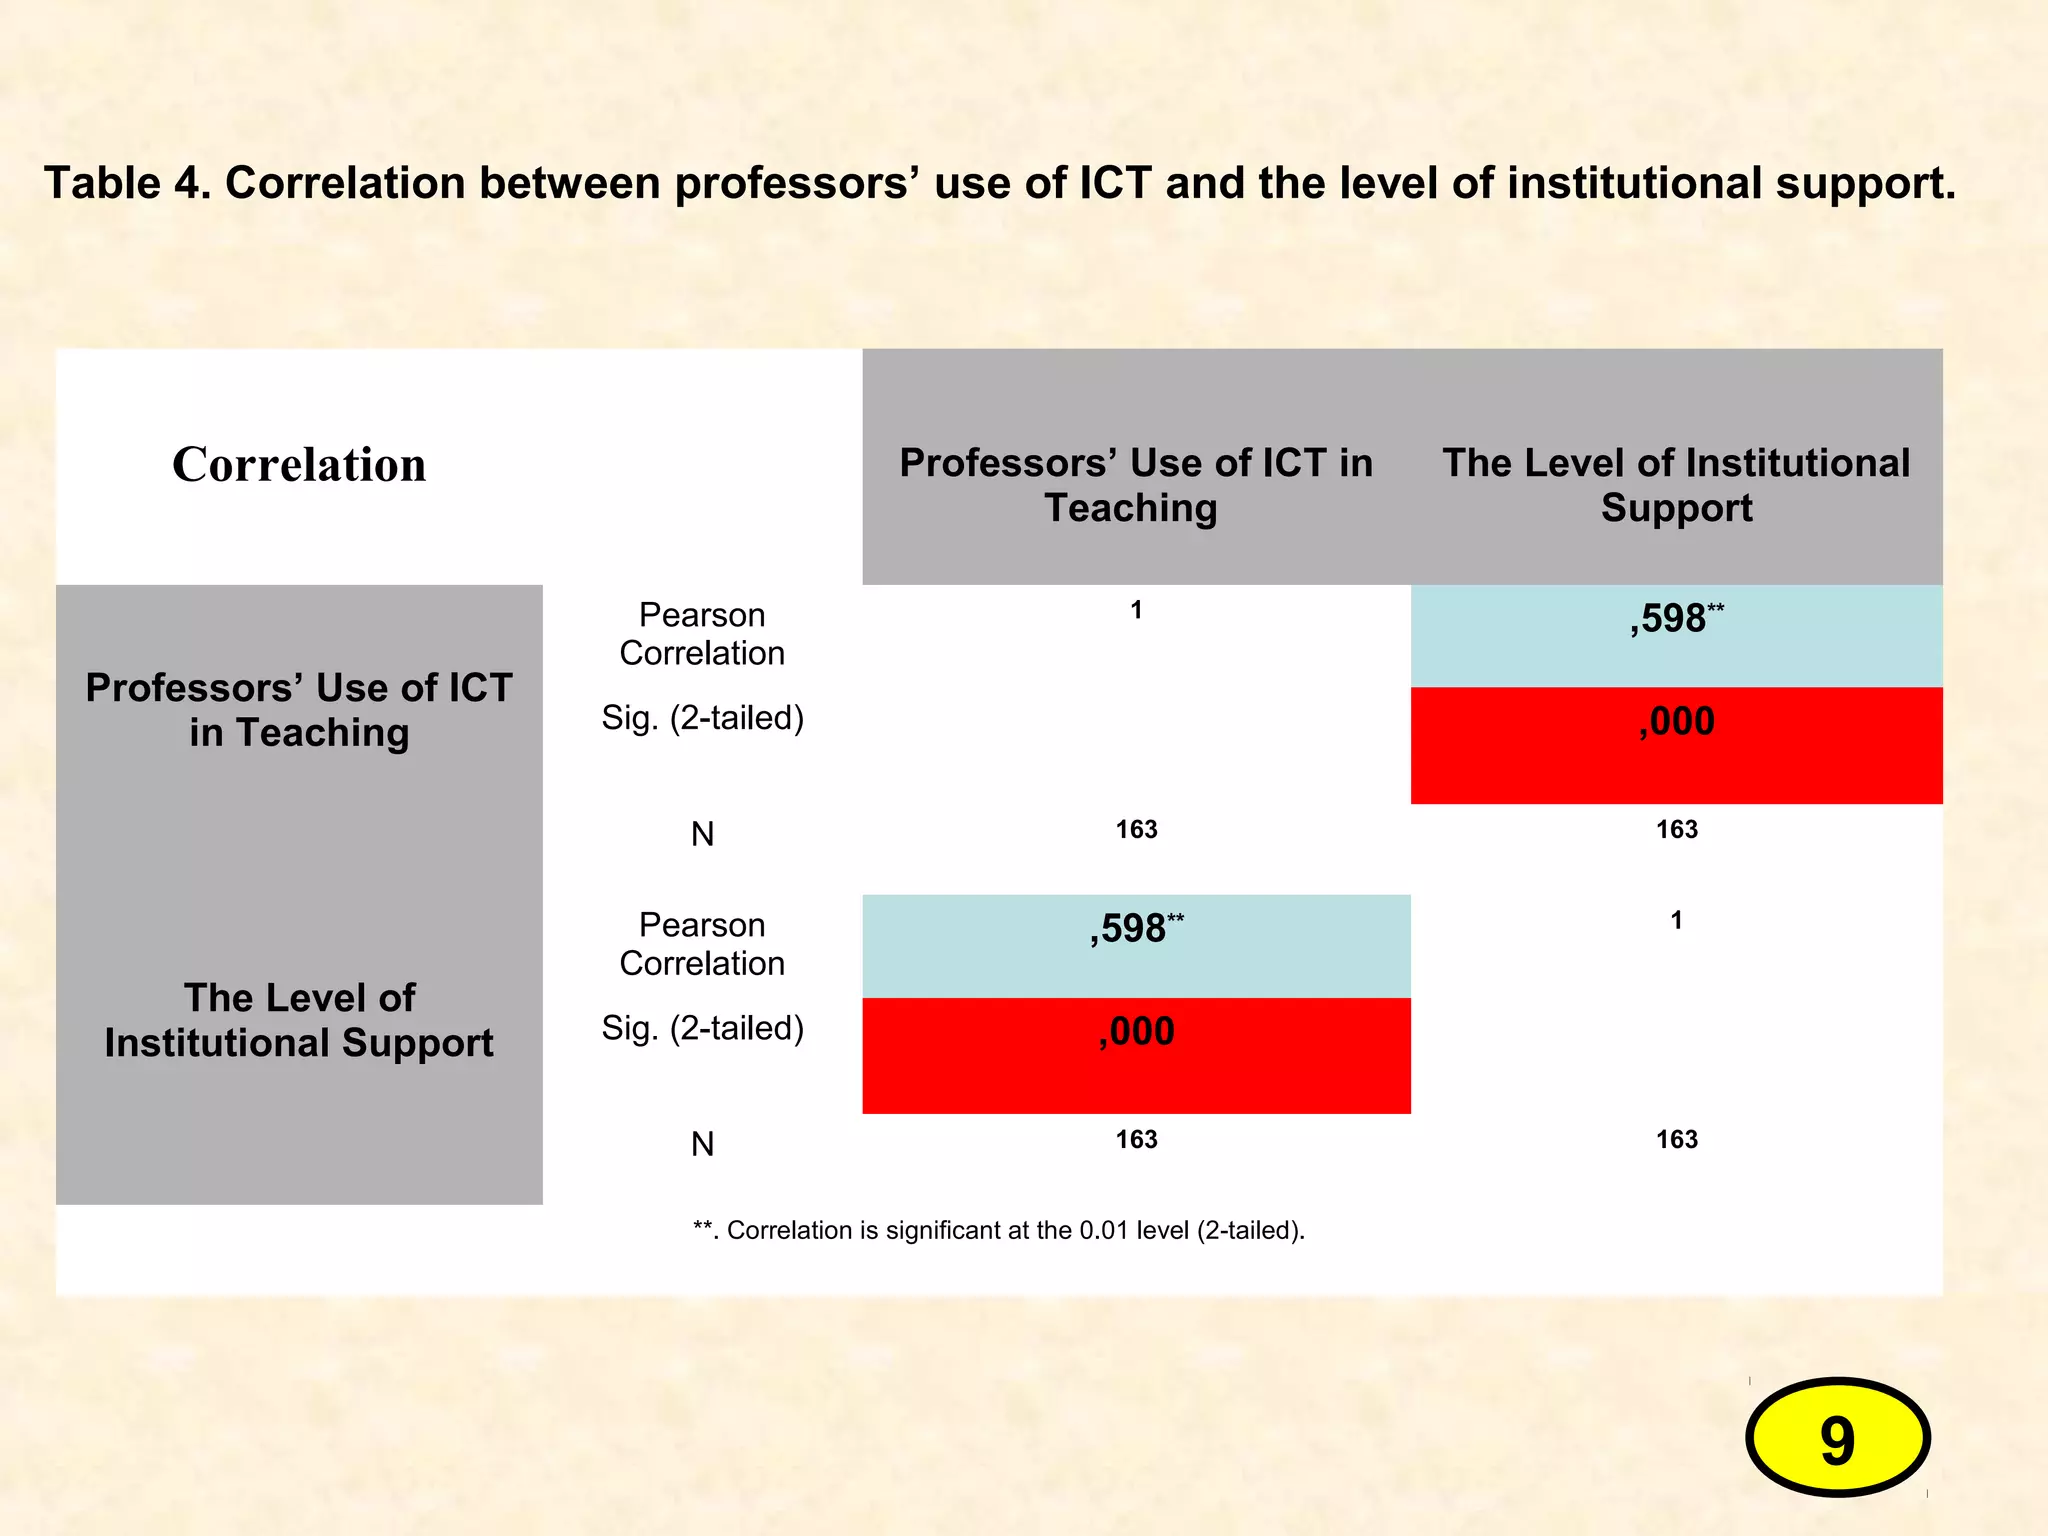
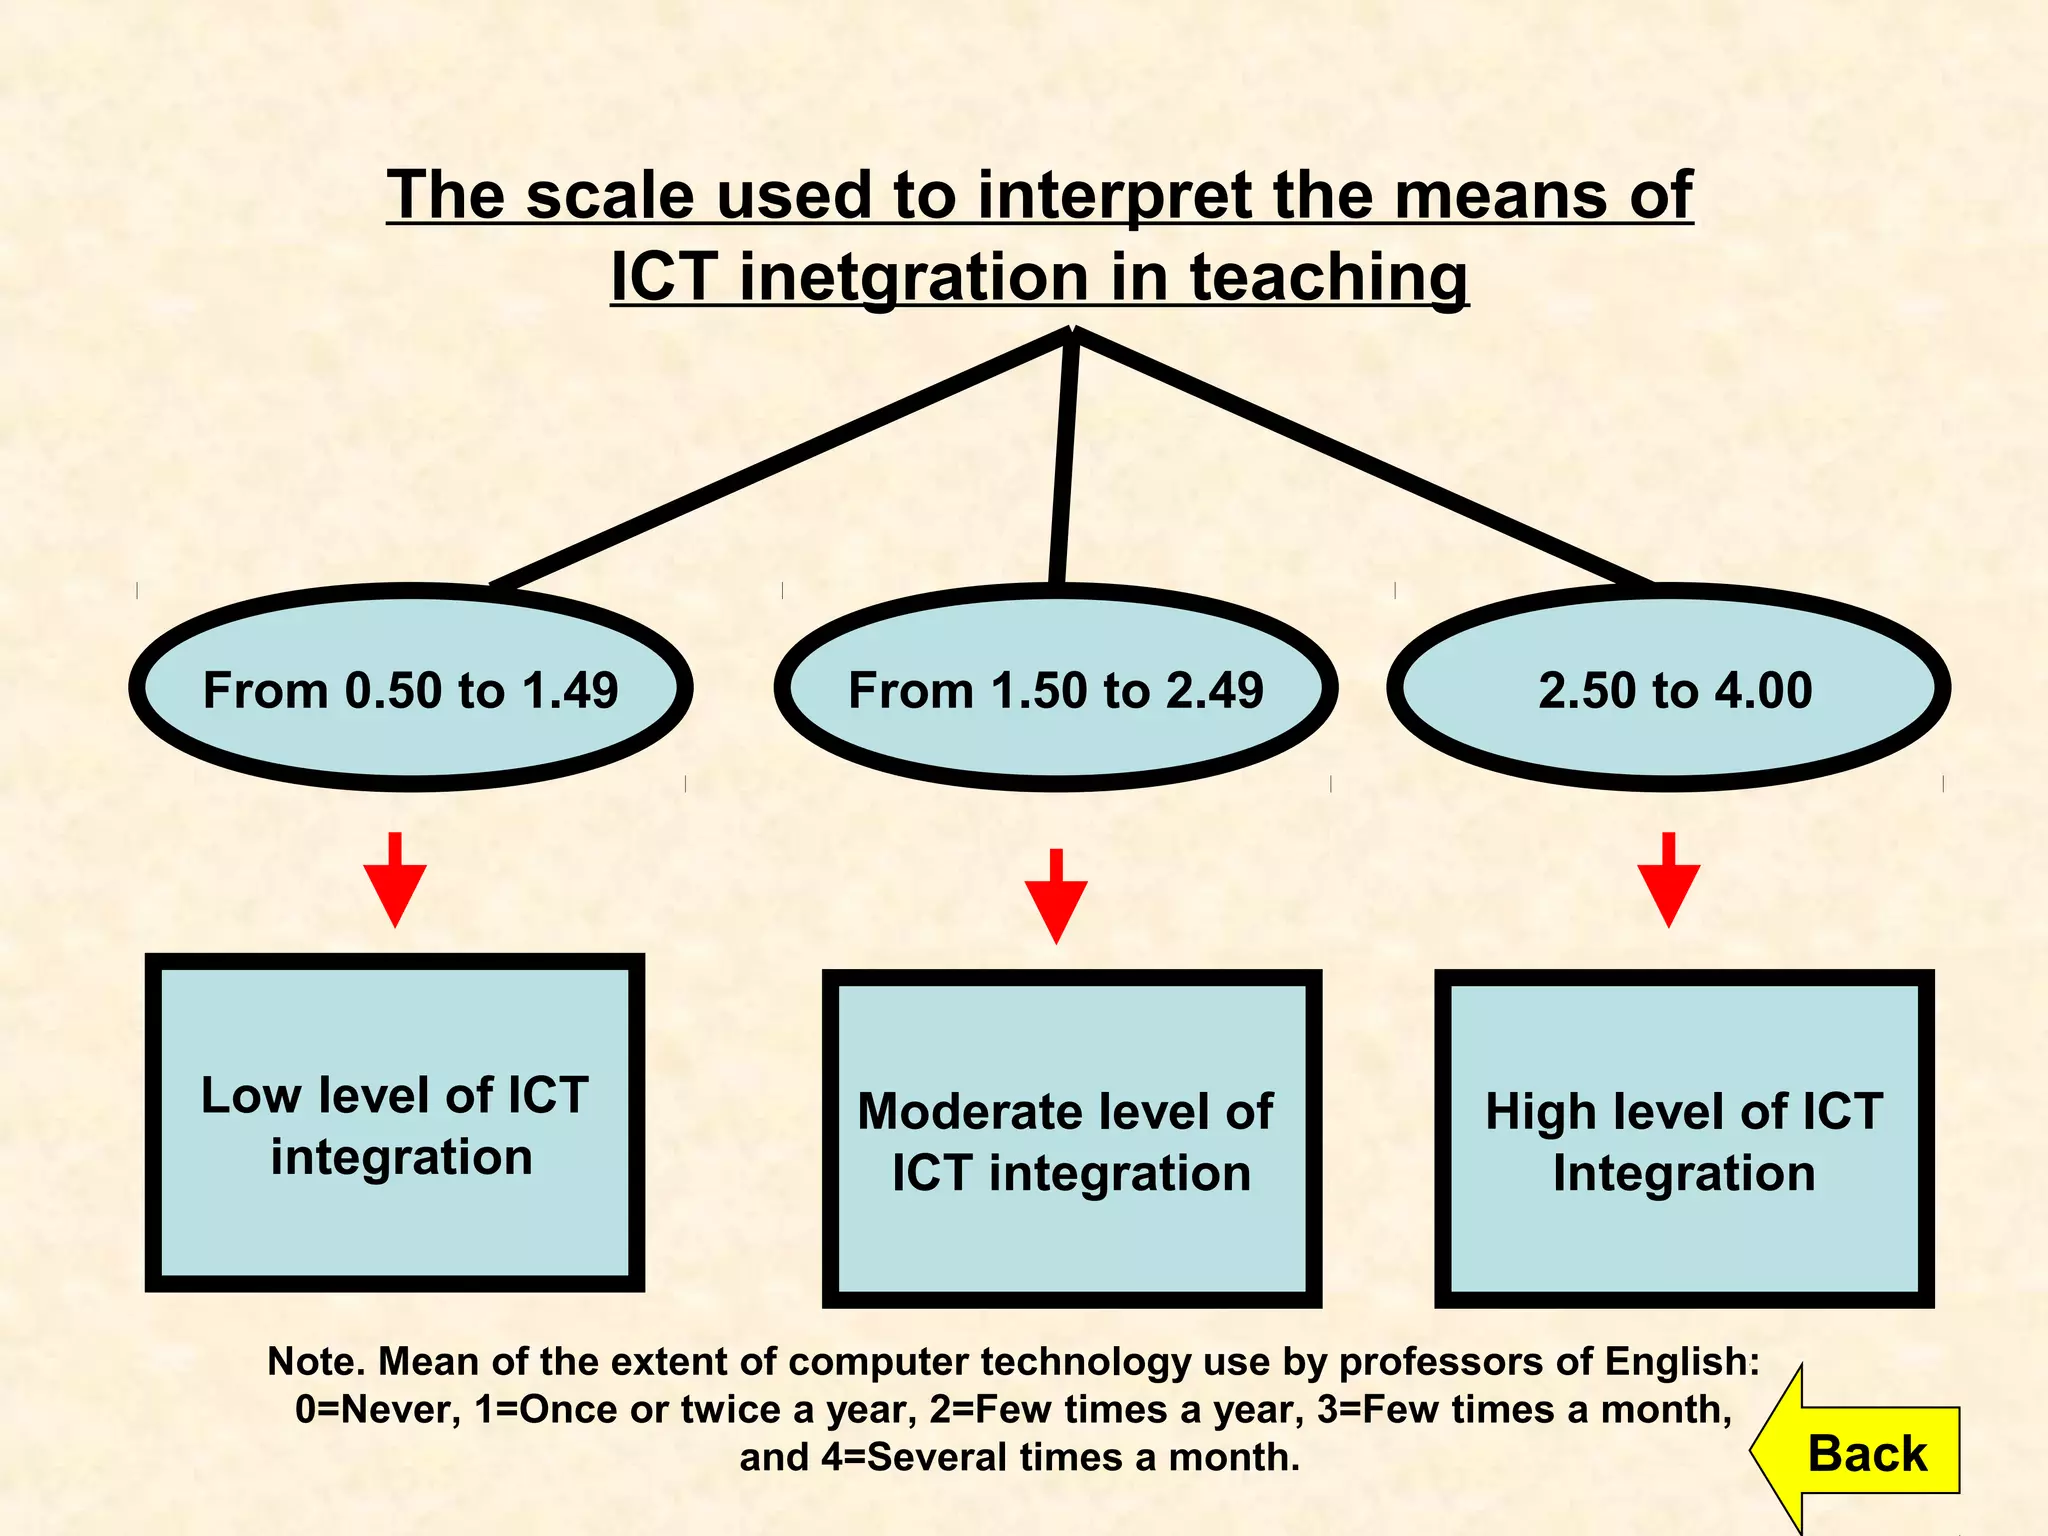
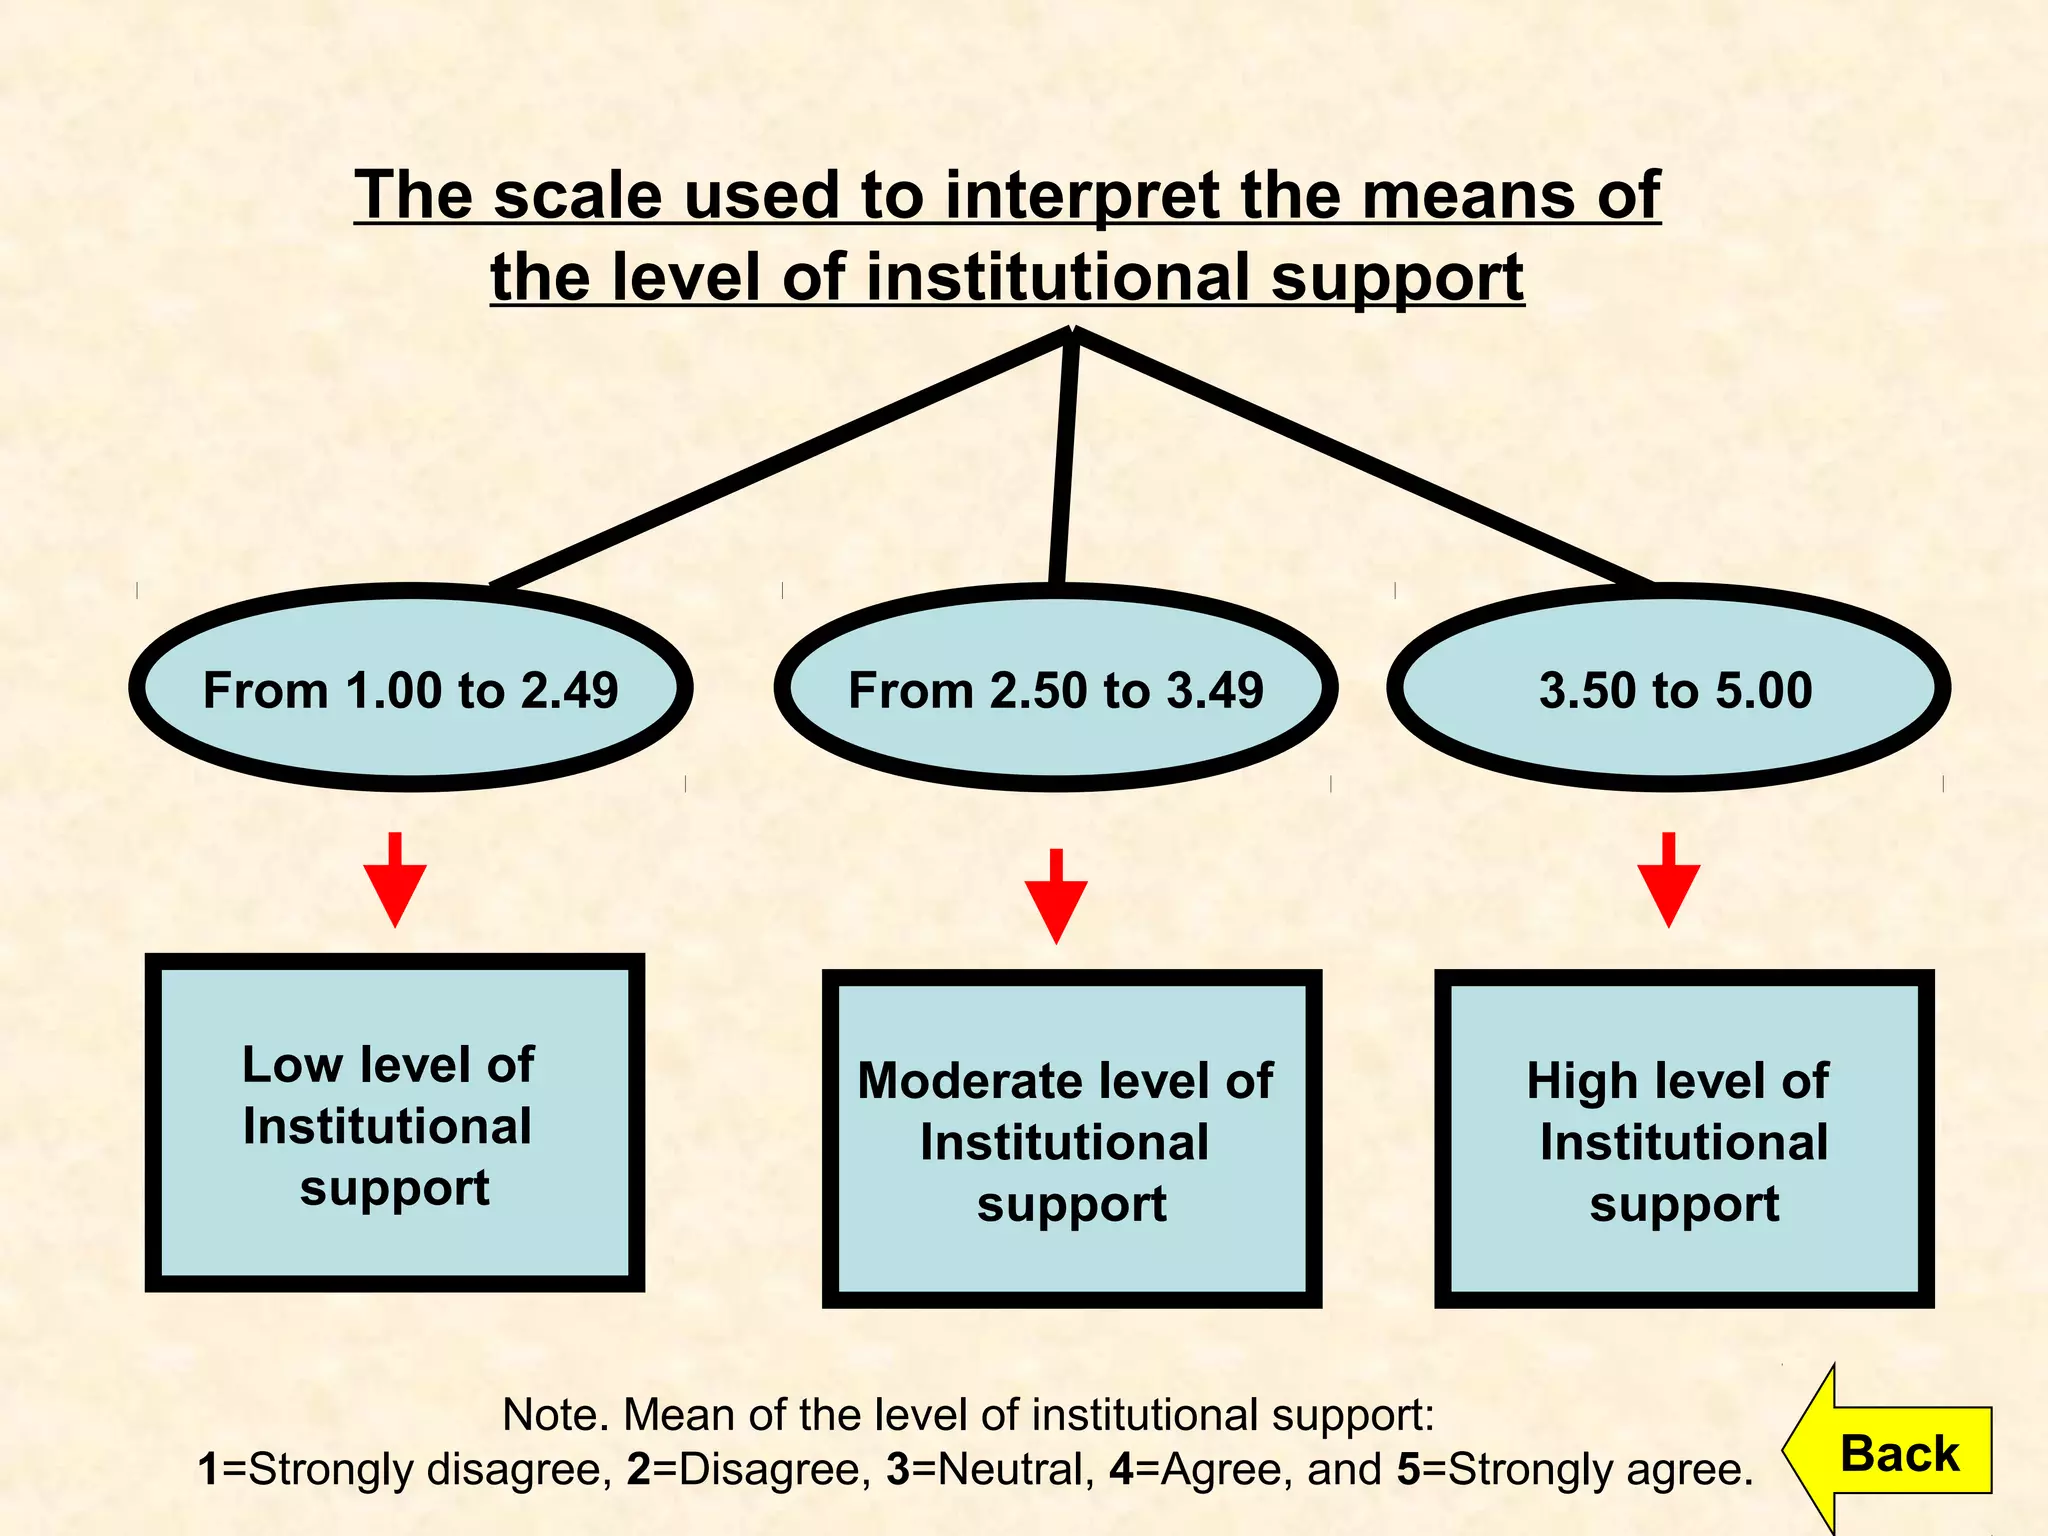
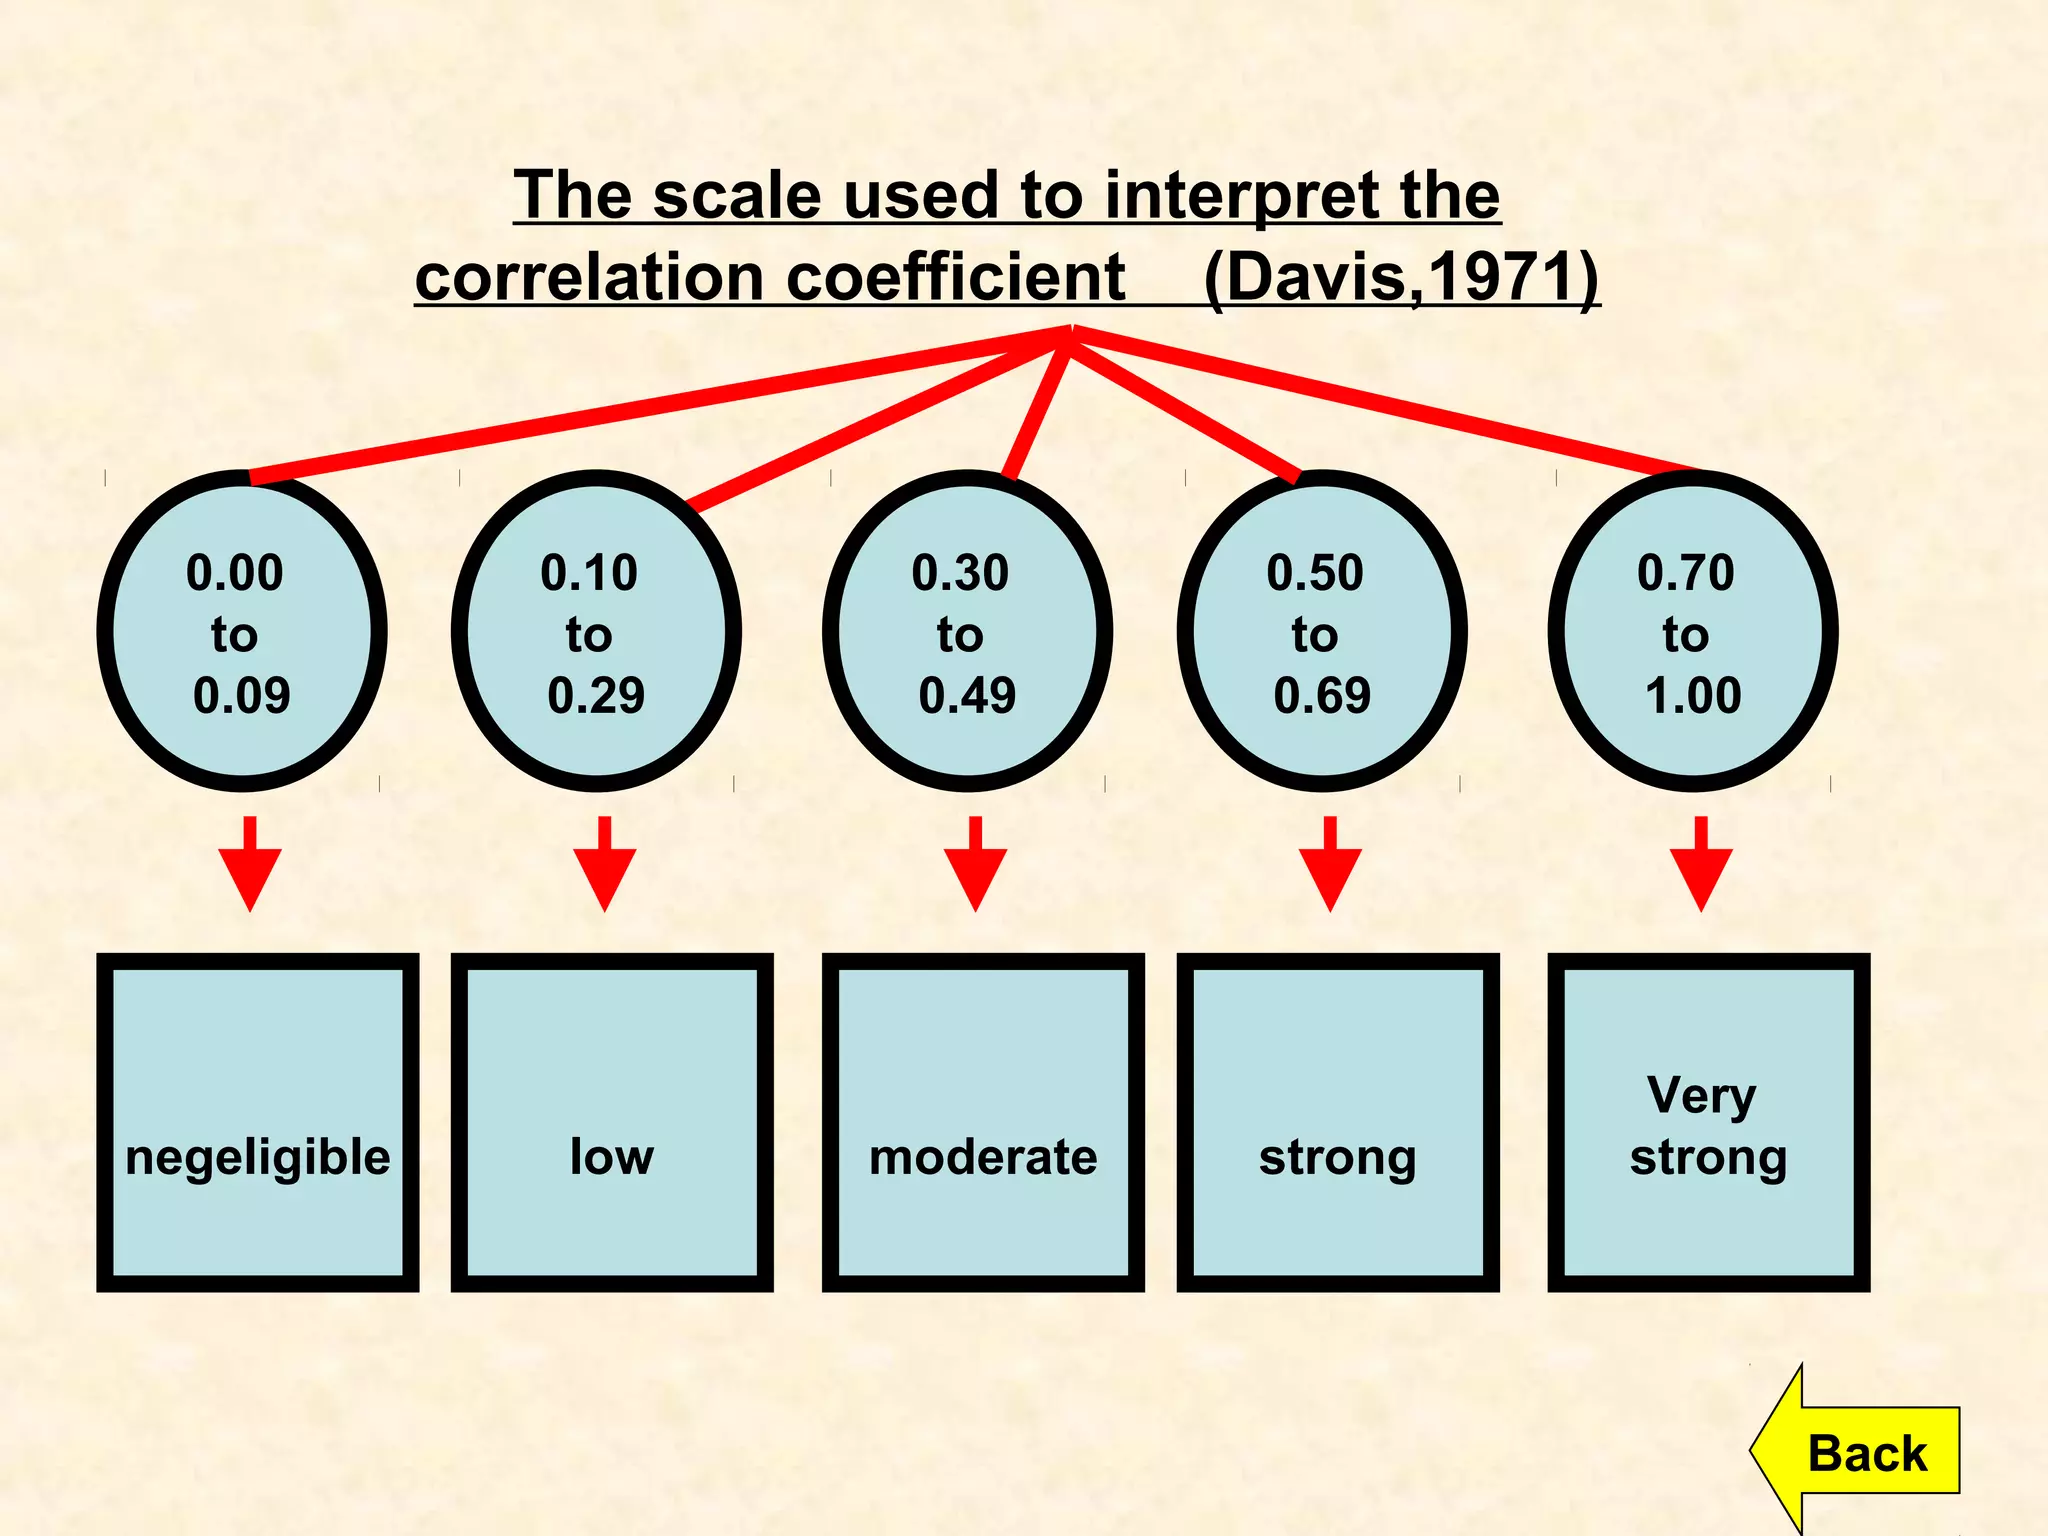
English Professors’ Use of
Computer Technologies in
Moroccan Universities
Presented by
Hicham LAABIDI
Moroccan Resource Centers of English Network
MoRCE-Net 5th Annual Conference
Date : February, the 2nd
, 2017
Venue : Marrakech, Morocco.
Outline
 Introduction
 Review of Related Literature
 Methodolgy
 Results and Discussion
 Conclusion
25
Introduction
• In the last decades, much research has been carried out to
investigate the use of the new technologies in the field of
education. During this time, there has been a shift from the
focus on what computers could offer students to how to make
effective and successful use of computer technology to facilitate
learning (Chapelle, 2001).
• Higher educational institutions have recognized the importance
of incorporating these new innovative gadgets within classroom
practices. Indeed, these institutions have understood that
computer technology could play a big part in transforming all
the levels of education. For this reason, universities and other
higher educational institutions are determined to provide the
necessary devices and effective training for professors to
achieve successful implementation of ICT in the classroom
(Sahin & Thompson, 2006).
24
GENIE Project
MARWAN Project
CVM Project
CATT Project
ALEF Project
23
 Review of Related Literature
The Use of ICT in Moroccan Education
Methodology
Research Questions :
1. To what extent do professors of English integrate ICT in their
teaching?
2. What is the level of institutional support provided for professors
to promote the use of ICT in their classrooms?
3. Is there any correlation between the degree of institutional
support and ICT inetgration?
Research Variables :
1. Professors’ use of ICT in teaching.
2. The level of institutional support.
Research Design :
• Mixed methods ( survey + interview)
Research Population :
• Profoessors’ of English language.
22
 Demographic Findings
about the Participants.
21
Figure 1. Distribution of Participants by Gender.
20
Figure 2. Distribution of Participants by Age
19
Figure 3. Distribution of Participants by University of Affiliation.
18
Figure 4. Distribution of Participants by Teaching Experience
17
Figure 5. Distribution of Participants by Computer Experience
16
 Findings related to research
question 1:
15
Note. Mean of the extent of computer technology use by professors of English:
0=Never, 1=Once or twice a year, 2=Few times a year, 3=Few times a month, and 4=Several times a month.
Computer Technology Use in Teaching
N Mean Std. Deviation
1. How often do you use presentation programmes ( e.g. Power Point) for the
delivery of instruction?
163 2,46 1,22
2. How often do you communicate with students using the internet? 163 1,25 1,40
3. How often do you create lesson plans using a computer? 163 1,94 1,44
4. How often do you download different files in Websites? 163 2,67 1,20
5. How often do you make handouts for students using a computer? 163 2,91 1,10
6. How often do you create a test using a computer? 163 1,88 1,26
7. How often do you search the internet to plan your lessons? 163 2,10 1,42
8. How often do you ask students to use resources on the internet to do different
tasks?
163 1,71 1,48
9. How often do you ask students to use a computer for writing tasks? 163 1,05 1,22
10. How often do you ask students to make a presentation using computer
technologies?
163 1,67 1,47
11. How often do you ask students to research using the internet during class
time?
163 ,69 1,18
12. How often do you ask students to work individually or in groups using
computers during class time?
163 ,58 1,08
Total ICT Use in teaching 163 1.74 1.02
14
 Findings related to research
question 2:
13
Level of Institutional Support SD D N A SA
1. The university administrators encourage the use of the
new technologies to deliver instruction.
30.10 27.00 9.80 22.70 10.40
2. The university provides training in the implementation of
the new technologies in education.
40.50 28.80 14.10 12.30 4.30
3. The university provides any needed technical assistance
for the faculty members.
30.70 32.50 10.40 19.00 7.40
4. The university provides any needed financial support for
computer technology- based projects.
40.50 29.40 16.60 11.00 2.50
5. The university provides the computer technologies
needed to develop and deliver courses.
33.10 26.40 11.00 19.60 9.80
6. The university provides training in computer
technologies and technical skills.
41.10 24.50 17.20 23.50 3.70
7. The university would reward faculty members who are
teaching through computer technologies.
56.40 20.20 16.60 3.70 3.10
Table2. Percent of the Level of Institutional Support
Note. SD=Strongly disagree, D=Disagree, N=Neutral, A=Agree, and SA=Strongly agree.
12
Level of Institutional Support N Mean Std. Deviation
1. The university administrators encourage the use of
the new technologies to deliver instruction.
163 2,56 1,39
1. The university provides training in the
implementation of the new technologies in
education.
163 2,11 1,19
1. The university provides any needed technical
assistance for the faculty members.
163 2,39 1,29
1. The university provides any needed financial support
for computer technology- based projects.
163 2,05 1,11
1. The university provides the computer technologies
needed to develop and deliver courses.
163 2,46 1,38
1. The university provides training in computer
technologies and technical skills.
163 2,14 1,20
1. The university would reward faculty members who
are teaching through computer technologies.
163 1,76 1,05
Total Institutional Support 163 2.21 1.10
Table3. Means and Standard Deviations of the level of Institutional Support
Note. Mean of the level of institutional support:
1=Strongly disagree, 2=Disagree, 3=Neutral, 4=Agree, and 5=Strongly agree. 11
 Findings related to research
question 3:
10
Correlation Professors’ Use of ICT in
Teaching
The Level of Institutional
Support
Professors’ Use of ICT
in Teaching
Pearson
Correlation
1
,598**
Sig. (2-tailed) ,000
N 163 163
The Level of
Institutional Support
Pearson
Correlation
,598** 1
Sig. (2-tailed) ,000
N 163 163
**. Correlation is significant at the 0.01 level (2-tailed).
Table 4. Correlation between professors’ use of ICT and the level of institutional support.
9
Figure 11. Means plot for professors’ use of ICT and the level of institutional support.
8
 Qualitative Findings
7
Interview participants thought that inadequate
institutional support is regarded as one of the major
factors that affect professors’ use of ICT in their teaching
practices. One of the respondents noted that “ lack of
support from the institution is one of the reasons many
teachers do not integrate CT in their classrooms” ( P7) .
In fact, some of the participants stated that their
institutions provided some of the required support such
as data-shows, remote controls, printers, plugs and
cables. Yet, they need other materials like speakers,
interactive boards and mainly Internet connection. P8
said “ honestly speaking, I would like my institution to
provide teachers with access to the Wifi and an
electronic library”.
Theme : Institutional Support
6
Participants emphasized on providing
sufficient computer training for all professors
to guarantee the successful implementation of
ICT in their classrooms. One of the
respondents commented “I would highly
appreciate if my institution could provide us
with good quality training” (P4) . Another
professor also pointed that the university
should provide “ quality training courses for
teachers to enable them use CT devises to
meet the needs of the new millennium
learners” ( P7) .
5
As for the support provided by the Moroccan government,
the participants noted that computer programmes such as
MARWAN, ITQAN, INJAZ and others are very great
initiatives that encourage the integration of computer
technologies in Moroccan universities. One of the
participants said it’s “a good initiative deserving the thumbs
up” (P11). Another one commented “personally, I
appreciate this policy since information and communication
technology has become an essential section of most
organisations these days” (P4). P8 shared the same
perspective and added that such technology programmes
are crucial “because technology is part of students’ daily
lives. Therefore, teachers have to use computer
technology to introduce, reinforce, extend, enrich, and
remediate students’ mastery of curricular goals” (P8).
4
However, the majority of the participants are not
satisfied with the actual implementation of these
programmes within classrooms. Indeed, “there is
a mismatch between what the Moroccan
government expresses and the actual
facilitations of integrating computer technology”
(P5). One of the participants reported “I think the
government’s policy has proved to be
unsuccessful in the sense that it has spent huge
budgets on Genie project, for example, and
other initiatives, but the impact of such programs
on teachers’ teaching practices in Moroccan
schools is almost absent”.
3
P6 also noted that it’s “a good initiative,
but it is still unsatisfactory; more materials
and budgets should be allocated to
integrating CT in education. In fact we are
still lagging behind in comparison to some
North African countries”.
2
Conclusion
Computer technologies have become
significant educational tools in Moroccan
higher education. However, the value of
these gadgets relies on how effectively
professors integrate them in their
teaching.
1
Thank you
The scale used to interpret the means of
ICT inetgration in teaching
Low level of ICT
integration
From 0.50 to 1.49
Moderate level of
ICT integration
From 1.50 to 2.49
High level of ICT
Integration
2.50 to 4.00
Note. Mean of the extent of computer technology use by professors of English:
0=Never, 1=Once or twice a year, 2=Few times a year, 3=Few times a month,
and 4=Several times a month. Back
The scale used to interpret the means of
the level of institutional support
Low level of
Institutional
support
From 1.00 to 2.49
Moderate level of
Institutional
support
From 2.50 to 3.49
High level of
Institutional
support
3.50 to 5.00
Note. Mean of the level of institutional support:
1=Strongly disagree, 2=Disagree, 3=Neutral, 4=Agree, and 5=Strongly agree. Back
The scale used to interpret the
correlation coefficient (Davis,1971)
negeligible
0.00
to
0.09
low
0.10
to
0.29
moderate
0.30
to
0.49
strong
0.50
to
0.69
Very
strong
0.70
to
1.00
Back
Faculty Females Males Total
1. Faculty of Letters and Human Sciences/ Agadir. 8 27 35
1. Faculty of Letters and Human Sciences/ Ain Chck, Casablanca. 16 16 32
1. Faculty of Letters and Human Sciences/ Ben M’Sick, Casablanca. 4 14 18
1. Faculty of Letters and Human Sciences/ Beni Mellal. 5 11 16
1. Faculty of Letters and Human Sciences/ Dhar El Mahraz, Fez. 8 15 23
1. Faculty of Letters and Human Sciences/ Sais, Fez. 4 13 17
1. Faculty of Letters and Human Sciences/ El Jadida. 6 21 27
1. Faculty of Letters and Human Sciences/ Kenitra. 6 15 21
1. Faculty of Letters and Human Sciences/ Marrakech. 17 18 35
1. Faculty of Letters and Human Sciences/ Meknés. 8 23 31
1. Faculty of Letters and Human Sciences/ Mohammedia. 7 12 19
1. Faculty of Letters and Human Sciences/ Oujda. 9 14 23
1. Faculty of Letters and Human Sciences/ Rabat. 12 24 36
1. Faculty of Letters and Human Sciences/ Tétouan. 4 12 16
1. Multidisciplinary Faculty / Khouribga. 1 1 2
1. Multidisciplinary Faculty / Safi. 0 2 2
1. Multidisciplinary Faculty / Nador. 0 1 1
1. Multidisciplinary Faculty / Ouarzazate. 1 1 2
1. Multidisciplinary Faculty/ Taroudant 0 2 2
1. Multidisciplinary Faculty / Taza. 1 2 3
Total 117
(32%)
244
(68%)
361
Back

English Professors’ Use of Computer Technologies in Moroccan Universities, Hicham LAABIDI

  • 2.
    English Professors’ Useof Computer Technologies in Moroccan Universities Presented by Hicham LAABIDI Moroccan Resource Centers of English Network MoRCE-Net 5th Annual Conference Date : February, the 2nd , 2017 Venue : Marrakech, Morocco.
  • 3.
    Outline  Introduction  Reviewof Related Literature  Methodolgy  Results and Discussion  Conclusion 25
  • 4.
    Introduction • In thelast decades, much research has been carried out to investigate the use of the new technologies in the field of education. During this time, there has been a shift from the focus on what computers could offer students to how to make effective and successful use of computer technology to facilitate learning (Chapelle, 2001). • Higher educational institutions have recognized the importance of incorporating these new innovative gadgets within classroom practices. Indeed, these institutions have understood that computer technology could play a big part in transforming all the levels of education. For this reason, universities and other higher educational institutions are determined to provide the necessary devices and effective training for professors to achieve successful implementation of ICT in the classroom (Sahin & Thompson, 2006). 24
  • 5.
    GENIE Project MARWAN Project CVMProject CATT Project ALEF Project 23  Review of Related Literature The Use of ICT in Moroccan Education
  • 6.
    Methodology Research Questions : 1.To what extent do professors of English integrate ICT in their teaching? 2. What is the level of institutional support provided for professors to promote the use of ICT in their classrooms? 3. Is there any correlation between the degree of institutional support and ICT inetgration? Research Variables : 1. Professors’ use of ICT in teaching. 2. The level of institutional support. Research Design : • Mixed methods ( survey + interview) Research Population : • Profoessors’ of English language. 22
  • 7.
     Demographic Findings aboutthe Participants. 21
  • 8.
    Figure 1. Distributionof Participants by Gender. 20
  • 9.
    Figure 2. Distributionof Participants by Age 19
  • 10.
    Figure 3. Distributionof Participants by University of Affiliation. 18
  • 11.
    Figure 4. Distributionof Participants by Teaching Experience 17
  • 12.
    Figure 5. Distributionof Participants by Computer Experience 16
  • 13.
     Findings relatedto research question 1: 15
  • 14.
    Note. Mean ofthe extent of computer technology use by professors of English: 0=Never, 1=Once or twice a year, 2=Few times a year, 3=Few times a month, and 4=Several times a month. Computer Technology Use in Teaching N Mean Std. Deviation 1. How often do you use presentation programmes ( e.g. Power Point) for the delivery of instruction? 163 2,46 1,22 2. How often do you communicate with students using the internet? 163 1,25 1,40 3. How often do you create lesson plans using a computer? 163 1,94 1,44 4. How often do you download different files in Websites? 163 2,67 1,20 5. How often do you make handouts for students using a computer? 163 2,91 1,10 6. How often do you create a test using a computer? 163 1,88 1,26 7. How often do you search the internet to plan your lessons? 163 2,10 1,42 8. How often do you ask students to use resources on the internet to do different tasks? 163 1,71 1,48 9. How often do you ask students to use a computer for writing tasks? 163 1,05 1,22 10. How often do you ask students to make a presentation using computer technologies? 163 1,67 1,47 11. How often do you ask students to research using the internet during class time? 163 ,69 1,18 12. How often do you ask students to work individually or in groups using computers during class time? 163 ,58 1,08 Total ICT Use in teaching 163 1.74 1.02 14
  • 15.
     Findings relatedto research question 2: 13
  • 16.
    Level of InstitutionalSupport SD D N A SA 1. The university administrators encourage the use of the new technologies to deliver instruction. 30.10 27.00 9.80 22.70 10.40 2. The university provides training in the implementation of the new technologies in education. 40.50 28.80 14.10 12.30 4.30 3. The university provides any needed technical assistance for the faculty members. 30.70 32.50 10.40 19.00 7.40 4. The university provides any needed financial support for computer technology- based projects. 40.50 29.40 16.60 11.00 2.50 5. The university provides the computer technologies needed to develop and deliver courses. 33.10 26.40 11.00 19.60 9.80 6. The university provides training in computer technologies and technical skills. 41.10 24.50 17.20 23.50 3.70 7. The university would reward faculty members who are teaching through computer technologies. 56.40 20.20 16.60 3.70 3.10 Table2. Percent of the Level of Institutional Support Note. SD=Strongly disagree, D=Disagree, N=Neutral, A=Agree, and SA=Strongly agree. 12
  • 17.
    Level of InstitutionalSupport N Mean Std. Deviation 1. The university administrators encourage the use of the new technologies to deliver instruction. 163 2,56 1,39 1. The university provides training in the implementation of the new technologies in education. 163 2,11 1,19 1. The university provides any needed technical assistance for the faculty members. 163 2,39 1,29 1. The university provides any needed financial support for computer technology- based projects. 163 2,05 1,11 1. The university provides the computer technologies needed to develop and deliver courses. 163 2,46 1,38 1. The university provides training in computer technologies and technical skills. 163 2,14 1,20 1. The university would reward faculty members who are teaching through computer technologies. 163 1,76 1,05 Total Institutional Support 163 2.21 1.10 Table3. Means and Standard Deviations of the level of Institutional Support Note. Mean of the level of institutional support: 1=Strongly disagree, 2=Disagree, 3=Neutral, 4=Agree, and 5=Strongly agree. 11
  • 18.
     Findings relatedto research question 3: 10
  • 19.
    Correlation Professors’ Useof ICT in Teaching The Level of Institutional Support Professors’ Use of ICT in Teaching Pearson Correlation 1 ,598** Sig. (2-tailed) ,000 N 163 163 The Level of Institutional Support Pearson Correlation ,598** 1 Sig. (2-tailed) ,000 N 163 163 **. Correlation is significant at the 0.01 level (2-tailed). Table 4. Correlation between professors’ use of ICT and the level of institutional support. 9
  • 20.
    Figure 11. Meansplot for professors’ use of ICT and the level of institutional support. 8
  • 21.
  • 22.
    Interview participants thoughtthat inadequate institutional support is regarded as one of the major factors that affect professors’ use of ICT in their teaching practices. One of the respondents noted that “ lack of support from the institution is one of the reasons many teachers do not integrate CT in their classrooms” ( P7) . In fact, some of the participants stated that their institutions provided some of the required support such as data-shows, remote controls, printers, plugs and cables. Yet, they need other materials like speakers, interactive boards and mainly Internet connection. P8 said “ honestly speaking, I would like my institution to provide teachers with access to the Wifi and an electronic library”. Theme : Institutional Support 6
  • 23.
    Participants emphasized onproviding sufficient computer training for all professors to guarantee the successful implementation of ICT in their classrooms. One of the respondents commented “I would highly appreciate if my institution could provide us with good quality training” (P4) . Another professor also pointed that the university should provide “ quality training courses for teachers to enable them use CT devises to meet the needs of the new millennium learners” ( P7) . 5
  • 24.
    As for thesupport provided by the Moroccan government, the participants noted that computer programmes such as MARWAN, ITQAN, INJAZ and others are very great initiatives that encourage the integration of computer technologies in Moroccan universities. One of the participants said it’s “a good initiative deserving the thumbs up” (P11). Another one commented “personally, I appreciate this policy since information and communication technology has become an essential section of most organisations these days” (P4). P8 shared the same perspective and added that such technology programmes are crucial “because technology is part of students’ daily lives. Therefore, teachers have to use computer technology to introduce, reinforce, extend, enrich, and remediate students’ mastery of curricular goals” (P8). 4
  • 25.
    However, the majorityof the participants are not satisfied with the actual implementation of these programmes within classrooms. Indeed, “there is a mismatch between what the Moroccan government expresses and the actual facilitations of integrating computer technology” (P5). One of the participants reported “I think the government’s policy has proved to be unsuccessful in the sense that it has spent huge budgets on Genie project, for example, and other initiatives, but the impact of such programs on teachers’ teaching practices in Moroccan schools is almost absent”. 3
  • 26.
    P6 also notedthat it’s “a good initiative, but it is still unsatisfactory; more materials and budgets should be allocated to integrating CT in education. In fact we are still lagging behind in comparison to some North African countries”. 2
  • 27.
    Conclusion Computer technologies havebecome significant educational tools in Moroccan higher education. However, the value of these gadgets relies on how effectively professors integrate them in their teaching. 1
  • 28.
  • 29.
    The scale usedto interpret the means of ICT inetgration in teaching Low level of ICT integration From 0.50 to 1.49 Moderate level of ICT integration From 1.50 to 2.49 High level of ICT Integration 2.50 to 4.00 Note. Mean of the extent of computer technology use by professors of English: 0=Never, 1=Once or twice a year, 2=Few times a year, 3=Few times a month, and 4=Several times a month. Back
  • 30.
    The scale usedto interpret the means of the level of institutional support Low level of Institutional support From 1.00 to 2.49 Moderate level of Institutional support From 2.50 to 3.49 High level of Institutional support 3.50 to 5.00 Note. Mean of the level of institutional support: 1=Strongly disagree, 2=Disagree, 3=Neutral, 4=Agree, and 5=Strongly agree. Back
  • 31.
    The scale usedto interpret the correlation coefficient (Davis,1971) negeligible 0.00 to 0.09 low 0.10 to 0.29 moderate 0.30 to 0.49 strong 0.50 to 0.69 Very strong 0.70 to 1.00 Back
  • 32.
    Faculty Females MalesTotal 1. Faculty of Letters and Human Sciences/ Agadir. 8 27 35 1. Faculty of Letters and Human Sciences/ Ain Chck, Casablanca. 16 16 32 1. Faculty of Letters and Human Sciences/ Ben M’Sick, Casablanca. 4 14 18 1. Faculty of Letters and Human Sciences/ Beni Mellal. 5 11 16 1. Faculty of Letters and Human Sciences/ Dhar El Mahraz, Fez. 8 15 23 1. Faculty of Letters and Human Sciences/ Sais, Fez. 4 13 17 1. Faculty of Letters and Human Sciences/ El Jadida. 6 21 27 1. Faculty of Letters and Human Sciences/ Kenitra. 6 15 21 1. Faculty of Letters and Human Sciences/ Marrakech. 17 18 35 1. Faculty of Letters and Human Sciences/ Meknés. 8 23 31 1. Faculty of Letters and Human Sciences/ Mohammedia. 7 12 19 1. Faculty of Letters and Human Sciences/ Oujda. 9 14 23 1. Faculty of Letters and Human Sciences/ Rabat. 12 24 36 1. Faculty of Letters and Human Sciences/ Tétouan. 4 12 16 1. Multidisciplinary Faculty / Khouribga. 1 1 2 1. Multidisciplinary Faculty / Safi. 0 2 2 1. Multidisciplinary Faculty / Nador. 0 1 1 1. Multidisciplinary Faculty / Ouarzazate. 1 1 2 1. Multidisciplinary Faculty/ Taroudant 0 2 2 1. Multidisciplinary Faculty / Taza. 1 2 3 Total 117 (32%) 244 (68%) 361 Back