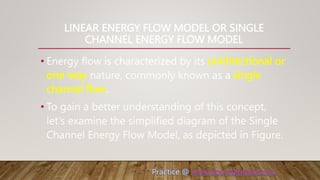
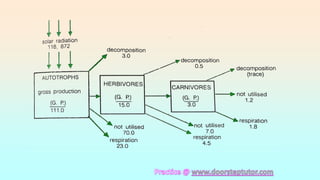
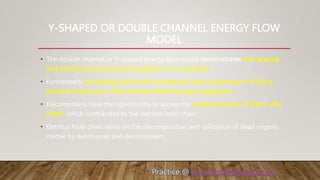
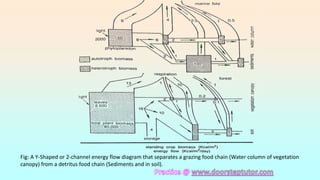
The document discusses energy flow through ecosystems. It describes how energy moves from primary producers like plants through primary, secondary and tertiary consumers, and finally to decomposers. It then summarizes several models used to represent energy flow, including the linear model showing a single direction of flow, the Y-shaped model accounting for both grazing and detritus food chains, and the universal model depicting comprehensive energy interactions within a system.

![PRODUCER CONSUMERS
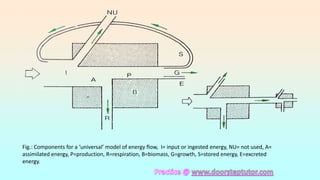
[I- total energy input, LA – light absorbed by plant cover, PG – gross primary production, A – total assimilation, PN –
net primary production, P – Secondary production, NU – Energy not used (stored), NA – Energy not assimilated by
consumers (egested), R – respiration. Bottom line in the diagram shows the order of the magnitude of energy losses
expected at major transfer points, starting with a solar input of 3,000 Kcal per square meter per day. (After E.P. Odum,
1963)]](https://image.slidesharecdn.com/energyflowinecosystem-231230043042-1d08622c/85/Energy-flow-in-ecosystem-pptx-8-320.jpg)


![4 [Biodiversity 1] - Latest Res (1).ppt](https://cdn.slidesharecdn.com/ss_thumbnails/4biodiversity1-latestres1-231230050500-829153a6-thumbnail.jpg?width=640&height=640&fit=bounds)


