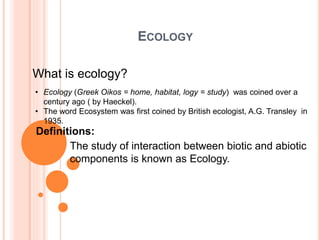
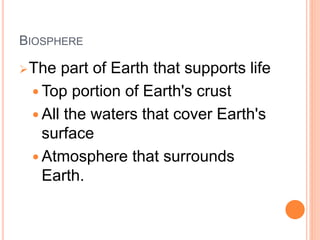
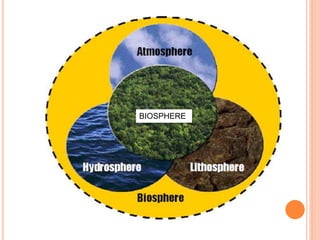
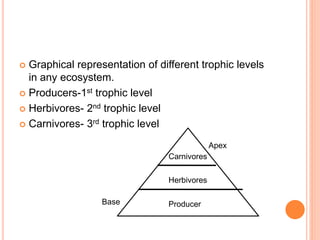
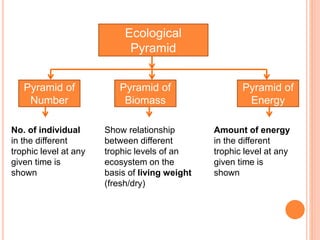
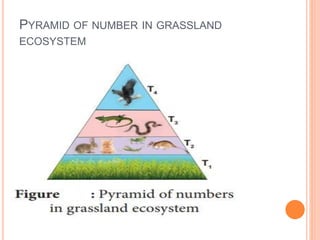
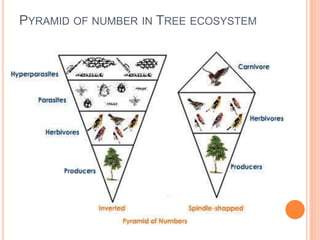
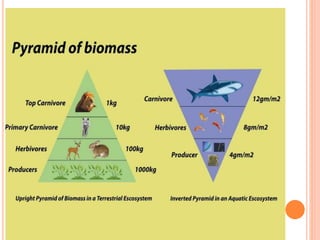
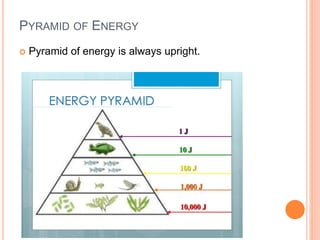
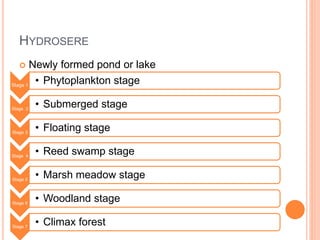
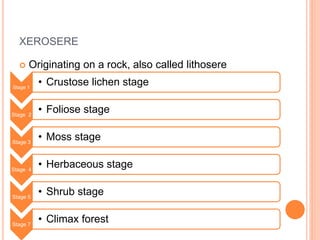
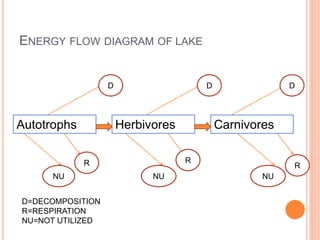
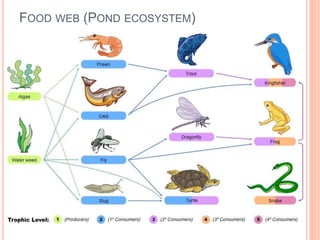
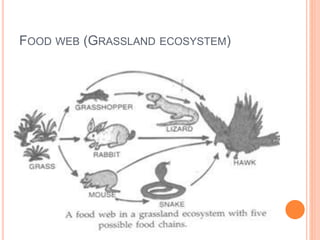
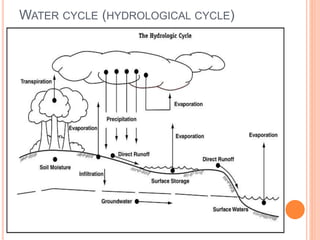
The document provides an overview of ecology, defining it as the study of interactions between biotic and abiotic components of ecosystems. It describes various ecosystems, the roles of producers and consumers, ecological succession, energy flow, and biogeochemical cycles, along with the classification of biomes. Key concepts include trophic levels, competition, and the significance of food chains and webs in ecological energy transfer.
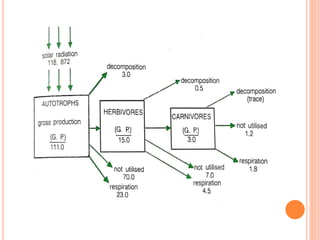
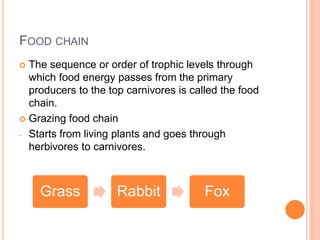
![PRODUC
ER
CONSUM
ERS
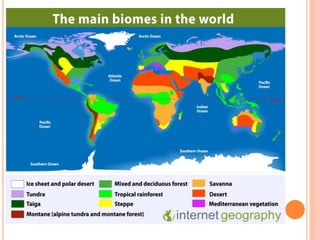
[I- total energy input, LA – light absorbed by plant cover, PG – gross primary
production, A – total assimilation, PN – net primary production, P – Secondary
production, NU – Energy not used (stored), NA – Energy not assimilated by
consumers (egested), R – respiration. Bottom line in the diagram shows the
order of the magnitude of energy losses expected at major transfer points,
starting with a solar input of 3,000 Kcal per square meter per day. (After E.P.
Odum, 1963)]](https://image.slidesharecdn.com/3-231230045947-73eed8e6/85/3-Ecosystem-ppt-38-320.jpg)


![4 [Biodiversity 1] - Latest Res (1).ppt](https://cdn.slidesharecdn.com/ss_thumbnails/4biodiversity1-latestres1-231230050500-829153a6-thumbnail.jpg?width=640&height=640&fit=bounds)


