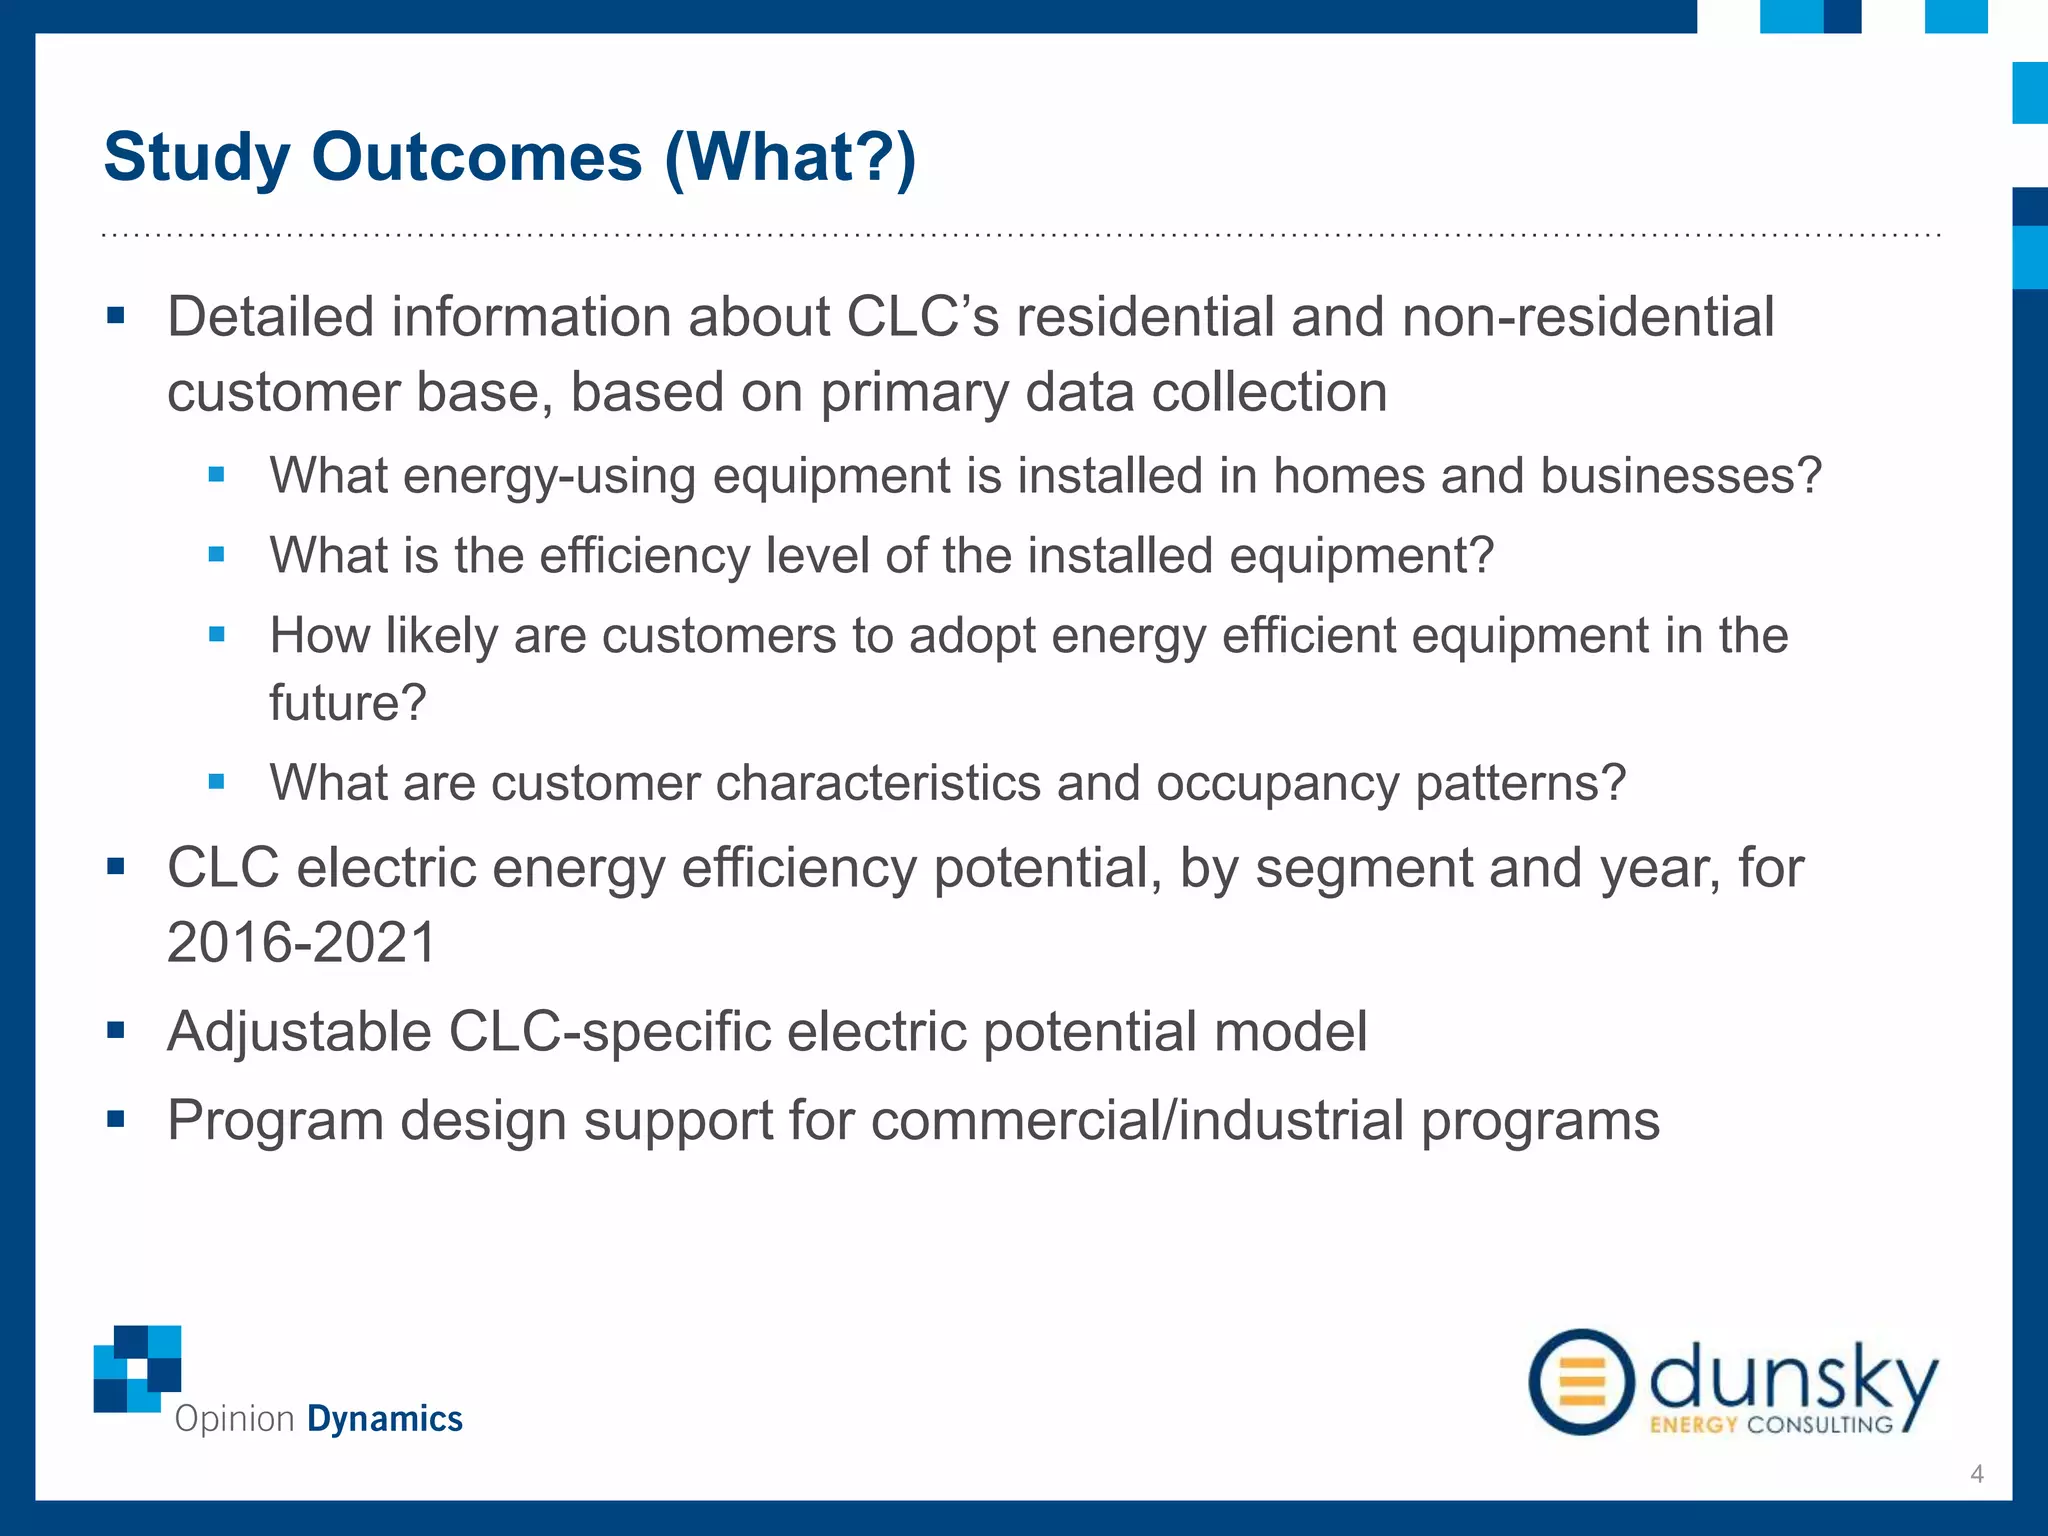
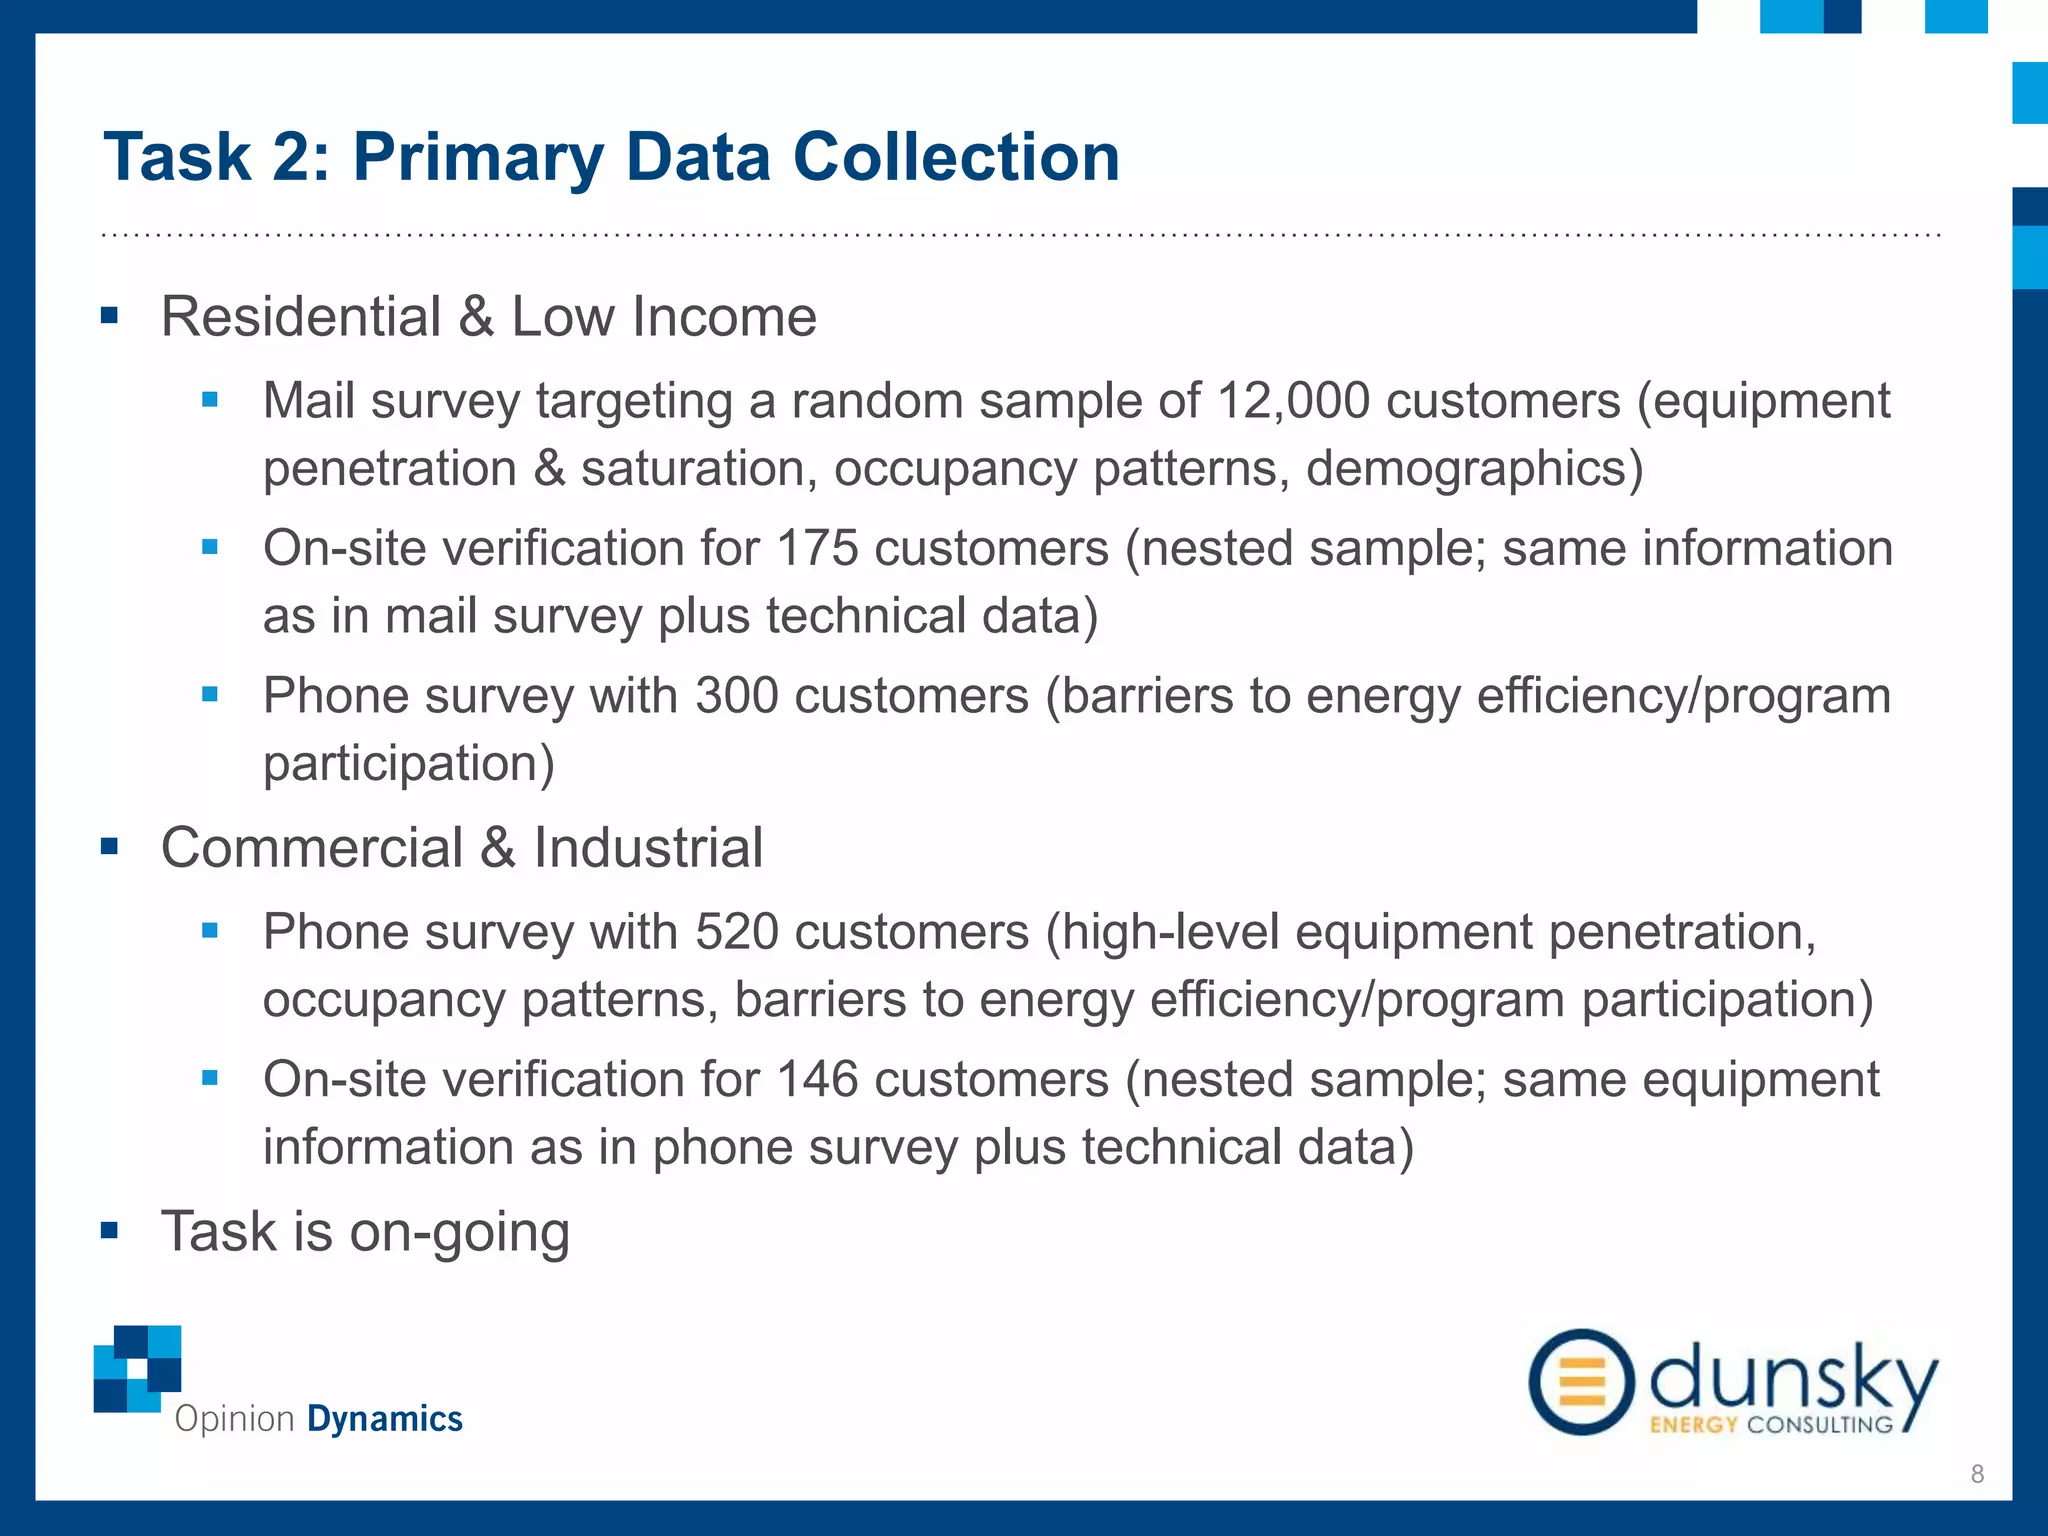
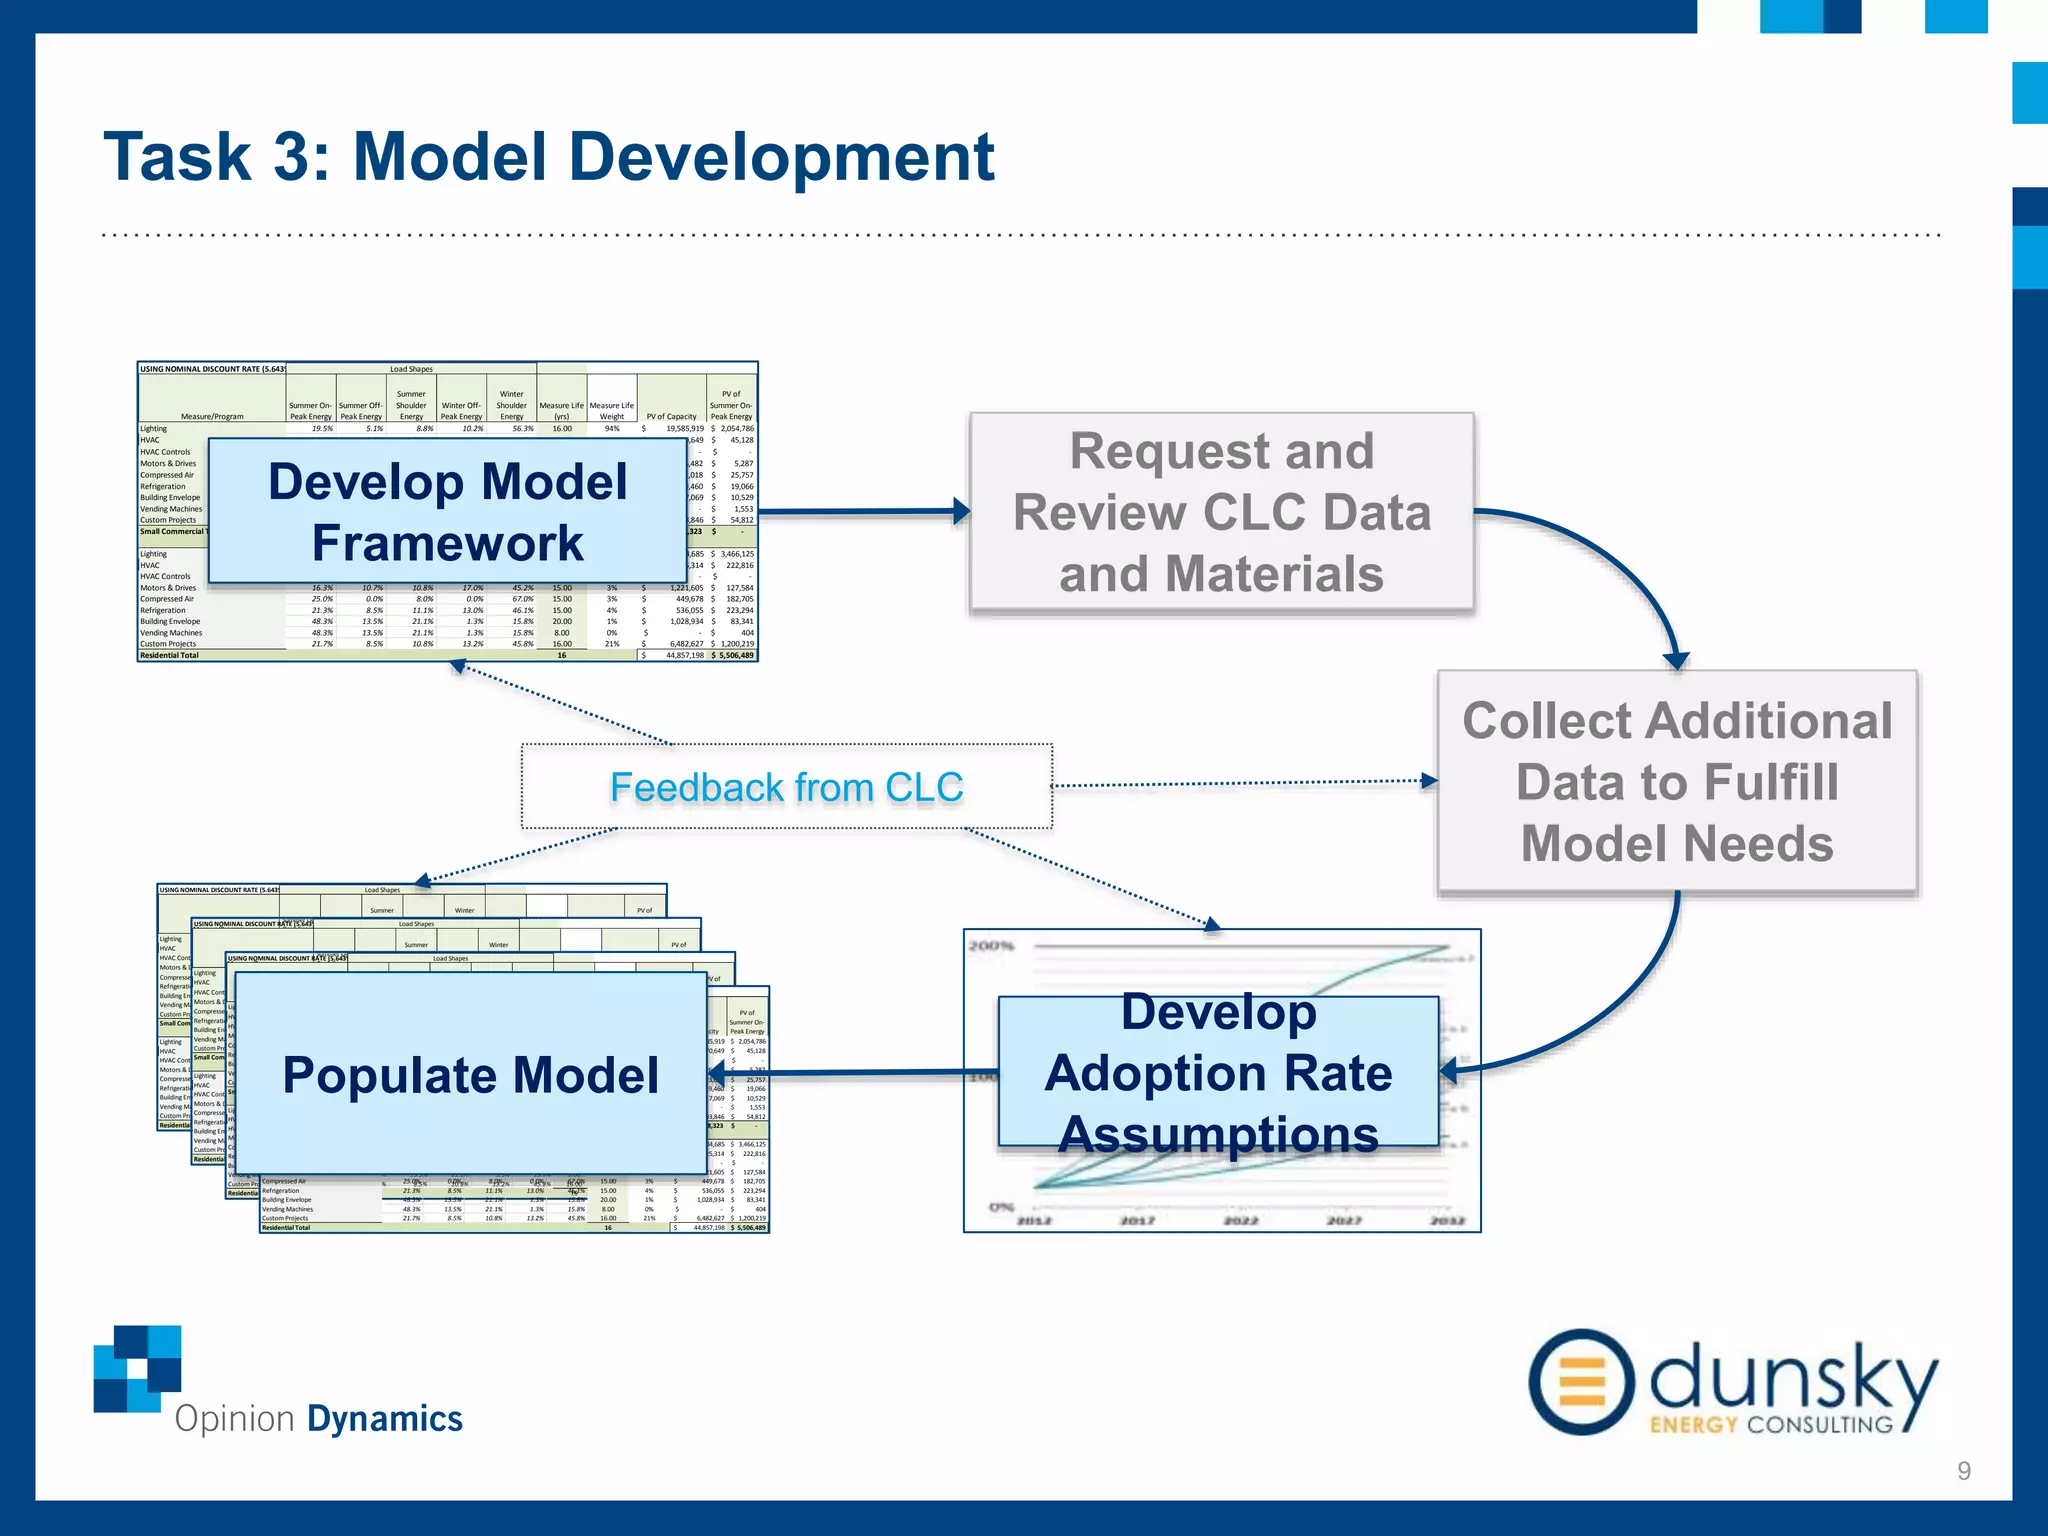
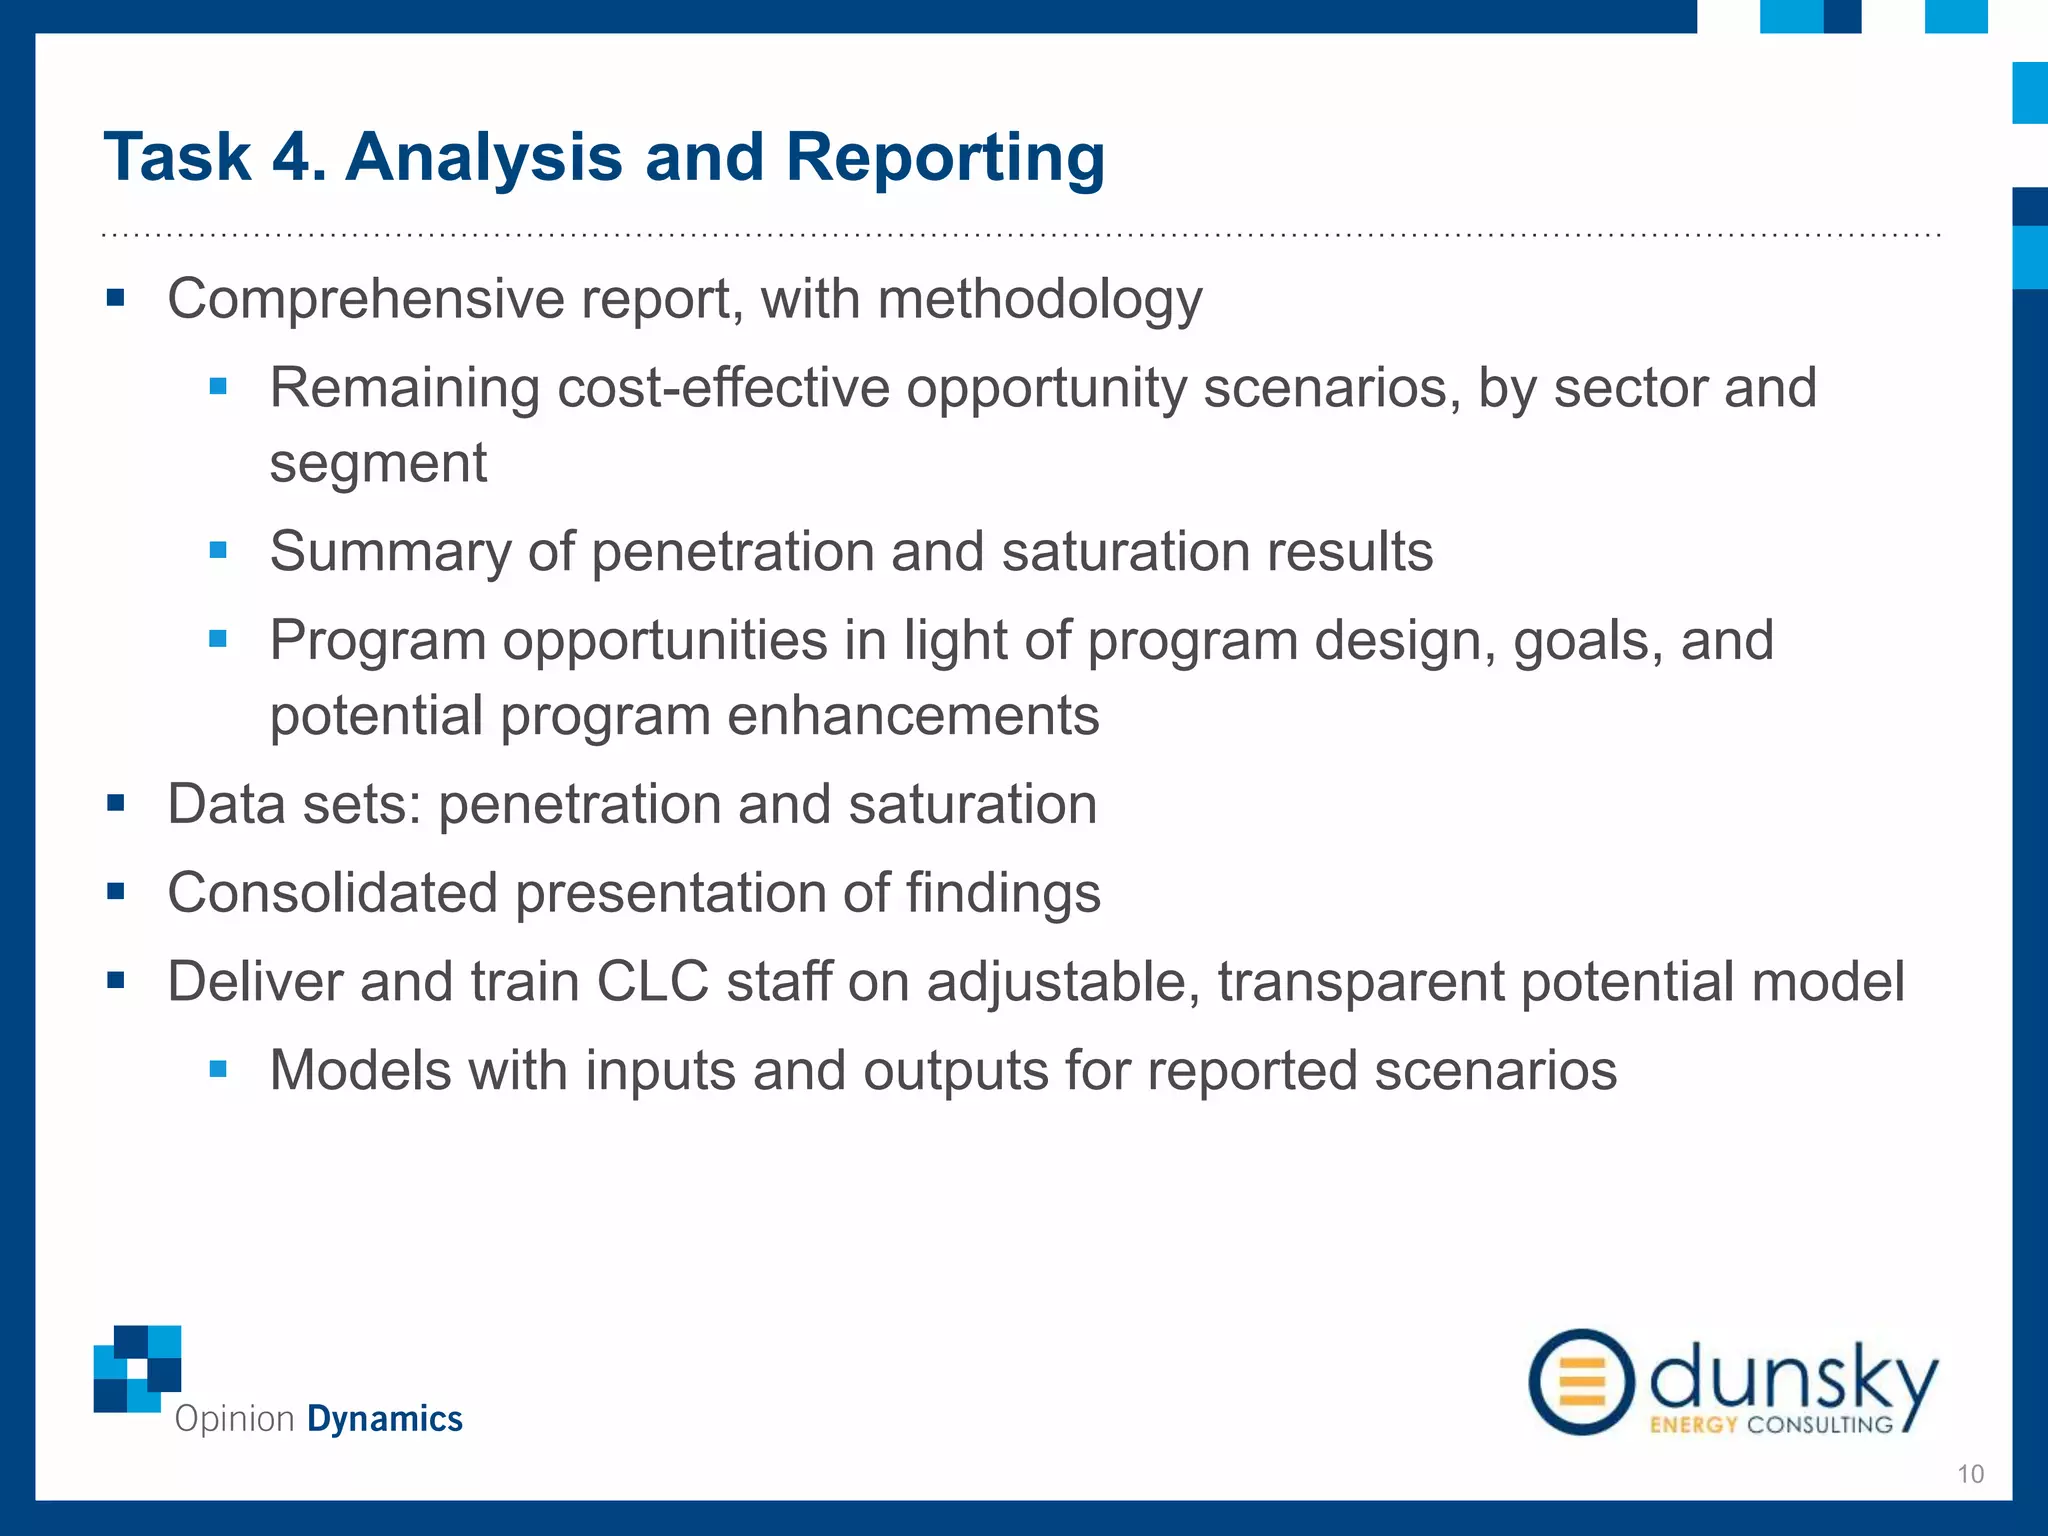
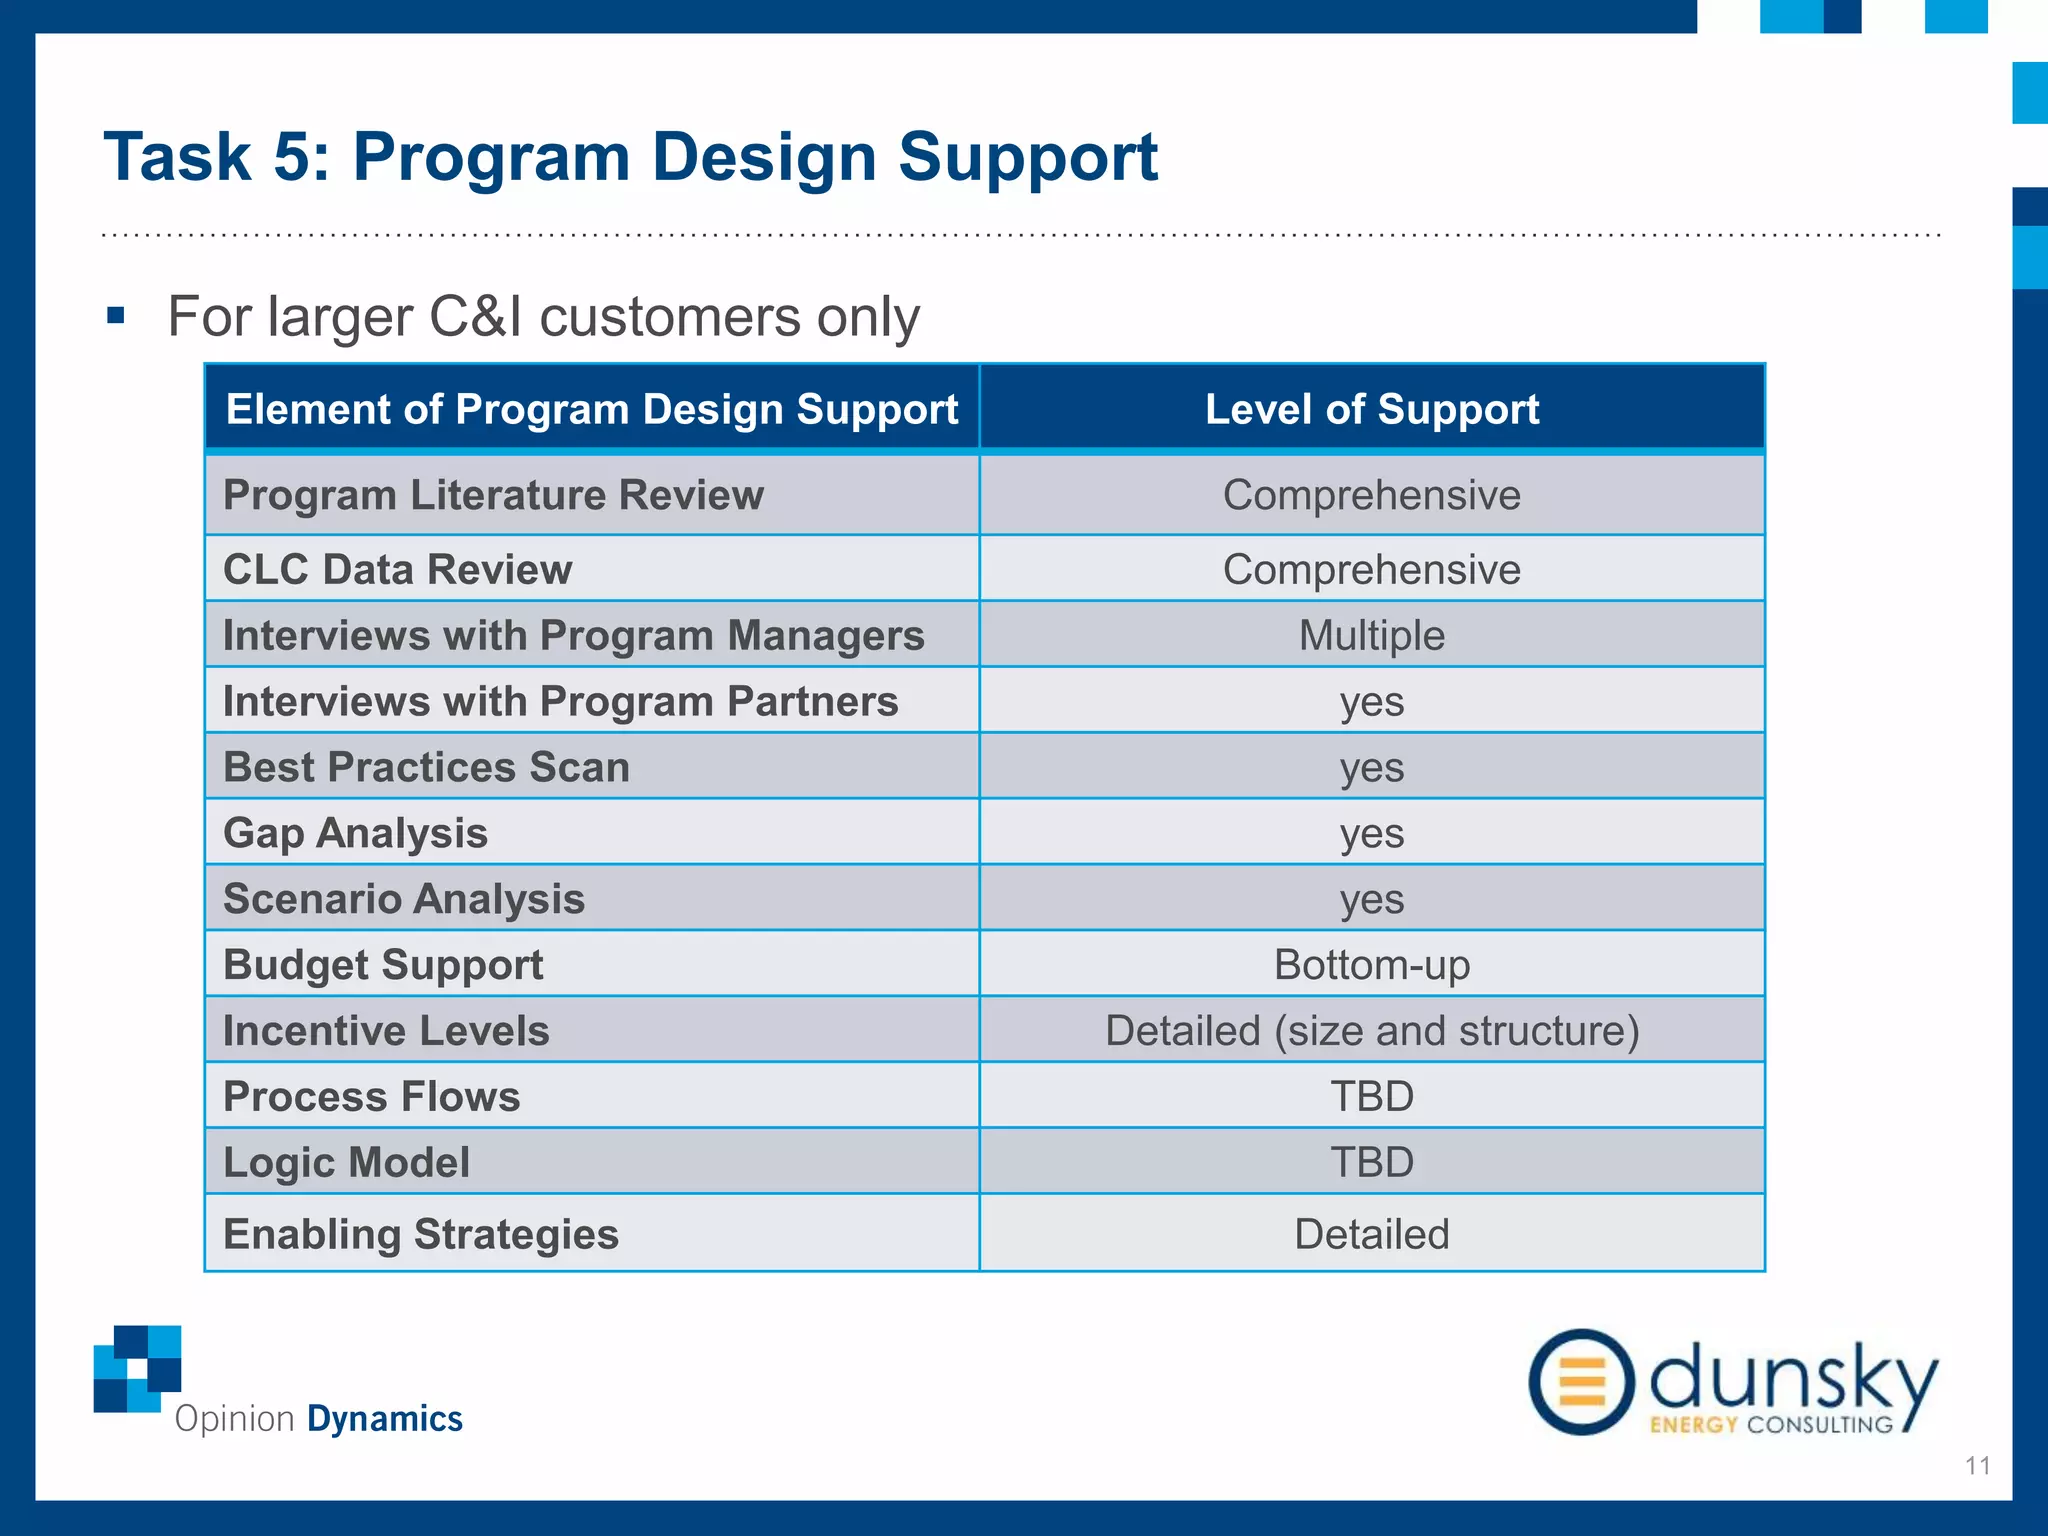
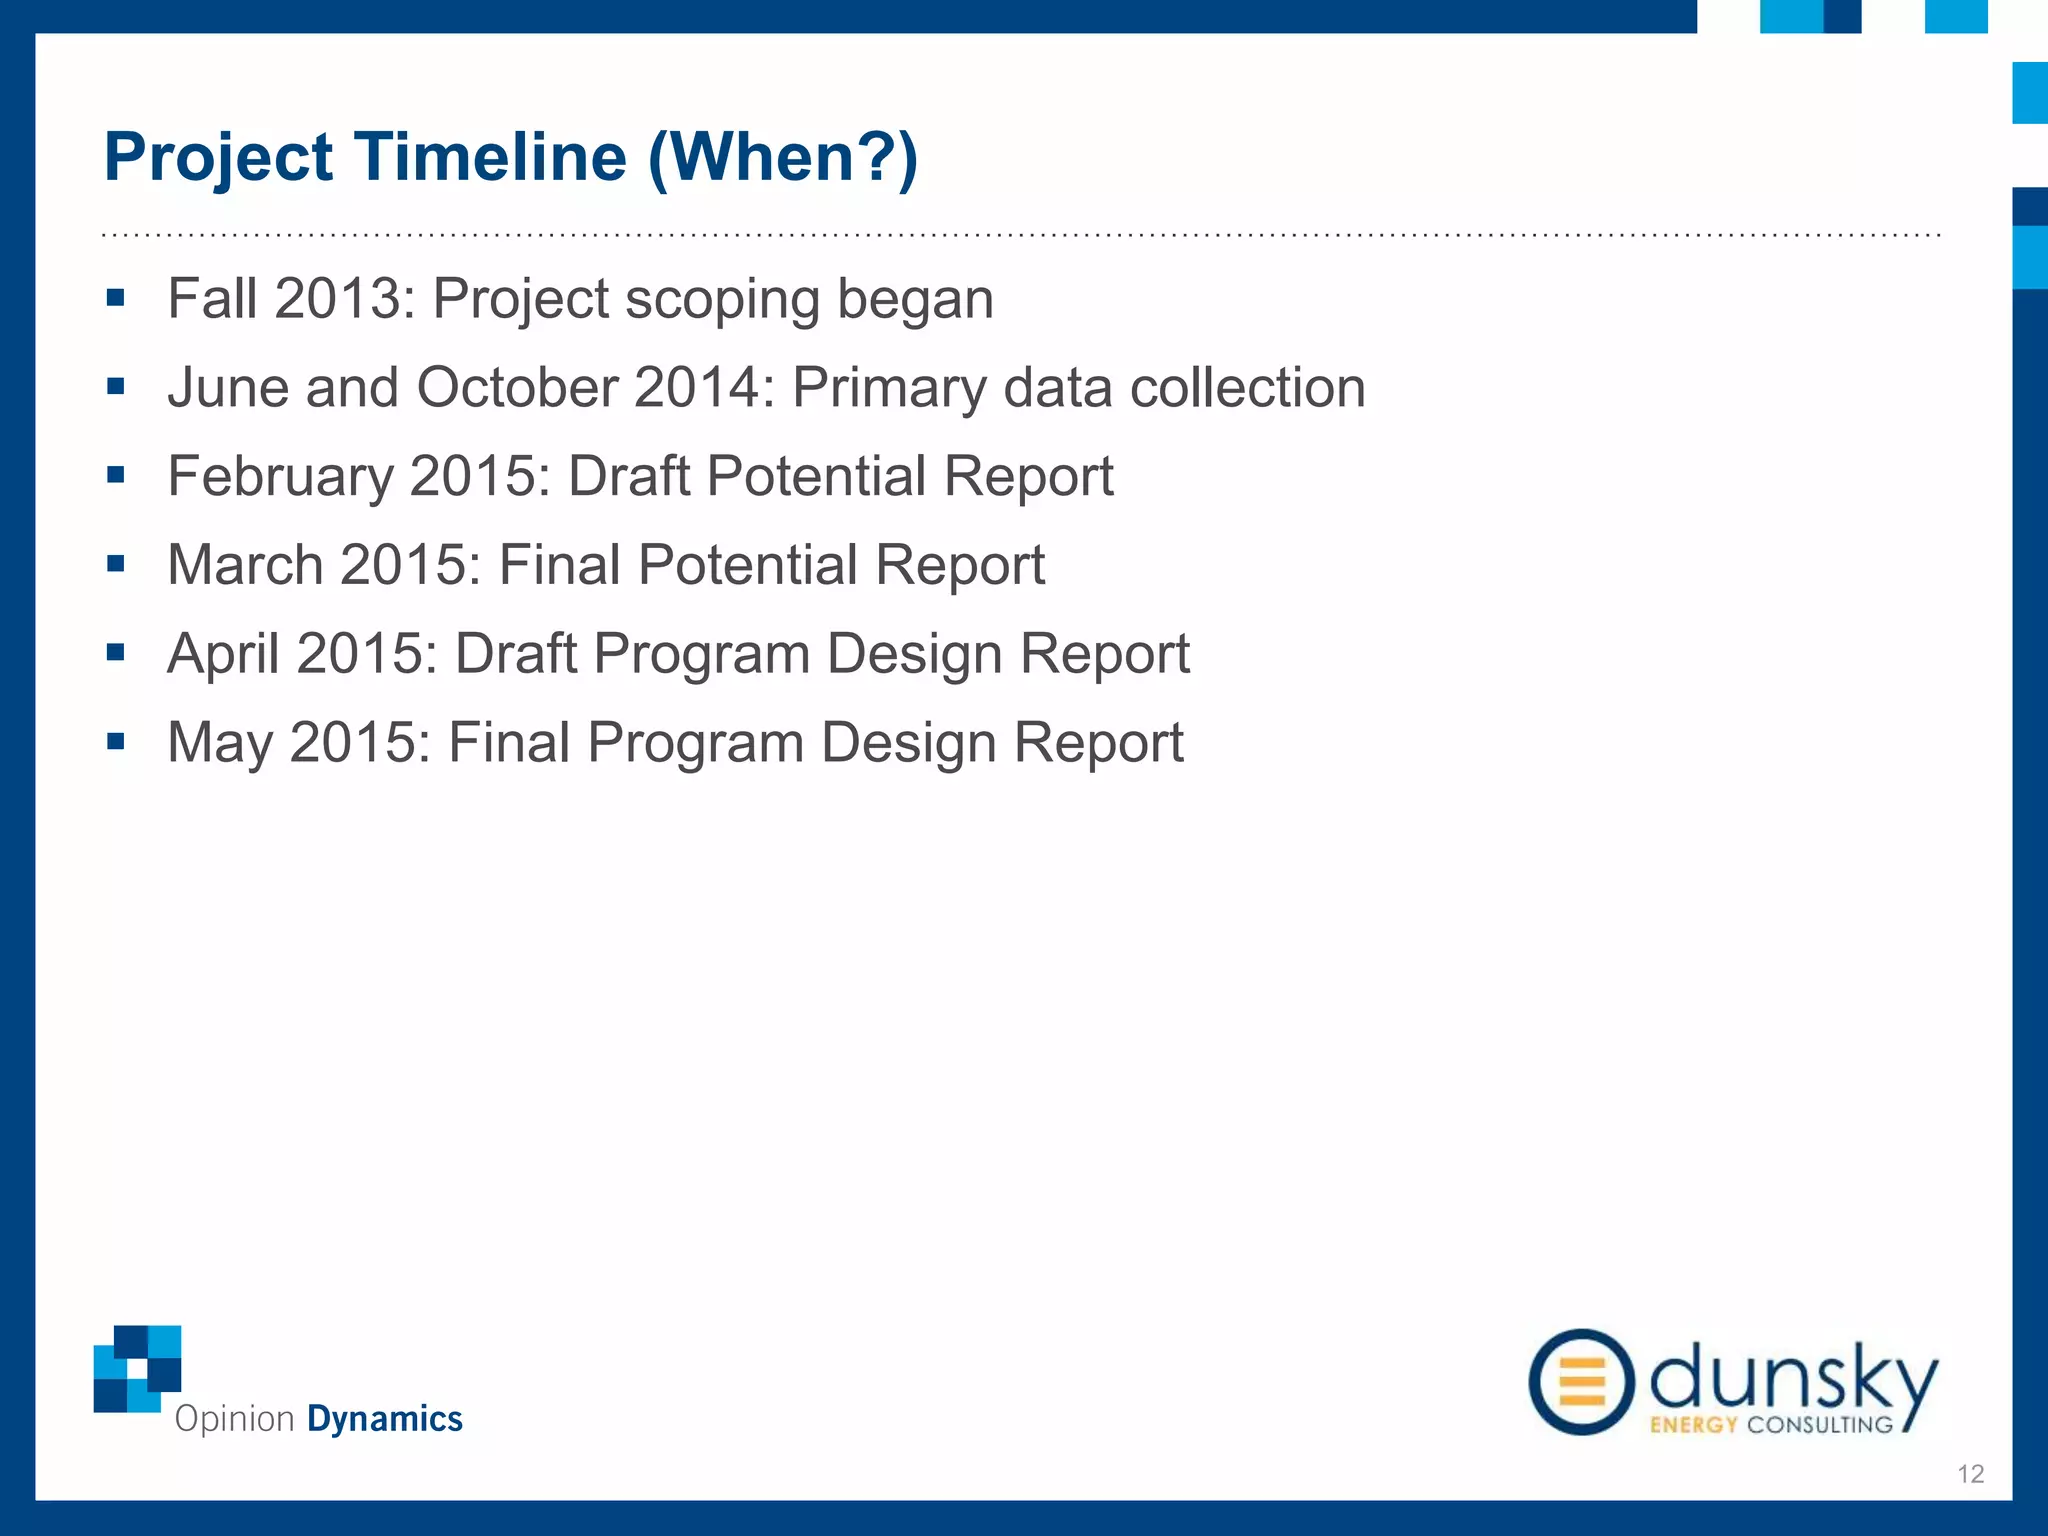
CLC POTENTIAL & PROGRAM
OPPORTUNITIES STUDY
Board Meeting
6/11/2014
Agenda
2
 The Project Team (Who?)
 Study Outcomes (What?)
 Regulatory Requirements and Goals (Why?)
 Project Tasks (How?)
 Project Timeline (When?)
The Project Team (Who?)
3
 Opinion Dynamics Corporation
 Headquartered in Waltham, Massachusetts
 One of the leading energy efficiency research and evaluation companies
 Extensive local experience (and local presence)
 Subcontractors
 Dunsky Energy Consulting
 Mad Dash Inc.
Study Outcomes (What?)
4
 Detailed information about CLC’s residential and non-residential
customer base, based on primary data collection
 What energy-using equipment is installed in homes and businesses?
 What is the efficiency level of the installed equipment?
 How likely are customers to adopt energy efficient equipment in the
future?
 What are customer characteristics and occupancy patterns?
 CLC electric energy efficiency potential, by segment and year, for
2016-2021
 Adjustable CLC-specific electric potential model
 Program design support for commercial/industrial programs
Regulatory Requirements and Goals (Why?)
5
 Comply with DPU requirement to document the penetration of energy
efficiency within its service territory and develop estimates of
remaining savings potential (D.P.U. 12-107, dated 1/31/2013).
 Collect wealth of CLC-specific information
 Inform the next three-year energy efficiency plan
 Support design enhancements to non-residential programs
“The Program Administrators with an aggregate three-year
savings goal of greater than 20 percent below the statewide
three-year aggregate goal will conduct a study, either jointly or
individually, during the upcoming three-year term to document
the penetration of energy efficiency within its service territory
and the remaining cost-effective energy efficiency
opportunities available.”
Overview of Tasks (How?)
6
 Task 1: Study planning and scoping
 Task 2: Primary data collection
 Task 3: Model development
 Task 4: Analysis and reporting
 Task 5: Program design support
Task 1: Study Planning and Scoping
7
 Worked closely with CLC staff to define the study scope, project
outcomes, deliverables, and budget
 Reviewed existing CLC data
 Determined required primary research approaches and sample sizes
 Determined the appropriate potential model framework
 Determined level of detail required for various study components
 Developed detailed work plan outlining the approach, project timeline,
and budget
 Task is completed
Task 2: Primary Data Collection
8
 Residential & Low Income
 Mail survey targeting a random sample of 12,000 customers (equipment
penetration & saturation, occupancy patterns, demographics)
 On-site verification for 175 customers (nested sample; same information
as in mail survey plus technical data)
 Phone survey with 300 customers (barriers to energy efficiency/program
participation)
 Commercial & Industrial
 Phone survey with 520 customers (high-level equipment penetration,
occupancy patterns, barriers to energy efficiency/program participation)
 On-site verification for 146 customers (nested sample; same equipment
information as in phone survey plus technical data)
 Task is on-going
Task 3: Model Development
9
USING NOMINAL DISCOUNT RATE (5.643%)
Measure/Program
Summer On-
Peak Energy
Summer Off-
Peak Energy
Summer
Shoulder
Energy
Winter Off-
Peak Energy
Winter
Shoulder
Energy
Measure Life
(yrs)
Measure Life
Weight PV of Capacity
PV of
Summer On-
Peak Energy
Lighting 19.5% 5.1% 8.8% 10.2% 56.3% 16.00 94% $ 19,585,919 $ 2,054,786
HVAC 48.3% 13.5% 21.1% 1.3% 15.8% 15.00 1% $ 570,649 $ 45,128
HVAC Controls 48.3% 13.5% 21.1% 1.3% 15.8% 8.00 0% $ - $ -
Motors & Drives 16.3% 10.7% 10.8% 17.0% 45.2% 15.00 0% $ 76,482 $ 5,287
Compressed Air 25.0% 0.0% 8.0% 0.0% 67.0% 15.00 1% $ 73,018 $ 25,757
Refrigeration 21.3% 8.5% 11.1% 13.0% 46.1% 15.00 1% $ 39,460 $ 19,066
Building Envelope 48.3% 13.5% 21.1% 1.3% 15.8% 20.00 0% $ 117,069 $ 10,529
Vending Machines 48.3% 13.5% 21.1% 1.3% 15.8% 8.00 0% $ - $ 1,553
Custom Projects 21.7% 8.5% 10.8% 13.2% 45.8% 16.00 2% $ 193,846 $ 54,812
Small Commercial Total 15.97 19,798,323$ -$
Lighting 19.5% 5.1% 8.8% 10.2% 56.3% 16.00 67% $ 32,684,685 $ 3,466,125
HVAC 48.3% 13.5% 21.1% 1.3% 15.8% 15.00 2% $ 2,425,314 $ 222,816
HVAC Controls 48.3% 13.5% 21.1% 1.3% 15.8% 8.00 0% $ - $ -
Motors & Drives 16.3% 10.7% 10.8% 17.0% 45.2% 15.00 3% $ 1,221,605 $ 127,584
Compressed Air 25.0% 0.0% 8.0% 0.0% 67.0% 15.00 3% $ 449,678 $ 182,705
Refrigeration 21.3% 8.5% 11.1% 13.0% 46.1% 15.00 4% $ 536,055 $ 223,294
Building Envelope 48.3% 13.5% 21.1% 1.3% 15.8% 20.00 1% $ 1,028,934 $ 83,341
Vending Machines 48.3% 13.5% 21.1% 1.3% 15.8% 8.00 0% $ - $ 404
Custom Projects 21.7% 8.5% 10.8% 13.2% 45.8% 16.00 21% $ 6,482,627 $ 1,200,219
Residential Total 16 $ 44,857,198 $ 5,506,489
Load Shapes
Develop Model
Framework
Request and
Review CLC Data
and Materials
Collect Additional
Data to Fulfill
Model Needs
USING NOMINAL DISCOUNT RATE (5.643%)
Measure/Program
Summer On-
Peak Energy
Summer Off-
Peak Energy
Summer
Shoulder
Energy
Winter Off-
Peak Energy
Winter
Shoulder
Energy
Measure Life
(yrs)
Measure Life
Weight PV of Capacity
PV of
Summer On-
Peak Energy
Lighting 19.5% 5.1% 8.8% 10.2% 56.3% 16.00 94% $ 19,585,919 $ 2,054,786
HVAC 48.3% 13.5% 21.1% 1.3% 15.8% 15.00 1% $ 570,649 $ 45,128
HVAC Controls 48.3% 13.5% 21.1% 1.3% 15.8% 8.00 0% $ - $ -
Motors & Drives 16.3% 10.7% 10.8% 17.0% 45.2% 15.00 0% $ 76,482 $ 5,287
Compressed Air 25.0% 0.0% 8.0% 0.0% 67.0% 15.00 1% $ 73,018 $ 25,757
Refrigeration 21.3% 8.5% 11.1% 13.0% 46.1% 15.00 1% $ 39,460 $ 19,066
Building Envelope 48.3% 13.5% 21.1% 1.3% 15.8% 20.00 0% $ 117,069 $ 10,529
Vending Machines 48.3% 13.5% 21.1% 1.3% 15.8% 8.00 0% $ - $ 1,553
Custom Projects 21.7% 8.5% 10.8% 13.2% 45.8% 16.00 2% $ 193,846 $ 54,812
Small Commercial Total 15.97 19,798,323$ -$
Lighting 19.5% 5.1% 8.8% 10.2% 56.3% 16.00 67% $ 32,684,685 $ 3,466,125
HVAC 48.3% 13.5% 21.1% 1.3% 15.8% 15.00 2% $ 2,425,314 $ 222,816
HVAC Controls 48.3% 13.5% 21.1% 1.3% 15.8% 8.00 0% $ - $ -
Motors & Drives 16.3% 10.7% 10.8% 17.0% 45.2% 15.00 3% $ 1,221,605 $ 127,584
Compressed Air 25.0% 0.0% 8.0% 0.0% 67.0% 15.00 3% $ 449,678 $ 182,705
Refrigeration 21.3% 8.5% 11.1% 13.0% 46.1% 15.00 4% $ 536,055 $ 223,294
Building Envelope 48.3% 13.5% 21.1% 1.3% 15.8% 20.00 1% $ 1,028,934 $ 83,341
Vending Machines 48.3% 13.5% 21.1% 1.3% 15.8% 8.00 0% $ - $ 404
Custom Projects 21.7% 8.5% 10.8% 13.2% 45.8% 16.00 21% $ 6,482,627 $ 1,200,219
Residential Total 16 $ 44,857,198 $ 5,506,489
Load Shapes
Populate Model
Develop
Adoption Rate
Assumptions
Feedback from CLC
Task 4. Analysis and Reporting
10
 Comprehensive report, with methodology
 Remaining cost-effective opportunity scenarios, by sector and
segment
 Summary of penetration and saturation results
 Program opportunities in light of program design, goals, and
potential program enhancements
 Data sets: penetration and saturation
 Consolidated presentation of findings
 Deliver and train CLC staff on adjustable, transparent potential model
 Models with inputs and outputs for reported scenarios
Task 5: Program Design Support
11
Element of Program Design Support Level of Support
Program Literature Review Comprehensive
CLC Data Review Comprehensive
Interviews with Program Managers Multiple
Interviews with Program Partners yes
Best Practices Scan yes
Gap Analysis yes
Scenario Analysis yes
Budget Support Bottom-up
Incentive Levels Detailed (size and structure)
Process Flows TBD
Logic Model TBD
Enabling Strategies Detailed
 For larger C&I customers only
Project Timeline (When?)
12
 Fall 2013: Project scoping began
 June and October 2014: Primary data collection
 February 2015: Draft Potential Report
 March 2015: Final Potential Report
 April 2015: Draft Program Design Report
 May 2015: Final Program Design Report
Questions & Answers
13

Potential Study Presentation - 6/11/14

  • 1.
    CLC POTENTIAL &PROGRAM OPPORTUNITIES STUDY Board Meeting 6/11/2014
  • 2.
    Agenda 2  The ProjectTeam (Who?)  Study Outcomes (What?)  Regulatory Requirements and Goals (Why?)  Project Tasks (How?)  Project Timeline (When?)
  • 3.
    The Project Team(Who?) 3  Opinion Dynamics Corporation  Headquartered in Waltham, Massachusetts  One of the leading energy efficiency research and evaluation companies  Extensive local experience (and local presence)  Subcontractors  Dunsky Energy Consulting  Mad Dash Inc.
  • 4.
    Study Outcomes (What?) 4 Detailed information about CLC’s residential and non-residential customer base, based on primary data collection  What energy-using equipment is installed in homes and businesses?  What is the efficiency level of the installed equipment?  How likely are customers to adopt energy efficient equipment in the future?  What are customer characteristics and occupancy patterns?  CLC electric energy efficiency potential, by segment and year, for 2016-2021  Adjustable CLC-specific electric potential model  Program design support for commercial/industrial programs
  • 5.
    Regulatory Requirements andGoals (Why?) 5  Comply with DPU requirement to document the penetration of energy efficiency within its service territory and develop estimates of remaining savings potential (D.P.U. 12-107, dated 1/31/2013).  Collect wealth of CLC-specific information  Inform the next three-year energy efficiency plan  Support design enhancements to non-residential programs “The Program Administrators with an aggregate three-year savings goal of greater than 20 percent below the statewide three-year aggregate goal will conduct a study, either jointly or individually, during the upcoming three-year term to document the penetration of energy efficiency within its service territory and the remaining cost-effective energy efficiency opportunities available.”
  • 6.
    Overview of Tasks(How?) 6  Task 1: Study planning and scoping  Task 2: Primary data collection  Task 3: Model development  Task 4: Analysis and reporting  Task 5: Program design support
  • 7.
    Task 1: StudyPlanning and Scoping 7  Worked closely with CLC staff to define the study scope, project outcomes, deliverables, and budget  Reviewed existing CLC data  Determined required primary research approaches and sample sizes  Determined the appropriate potential model framework  Determined level of detail required for various study components  Developed detailed work plan outlining the approach, project timeline, and budget  Task is completed
  • 8.
    Task 2: PrimaryData Collection 8  Residential & Low Income  Mail survey targeting a random sample of 12,000 customers (equipment penetration & saturation, occupancy patterns, demographics)  On-site verification for 175 customers (nested sample; same information as in mail survey plus technical data)  Phone survey with 300 customers (barriers to energy efficiency/program participation)  Commercial & Industrial  Phone survey with 520 customers (high-level equipment penetration, occupancy patterns, barriers to energy efficiency/program participation)  On-site verification for 146 customers (nested sample; same equipment information as in phone survey plus technical data)  Task is on-going
  • 9.
    Task 3: ModelDevelopment 9 USING NOMINAL DISCOUNT RATE (5.643%) Measure/Program Summer On- Peak Energy Summer Off- Peak Energy Summer Shoulder Energy Winter Off- Peak Energy Winter Shoulder Energy Measure Life (yrs) Measure Life Weight PV of Capacity PV of Summer On- Peak Energy Lighting 19.5% 5.1% 8.8% 10.2% 56.3% 16.00 94% $ 19,585,919 $ 2,054,786 HVAC 48.3% 13.5% 21.1% 1.3% 15.8% 15.00 1% $ 570,649 $ 45,128 HVAC Controls 48.3% 13.5% 21.1% 1.3% 15.8% 8.00 0% $ - $ - Motors & Drives 16.3% 10.7% 10.8% 17.0% 45.2% 15.00 0% $ 76,482 $ 5,287 Compressed Air 25.0% 0.0% 8.0% 0.0% 67.0% 15.00 1% $ 73,018 $ 25,757 Refrigeration 21.3% 8.5% 11.1% 13.0% 46.1% 15.00 1% $ 39,460 $ 19,066 Building Envelope 48.3% 13.5% 21.1% 1.3% 15.8% 20.00 0% $ 117,069 $ 10,529 Vending Machines 48.3% 13.5% 21.1% 1.3% 15.8% 8.00 0% $ - $ 1,553 Custom Projects 21.7% 8.5% 10.8% 13.2% 45.8% 16.00 2% $ 193,846 $ 54,812 Small Commercial Total 15.97 19,798,323$ -$ Lighting 19.5% 5.1% 8.8% 10.2% 56.3% 16.00 67% $ 32,684,685 $ 3,466,125 HVAC 48.3% 13.5% 21.1% 1.3% 15.8% 15.00 2% $ 2,425,314 $ 222,816 HVAC Controls 48.3% 13.5% 21.1% 1.3% 15.8% 8.00 0% $ - $ - Motors & Drives 16.3% 10.7% 10.8% 17.0% 45.2% 15.00 3% $ 1,221,605 $ 127,584 Compressed Air 25.0% 0.0% 8.0% 0.0% 67.0% 15.00 3% $ 449,678 $ 182,705 Refrigeration 21.3% 8.5% 11.1% 13.0% 46.1% 15.00 4% $ 536,055 $ 223,294 Building Envelope 48.3% 13.5% 21.1% 1.3% 15.8% 20.00 1% $ 1,028,934 $ 83,341 Vending Machines 48.3% 13.5% 21.1% 1.3% 15.8% 8.00 0% $ - $ 404 Custom Projects 21.7% 8.5% 10.8% 13.2% 45.8% 16.00 21% $ 6,482,627 $ 1,200,219 Residential Total 16 $ 44,857,198 $ 5,506,489 Load Shapes Develop Model Framework Request and Review CLC Data and Materials Collect Additional Data to Fulfill Model Needs USING NOMINAL DISCOUNT RATE (5.643%) Measure/Program Summer On- Peak Energy Summer Off- Peak Energy Summer Shoulder Energy Winter Off- Peak Energy Winter Shoulder Energy Measure Life (yrs) Measure Life Weight PV of Capacity PV of Summer On- Peak Energy Lighting 19.5% 5.1% 8.8% 10.2% 56.3% 16.00 94% $ 19,585,919 $ 2,054,786 HVAC 48.3% 13.5% 21.1% 1.3% 15.8% 15.00 1% $ 570,649 $ 45,128 HVAC Controls 48.3% 13.5% 21.1% 1.3% 15.8% 8.00 0% $ - $ - Motors & Drives 16.3% 10.7% 10.8% 17.0% 45.2% 15.00 0% $ 76,482 $ 5,287 Compressed Air 25.0% 0.0% 8.0% 0.0% 67.0% 15.00 1% $ 73,018 $ 25,757 Refrigeration 21.3% 8.5% 11.1% 13.0% 46.1% 15.00 1% $ 39,460 $ 19,066 Building Envelope 48.3% 13.5% 21.1% 1.3% 15.8% 20.00 0% $ 117,069 $ 10,529 Vending Machines 48.3% 13.5% 21.1% 1.3% 15.8% 8.00 0% $ - $ 1,553 Custom Projects 21.7% 8.5% 10.8% 13.2% 45.8% 16.00 2% $ 193,846 $ 54,812 Small Commercial Total 15.97 19,798,323$ -$ Lighting 19.5% 5.1% 8.8% 10.2% 56.3% 16.00 67% $ 32,684,685 $ 3,466,125 HVAC 48.3% 13.5% 21.1% 1.3% 15.8% 15.00 2% $ 2,425,314 $ 222,816 HVAC Controls 48.3% 13.5% 21.1% 1.3% 15.8% 8.00 0% $ - $ - Motors & Drives 16.3% 10.7% 10.8% 17.0% 45.2% 15.00 3% $ 1,221,605 $ 127,584 Compressed Air 25.0% 0.0% 8.0% 0.0% 67.0% 15.00 3% $ 449,678 $ 182,705 Refrigeration 21.3% 8.5% 11.1% 13.0% 46.1% 15.00 4% $ 536,055 $ 223,294 Building Envelope 48.3% 13.5% 21.1% 1.3% 15.8% 20.00 1% $ 1,028,934 $ 83,341 Vending Machines 48.3% 13.5% 21.1% 1.3% 15.8% 8.00 0% $ - $ 404 Custom Projects 21.7% 8.5% 10.8% 13.2% 45.8% 16.00 21% $ 6,482,627 $ 1,200,219 Residential Total 16 $ 44,857,198 $ 5,506,489 Load Shapes USING NOMINAL DISCOUNT RATE (5.643%) Measure/Program Summer On- Peak Energy Summer Off- Peak Energy Summer Shoulder Energy Winter Off- Peak Energy Winter Shoulder Energy Measure Life (yrs) Measure Life Weight PV of Capacity PV of Summer On- Peak Energy Lighting 19.5% 5.1% 8.8% 10.2% 56.3% 16.00 94% $ 19,585,919 $ 2,054,786 HVAC 48.3% 13.5% 21.1% 1.3% 15.8% 15.00 1% $ 570,649 $ 45,128 HVAC Controls 48.3% 13.5% 21.1% 1.3% 15.8% 8.00 0% $ - $ - Motors & Drives 16.3% 10.7% 10.8% 17.0% 45.2% 15.00 0% $ 76,482 $ 5,287 Compressed Air 25.0% 0.0% 8.0% 0.0% 67.0% 15.00 1% $ 73,018 $ 25,757 Refrigeration 21.3% 8.5% 11.1% 13.0% 46.1% 15.00 1% $ 39,460 $ 19,066 Building Envelope 48.3% 13.5% 21.1% 1.3% 15.8% 20.00 0% $ 117,069 $ 10,529 Vending Machines 48.3% 13.5% 21.1% 1.3% 15.8% 8.00 0% $ - $ 1,553 Custom Projects 21.7% 8.5% 10.8% 13.2% 45.8% 16.00 2% $ 193,846 $ 54,812 Small Commercial Total 15.97 19,798,323$ -$ Lighting 19.5% 5.1% 8.8% 10.2% 56.3% 16.00 67% $ 32,684,685 $ 3,466,125 HVAC 48.3% 13.5% 21.1% 1.3% 15.8% 15.00 2% $ 2,425,314 $ 222,816 HVAC Controls 48.3% 13.5% 21.1% 1.3% 15.8% 8.00 0% $ - $ - Motors & Drives 16.3% 10.7% 10.8% 17.0% 45.2% 15.00 3% $ 1,221,605 $ 127,584 Compressed Air 25.0% 0.0% 8.0% 0.0% 67.0% 15.00 3% $ 449,678 $ 182,705 Refrigeration 21.3% 8.5% 11.1% 13.0% 46.1% 15.00 4% $ 536,055 $ 223,294 Building Envelope 48.3% 13.5% 21.1% 1.3% 15.8% 20.00 1% $ 1,028,934 $ 83,341 Vending Machines 48.3% 13.5% 21.1% 1.3% 15.8% 8.00 0% $ - $ 404 Custom Projects 21.7% 8.5% 10.8% 13.2% 45.8% 16.00 21% $ 6,482,627 $ 1,200,219 Residential Total 16 $ 44,857,198 $ 5,506,489 Load Shapes USING NOMINAL DISCOUNT RATE (5.643%) Measure/Program Summer On- Peak Energy Summer Off- Peak Energy Summer Shoulder Energy Winter Off- Peak Energy Winter Shoulder Energy Measure Life (yrs) Measure Life Weight PV of Capacity PV of Summer On- Peak Energy Lighting 19.5% 5.1% 8.8% 10.2% 56.3% 16.00 94% $ 19,585,919 $ 2,054,786 HVAC 48.3% 13.5% 21.1% 1.3% 15.8% 15.00 1% $ 570,649 $ 45,128 HVAC Controls 48.3% 13.5% 21.1% 1.3% 15.8% 8.00 0% $ - $ - Motors & Drives 16.3% 10.7% 10.8% 17.0% 45.2% 15.00 0% $ 76,482 $ 5,287 Compressed Air 25.0% 0.0% 8.0% 0.0% 67.0% 15.00 1% $ 73,018 $ 25,757 Refrigeration 21.3% 8.5% 11.1% 13.0% 46.1% 15.00 1% $ 39,460 $ 19,066 Building Envelope 48.3% 13.5% 21.1% 1.3% 15.8% 20.00 0% $ 117,069 $ 10,529 Vending Machines 48.3% 13.5% 21.1% 1.3% 15.8% 8.00 0% $ - $ 1,553 Custom Projects 21.7% 8.5% 10.8% 13.2% 45.8% 16.00 2% $ 193,846 $ 54,812 Small Commercial Total 15.97 19,798,323$ -$ Lighting 19.5% 5.1% 8.8% 10.2% 56.3% 16.00 67% $ 32,684,685 $ 3,466,125 HVAC 48.3% 13.5% 21.1% 1.3% 15.8% 15.00 2% $ 2,425,314 $ 222,816 HVAC Controls 48.3% 13.5% 21.1% 1.3% 15.8% 8.00 0% $ - $ - Motors & Drives 16.3% 10.7% 10.8% 17.0% 45.2% 15.00 3% $ 1,221,605 $ 127,584 Compressed Air 25.0% 0.0% 8.0% 0.0% 67.0% 15.00 3% $ 449,678 $ 182,705 Refrigeration 21.3% 8.5% 11.1% 13.0% 46.1% 15.00 4% $ 536,055 $ 223,294 Building Envelope 48.3% 13.5% 21.1% 1.3% 15.8% 20.00 1% $ 1,028,934 $ 83,341 Vending Machines 48.3% 13.5% 21.1% 1.3% 15.8% 8.00 0% $ - $ 404 Custom Projects 21.7% 8.5% 10.8% 13.2% 45.8% 16.00 21% $ 6,482,627 $ 1,200,219 Residential Total 16 $ 44,857,198 $ 5,506,489 Load Shapes USING NOMINAL DISCOUNT RATE (5.643%) Measure/Program Summer On- Peak Energy Summer Off- Peak Energy Summer Shoulder Energy Winter Off- Peak Energy Winter Shoulder Energy Measure Life (yrs) Measure Life Weight PV of Capacity PV of Summer On- Peak Energy Lighting 19.5% 5.1% 8.8% 10.2% 56.3% 16.00 94% $ 19,585,919 $ 2,054,786 HVAC 48.3% 13.5% 21.1% 1.3% 15.8% 15.00 1% $ 570,649 $ 45,128 HVAC Controls 48.3% 13.5% 21.1% 1.3% 15.8% 8.00 0% $ - $ - Motors & Drives 16.3% 10.7% 10.8% 17.0% 45.2% 15.00 0% $ 76,482 $ 5,287 Compressed Air 25.0% 0.0% 8.0% 0.0% 67.0% 15.00 1% $ 73,018 $ 25,757 Refrigeration 21.3% 8.5% 11.1% 13.0% 46.1% 15.00 1% $ 39,460 $ 19,066 Building Envelope 48.3% 13.5% 21.1% 1.3% 15.8% 20.00 0% $ 117,069 $ 10,529 Vending Machines 48.3% 13.5% 21.1% 1.3% 15.8% 8.00 0% $ - $ 1,553 Custom Projects 21.7% 8.5% 10.8% 13.2% 45.8% 16.00 2% $ 193,846 $ 54,812 Small Commercial Total 15.97 19,798,323$ -$ Lighting 19.5% 5.1% 8.8% 10.2% 56.3% 16.00 67% $ 32,684,685 $ 3,466,125 HVAC 48.3% 13.5% 21.1% 1.3% 15.8% 15.00 2% $ 2,425,314 $ 222,816 HVAC Controls 48.3% 13.5% 21.1% 1.3% 15.8% 8.00 0% $ - $ - Motors & Drives 16.3% 10.7% 10.8% 17.0% 45.2% 15.00 3% $ 1,221,605 $ 127,584 Compressed Air 25.0% 0.0% 8.0% 0.0% 67.0% 15.00 3% $ 449,678 $ 182,705 Refrigeration 21.3% 8.5% 11.1% 13.0% 46.1% 15.00 4% $ 536,055 $ 223,294 Building Envelope 48.3% 13.5% 21.1% 1.3% 15.8% 20.00 1% $ 1,028,934 $ 83,341 Vending Machines 48.3% 13.5% 21.1% 1.3% 15.8% 8.00 0% $ - $ 404 Custom Projects 21.7% 8.5% 10.8% 13.2% 45.8% 16.00 21% $ 6,482,627 $ 1,200,219 Residential Total 16 $ 44,857,198 $ 5,506,489 Load Shapes Populate Model Develop Adoption Rate Assumptions Feedback from CLC
  • 10.
    Task 4. Analysisand Reporting 10  Comprehensive report, with methodology  Remaining cost-effective opportunity scenarios, by sector and segment  Summary of penetration and saturation results  Program opportunities in light of program design, goals, and potential program enhancements  Data sets: penetration and saturation  Consolidated presentation of findings  Deliver and train CLC staff on adjustable, transparent potential model  Models with inputs and outputs for reported scenarios
  • 11.
    Task 5: ProgramDesign Support 11 Element of Program Design Support Level of Support Program Literature Review Comprehensive CLC Data Review Comprehensive Interviews with Program Managers Multiple Interviews with Program Partners yes Best Practices Scan yes Gap Analysis yes Scenario Analysis yes Budget Support Bottom-up Incentive Levels Detailed (size and structure) Process Flows TBD Logic Model TBD Enabling Strategies Detailed  For larger C&I customers only
  • 12.
    Project Timeline (When?) 12 Fall 2013: Project scoping began  June and October 2014: Primary data collection  February 2015: Draft Potential Report  March 2015: Final Potential Report  April 2015: Draft Program Design Report  May 2015: Final Program Design Report
  • 13.