Download to read offline
![2168-7161 (c) 2015 IEEE. Personal use is permitted, but republication/redistribution requires IEEE permission. See
http://www.ieee.org/publications_standards/publications/rights/index.html for more information.
This article has been accepted for publication in a future issue of this journal, but has not been fully edited. Content may change prior to final publication. Citation information: DOI
10.1109/TCC.2015.2396059, IEEE Transactions on Cloud Computing
Energy-aware Load Balancing and Application Scaling for the Cloud
Ecosystem
Ashkan Paya and Dan C. Marinescu
Computer Science Division, EECS Department
University of Central Florida, Orlando, FL 32816, USA
Email:ashkan paya@knights.ucf.edu, dcm@cs.ucf.edu
Abstract - In this paper we introduce an energy-aware operation model used for load balancing and application scaling on
a cloud. The basic philosophy of our approach is defining an energy-optimal operation regime and attempting to maximize
the number of servers operating in this regime. Idle and lightly-loaded servers are switched to one of the sleep states to save
energy. The load balancing and scaling algorithms also exploit some of the most desirable features of server consolidation
mechanisms discussed in the literature.
Index terms - load balancing, application scaling, idle servers, server consolidation, energy proportional systems.
1 Motivation and Related Work
In the last few years packaging computing cycles and stor-
age and offering them as a metered service became a reality.
Large farms of computing and storage platforms have been as-
sembled and a fair number of Cloud Service Providers (CSPs)
offer computing services based on three cloud delivery models
SaaS (Software as a Service), PaaS (Platform as a Service),
and IaaS (Infrastructure as a Service).
Warehouse-scale computers (WSCs) are the building blocks
of a cloud infrastructure. A hierarchy of networks connect
50, 000 to 100, 000 servers in a WSC. The servers are housed
in racks; typically, the 48 servers in a rack are connected by a
48-port Gigabit Ethernet switch. The switch has two to eight
up-links which go to the higher level switches in the network
hierarchy [4, 17].
Cloud elasticity, the ability to use as many resources as
needed at any given time, and low cost, a user is charged only
for the resources it consumes, represents solid incentives for
many organizations to migrate their computational activities
to a public cloud. The number of CSPs, the spectrum of ser-
vices offered by the CSPs, and the number of cloud users have
increased dramatically during the last few years. For exam-
ple, in 2007 the EC2 (Elastic Computing Cloud) was the first
service provided by AWS (Amazon Web Services); five years
later, in 2012, AWS was used by businesses in 200 countries.
Amazon’s S3 (Simple Storage Service) has surpassed two tril-
lion objects and routinely runs more than 1.1 million peak
requests per second. Elastic MapReduce has launched 5.5
million clusters since May 2010 when the service started [35].
The rapid expansion of the cloud computing has a signifi-
cant impact on the energy consumption in US and the world.
The costs for energy and for cooling large-scale data centers
are significant and are expected to increase in the future. In
2006, the 6 000 data centers in the U.S. reportedly consumed
61 × 109
kWh of energy, 1.5% of all electricity consumption
in the country, at a cost of $4.5 billion [34]. The energy con-
sumption of data centers and of the network infrastructure is
predicted to reach 10, 300 TWh/year (1 TWh = 109
kWh)
in 2030, based on 2010 efficiency levels [28]. These increases
are expected in spite of the extraordinary reduction in energy
requirements for computing activities.
Idle and under-utilized servers contribute significantly to
wasted energy, see Section 2. A 2010 survey [8] reports that
idle servers contribute 11 million tons of unnecessary CO2
emissions each year and that the total yearly costs for idle
servers is $19 billion. Recently, Gartner Research [30] re-
ported that the average server utilization in large data-centers
is 18%, while the utilization of x86 servers is even lower,
12%. These results confirm earlier estimations that the aver-
age server utilization is in the 10 − 30% range [3].
The concept of “load balancing” dates back to the time
when the first distributed computing systems were imple-
mented. It means exactly what the name implies, to evenly
distribute the workload to a set of servers to maximize the
throughput, minimize the response time, and increase the sys-
tem resilience to faults by avoiding overloading the systems.
An important strategy for energy reduction is concentrating
the load on a subset of servers and, whenever possible, switch-
ing the rest of them to a state with a low energy consump-
tion. This observation implies that the traditional concept of
load balancing in a large-scale system could be reformulated
as follows: distribute evenly the workload to the smallest set
of servers operating at optimal or near-optimal energy levels,
while observing the Service Level Agreement (SLA) between
the CSP and a cloud user. An optimal energy level is one
when the performance per Watt of power is maximized.
Scaling is the process of allocating additional resources to
a cloud application in response to a request consistent with
the SLA. We distinguish two scaling modes, horizontal and
vertical scaling. Horizontal scaling is the most common mode
of scaling on a cloud; it is done by increasing the number
of Virtual Machines (VMs) when the load of applications in-
creases and reducing this number when the load decreases.
1
For More Details Contact G.Venkat Rao
PVR TECHNOLOGIES 8143271457](https://image.slidesharecdn.com/energy-awareloadbalancingandapplicationscalingforthecloudecosystem-160111100918/85/Energy-aware-load-balancing-and-application-scaling-for-the-cloud-ecosystem-1-320.jpg)
![2168-7161 (c) 2015 IEEE. Personal use is permitted, but republication/redistribution requires IEEE permission. See
http://www.ieee.org/publications_standards/publications/rights/index.html for more information.
This article has been accepted for publication in a future issue of this journal, but has not been fully edited. Content may change prior to final publication. Citation information: DOI
10.1109/TCC.2015.2396059, IEEE Transactions on Cloud Computing
Energy-aware Load Balancing and Application Scaling for the Cloud
Ecosystem
Ashkan Paya and Dan C. Marinescu
Computer Science Division, EECS Department
University of Central Florida, Orlando, FL 32816, USA
Email:ashkan paya@knights.ucf.edu, dcm@cs.ucf.edu
Abstract - In this paper we introduce an energy-aware operation model used for load balancing and application scaling on
a cloud. The basic philosophy of our approach is defining an energy-optimal operation regime and attempting to maximize
the number of servers operating in this regime. Idle and lightly-loaded servers are switched to one of the sleep states to save
energy. The load balancing and scaling algorithms also exploit some of the most desirable features of server consolidation
mechanisms discussed in the literature.
Index terms - load balancing, application scaling, idle servers, server consolidation, energy proportional systems.
1 Motivation and Related Work
In the last few years packaging computing cycles and stor-
age and offering them as a metered service became a reality.
Large farms of computing and storage platforms have been as-
sembled and a fair number of Cloud Service Providers (CSPs)
offer computing services based on three cloud delivery models
SaaS (Software as a Service), PaaS (Platform as a Service),
and IaaS (Infrastructure as a Service).
Warehouse-scale computers (WSCs) are the building blocks
of a cloud infrastructure. A hierarchy of networks connect
50, 000 to 100, 000 servers in a WSC. The servers are housed
in racks; typically, the 48 servers in a rack are connected by a
48-port Gigabit Ethernet switch. The switch has two to eight
up-links which go to the higher level switches in the network
hierarchy [4, 17].
Cloud elasticity, the ability to use as many resources as
needed at any given time, and low cost, a user is charged only
for the resources it consumes, represents solid incentives for
many organizations to migrate their computational activities
to a public cloud. The number of CSPs, the spectrum of ser-
vices offered by the CSPs, and the number of cloud users have
increased dramatically during the last few years. For exam-
ple, in 2007 the EC2 (Elastic Computing Cloud) was the first
service provided by AWS (Amazon Web Services); five years
later, in 2012, AWS was used by businesses in 200 countries.
Amazon’s S3 (Simple Storage Service) has surpassed two tril-
lion objects and routinely runs more than 1.1 million peak
requests per second. Elastic MapReduce has launched 5.5
million clusters since May 2010 when the service started [35].
The rapid expansion of the cloud computing has a signifi-
cant impact on the energy consumption in US and the world.
The costs for energy and for cooling large-scale data centers
are significant and are expected to increase in the future. In
2006, the 6 000 data centers in the U.S. reportedly consumed
61 × 109
kWh of energy, 1.5% of all electricity consumption
in the country, at a cost of $4.5 billion [34]. The energy con-
sumption of data centers and of the network infrastructure is
predicted to reach 10, 300 TWh/year (1 TWh = 109
kWh)
in 2030, based on 2010 efficiency levels [28]. These increases
are expected in spite of the extraordinary reduction in energy
requirements for computing activities.
Idle and under-utilized servers contribute significantly to
wasted energy, see Section 2. A 2010 survey [8] reports that
idle servers contribute 11 million tons of unnecessary CO2
emissions each year and that the total yearly costs for idle
servers is $19 billion. Recently, Gartner Research [30] re-
ported that the average server utilization in large data-centers
is 18%, while the utilization of x86 servers is even lower,
12%. These results confirm earlier estimations that the aver-
age server utilization is in the 10 − 30% range [3].
The concept of “load balancing” dates back to the time
when the first distributed computing systems were imple-
mented. It means exactly what the name implies, to evenly
distribute the workload to a set of servers to maximize the
throughput, minimize the response time, and increase the sys-
tem resilience to faults by avoiding overloading the systems.
An important strategy for energy reduction is concentrating
the load on a subset of servers and, whenever possible, switch-
ing the rest of them to a state with a low energy consump-
tion. This observation implies that the traditional concept of
load balancing in a large-scale system could be reformulated
as follows: distribute evenly the workload to the smallest set
of servers operating at optimal or near-optimal energy levels,
while observing the Service Level Agreement (SLA) between
the CSP and a cloud user. An optimal energy level is one
when the performance per Watt of power is maximized.
Scaling is the process of allocating additional resources to
a cloud application in response to a request consistent with
the SLA. We distinguish two scaling modes, horizontal and
vertical scaling. Horizontal scaling is the most common mode
of scaling on a cloud; it is done by increasing the number
of Virtual Machines (VMs) when the load of applications in-
creases and reducing this number when the load decreases.
1
For More Details Contact G.Venkat Rao
PVR TECHNOLOGIES 8143271457](https://image.slidesharecdn.com/energy-awareloadbalancingandapplicationscalingforthecloudecosystem-160111100918/75/Energy-aware-load-balancing-and-application-scaling-for-the-cloud-ecosystem-1-2048.jpg)
![2168-7161 (c) 2015 IEEE. Personal use is permitted, but republication/redistribution requires IEEE permission. See
http://www.ieee.org/publications_standards/publications/rights/index.html for more information.
This article has been accepted for publication in a future issue of this journal, but has not been fully edited. Content may change prior to final publication. Citation information: DOI
10.1109/TCC.2015.2396059, IEEE Transactions on Cloud Computing
Load balancing is critical for this mode of operation. Vertical
scaling keeps the number of VMs of an application constant,
but increases the amount of resources allocated to each one of
them. This can be done either by migrating the VMs to more
powerful servers or by keeping the VMs on the same servers,
but increasing their share of the server capacity. The first
alternative involves additional overhead; the VM is stopped,
a snapshot is taken, the file is migrated to a more powerful
server, and the VM is restarted at the new site.
The alternative to the wasteful resource management pol-
icy when the servers are always on, regardless of their load,
is to develop energy-aware load balancing and scaling poli-
cies. Such policies combine dynamic power management
with load balancing and attempt to identify servers operat-
ing outside their optimal energy regime and decide if and
when they should be switched to a sleep state or what other
actions should be taken to optimize the energy consump-
tion. The vast literature on energy-aware resource man-
agement concepts and ideas discussed in this paper includes
[1, 3, 5, 6, 7, 10, 11, 22, 25, 28, 32, 33, 34].
Some of the questions posed by energy-aware load balancing
and application scaling are: (a) Under what conditions should
a server be switched to a sleep state? (b) What sleep state
should the server be switched to? (c) How much energy is
necessary to switch a server to a sleep state and then switch
it back to an active state? (d) How much time it takes to
switch a server to a running state from a sleep state? (e)
How much energy is necessary for migrating a VM running
on a server to another one? (f) How much energy is necessary
for starting the VM on the target server? (g) How to choose
the target where the VM should migrate to? (h) How much
time does it takes to migrate a VM?
The answers to some of these questions depend on the
server’s hardware and software, including the virtual machine
monitor and the operating systems, and change as the tech-
nology evolves and energy awareness becomes increasingly
more important. In this paper we are concerned with high-
level policies which, to some extent are independent of the
specific attributes of the server’s hardware and, due to space
limitation, we only discuss (a), (b), and (g). We assume that
the workload is predictable, has no spikes, and that the de-
mand of an application for additional computing power dur-
ing an evaluation cycle is limited. We also assume a clustered
organization, typical for existing cloud infrastructure [4, 17].
There are three primary contributions of this paper: (1) a
new model of cloud servers that is based on different operating
regimes with various degrees of “energy efficiency” (process-
ing power versus energy consumption); (2) a novel algorithm
that performs load balancing and application scaling to max-
imize the number of servers operating in the energy-optimal
regime; and (3) analysis and comparison of techniques for load
balancing and application scaling using three differently-sized
clusters and two different average load profiles.
Models for energy-aware resource management and applica-
tion placement policies and the mechanisms to enforce these
policies such as the ones introduced in this paper can be evalu-
ated theoretically [1], experimentally [10, 11, 13, 22], through
simulation [5, 7, 27], based on published data [2, 8, 19, 20], or
through a combination of these techniques. Analytical mod-
els can be used to derive high-level insight on the behavior of
the system in a very short time but the biggest challenge is
in determining the values of the parameters; while the results
from an analytical model can give a good approximation of
the relative trends to expect, there may be significant errors
in the absolute predictions. Experimental data is collected on
small-scale systems; such experiments provide useful perfor-
mance data for individual system components but no insights
on the interaction between the system and applications and
the scalability of the policies. Trace-based workload anal-
ysis such as the ones in [10] and [33] are very useful though
they provide information for a particular experimental set-up,
hardware configuration, and applications. Typically trace-
based simulation need more time to produce results. Traces
can also be very large and it is hard to generate represen-
tative traces from one class of machines that will be valid
for all the classes of simulated machines. To evaluate the
energy aware load balancing and application scaling policies
and mechanisms introduced in this paper we chose simulation
using data published in the literature [4].
Operating efficiency of a system and server consolidation
are discussed in Sections 2 and 3, respectively. The model
described in Section 4 introduces the operating regimes of a
processors and the conditions when to switch a server to a
sleep state. Load balancing and scaling algorithms suitable
for a clustered cloud organization based on the model are
presented in Section 5; these algorithms aim to optimize the
energy efficiency and to balance the load. Simulations exper-
iments and conclusions are covered in Sections 6 and 7.
2 Energy Efficiency of a System
The energy efficiency of a system is captured by the ra-
tio “performance per Watt of power.” During the last two
decades the performance of computing systems has increased
much faster than their energy efficiency [3].
Energy proportional systems. In an ideal world, the
energy consumed by an idle system should be near zero and
grow linearly with the system load. In real life, even systems
whose energy requirements scale linearly, when idle, use more
than half the energy they use at full load. Data collected
over a long period of time shows that the typical operating
regime for data center servers is far from an optimal energy
consumption regime.
An energy-proportional system consumes no energy when
idle, very little energy under a light load, and gradually, more
energy as the load increases. An ideal energy-proportional
system is always operating at 100% efficiency [3].
Energy efficiency of a data center; the dynamic
range of subsystems. The energy efficiency of a data center
is measured by the power usage effectiveness (PUE), the ratio
of total energy used to power a data center to the energy used
to power computational servers, storage servers, and other IT
equipment. The PUE has improved from around 1.93 in 2003
to 1.63 in 2005; recently, Google reported a PUE ratio as low
2
For More Details Contact G.Venkat Rao
PVR TECHNOLOGIES 8143271457](https://image.slidesharecdn.com/energy-awareloadbalancingandapplicationscalingforthecloudecosystem-160111100918/85/Energy-aware-load-balancing-and-application-scaling-for-the-cloud-ecosystem-2-320.jpg)
![2168-7161 (c) 2015 IEEE. Personal use is permitted, but republication/redistribution requires IEEE permission. See
http://www.ieee.org/publications_standards/publications/rights/index.html for more information.
This article has been accepted for publication in a future issue of this journal, but has not been fully edited. Content may change prior to final publication. Citation information: DOI
10.1109/TCC.2015.2396059, IEEE Transactions on Cloud Computing
as 1.15 [2]. The improvement in PUE forces us to concentrate
on energy efficiency of computational resources [7].
The dynamic range is the difference between the upper and
the lower limits of the energy consumption of a system as a
function of the load placed on the system. A large dynamic
range means that a system is able to operate at a lower frac-
tion of its peak energy when its load is low.
Different subsystems of a computing system behave differ-
ently in terms of energy efficiency; while many processors have
reasonably good energy-proportional profiles, significant im-
provements in memory and disk subsystems are necessary.
The largest consumer of energy in a server is the processor,
followed by memory, and storage systems. Estimated distri-
bution of the peak power of different hardware systems in one
of the Google’s datacenters is: CPU 33%, DRAM 30%, Disks
10%, Network 5%, and others 22% [4] .
The power consumption can vary from 45W to 200W per
multi-core CPU. The power consumption of servers has in-
creased over time; during the period 2001 - 2005 the esti-
mated average power use has increased from 193 to 225 W
for volume servers, from 457 to 675 for mid range servers,
and from 5,832 to 8,163 W for high end ones [19]. Volume
servers have a price less than $25 K, mid-range servers have a
price between $25 K and $499 K, and high-end servers have a
price tag larger than $500 K. Newer processors include power
saving technologies.
The processors used in servers consume less than one-third
of their peak power at very-low load and have a dynamic
range of more than 70% of peak power; the processors used
in mobile and/or embedded applications are better in this
respect. According to [3], the dynamic power range of other
components of a system is much narrower: less than 50% for
DRAM, 25% for disk drives, and 15% for networking switches.
Large servers often use 32 − 64 dual in-line memory modules
(DIMMs); the power consumption of one DIMM is in the 5
to 21 W range.
A server with 2−4 hard disk drives (HDDs) consumes 24−
48 W. A strategy to reduce energy consumption by disk drives
is concentrating the workload on a small number of disks and
allowing the others to operate in a low-power mode. One of
the techniques to accomplish this is based on replication [34].
Another technique is based on data migration [15].
A number of proposals have emerged for energy propor-
tional networks; the energy consumed by such networks is
proportional with the communication load. An example of
an energy proportional network is the InfiniBand. A network-
wide power manager, which dynamically adjusts the network
links and switches to satisfy changing datacenter traffic loads,
called Elastic Tree is described in [16].
Sleep states. The effectiveness of sleep states in optimiz-
ing energy consumption is analyzed in [11]. A comprehen-
sive document [18] describes the advanced configuration and
power interface (ACPI) specifications which allow an operat-
ing system (OS) to effectively manage the power consumption
of the hardware.
Several types of sleep sates, are defined: C-states (C1−C6)
for the CPU, D-states (D0 − D3) for modems, hard-drives,
and CD-ROM, and S-states (S1 − S4) for the basic input-
output system (BIOS). The C-states allow a computer to save
energy when the CPU is idle. In a sleep state, the idle units
of a CPU have their clock signal and the power cut. The
higher the state number, the deeper the CPU sleep mode, the
larger the energy saved, and the longer the time for the CPU
to return to the state C0 which corresponds to the CPU fully
operational. The clock signal and the power of different CPU
units are cut in states C1 to C3 , while in state C4 to C6
the CPU voltage is reduced. In state C1 the main internal
CPU clock is stopped by the software, but the bus interface
and the advanced programmable interrupt controller (APIC)
are running, while in state C3 all internal clocks are stopped,
and in state C4 the CPU voltage is reduced.
Resource management policies for large-scale data
centers. These policies can be loosely grouped into five
classes: (a) Admission control; (b) Capacity allocation; (c)
Load balancing; (d) Energy optimization; and (e) Quality of
service (QoS) guarantees. The explicit goal of an admission
control policy is to prevent the system from accepting work-
load in violation of high-level system policies; a system should
not accept additional workload preventing it from completing
work already in progress or contracted. Limiting the workload
requires some knowledge of the global state of the system; in
a dynamic system such knowledge, when available, is at best
obsolete. Capacity allocation means allocating resources for
individual instances; an instance is an activation of a service.
Some of the mechanisms for capacity allocation are based on
either static or dynamic thresholds [23].
Economy of scale affects the energy efficiency of data pro-
cessing. For example, Google reports that the annual energy
consumption for an Email service varies significantly depend-
ing on the business size and can be 15 times larger for a small
business than for a large one [13]. Cloud computing can be
more energy efficient than on-premise computing for many
organizations [2, 26].
3 Server Consolidation
The term server consolidation is used to describe: (1) switch-
ing idle and lightly loaded systems [33] to a sleep state; (2)
workload migration to prevent overloading of systems [7]; or
(3) any optimization of cloud performance and energy effi-
ciency by redistributing the workload [25].
Server consolidation policies. Several policies have
been proposed to decide when to switch a server to a sleep
state. The reactive policy [31] responds to the current load; it
switches the servers to a sleep state when the load decreases
and switches them to the running state when the load in-
creases. Generally, this policy leads to SLA violations and
could work only for slow-varying, predictable loads. To re-
duce SLA violations one can envision a reactive with extra ca-
pacity policy when one attempts to have a safety margin and
keep running a fraction of the total number of servers, e.g.,
20% above those needed for the current load. The AutoScale
policy [10] is a very conservative reactive policy in switching
servers to sleep state to avoid the power consumption and the
delay in switching them back to running state. This can be
3
For More Details Contact G.Venkat Rao
PVR TECHNOLOGIES 8143271457](https://image.slidesharecdn.com/energy-awareloadbalancingandapplicationscalingforthecloudecosystem-160111100918/85/Energy-aware-load-balancing-and-application-scaling-for-the-cloud-ecosystem-3-320.jpg)
![2168-7161 (c) 2015 IEEE. Personal use is permitted, but republication/redistribution requires IEEE permission. See
http://www.ieee.org/publications_standards/publications/rights/index.html for more information.
This article has been accepted for publication in a future issue of this journal, but has not been fully edited. Content may change prior to final publication. Citation information: DOI
10.1109/TCC.2015.2396059, IEEE Transactions on Cloud Computing
advantageous for unpredictable spiky loads.
A very different approach is taken by two versions of pre-
dictive policies [33]. The moving window policy estimates the
workload by measuring the average request rate in a window
of size ∆ seconds uses this average to predict the load during
the next second (second (∆ + 1)) and then slides the window
one second to predict the load for second (∆ + 2), and so on.
The predictive linear regression policy uses a linear regression
to predict the future load.
Optimal policy. In this paper we define an optimal policy
as one which guarantees that running servers operate within
their optimal energy regime or for limited time in a subopti-
mal regime, and, at the same time, the policy does not pro-
duce any SLA violations. At this time SLAs are very general
and do not support strict QoS guarantees, e.g., hard real-
time deadlines. Different policies can be ranked by comparing
them with an optimal policy. The mechanisms to implement
energy-aware application scaling and load balancing policies
should satisfy several conditions: (i) Scalability - work well for
large farms of servers; (ii) Effectiveness - lead to substantial
energy and cost savings; (iii) Practicality - use efficient algo-
rithms and require as input only data that can be measured
with low overhead and, at the same time, accurately reflects
the state of the system; and last, but not least, (iv) Consis-
tency with the global objectives and contractual obligations
specified by Service Level Agreements.
The workload can be slow- or fast-varying, have spikes or
be smooth, can be predicted or is totally unpredictable; the
admission control can restrict the acceptance of additional
load when the available capacity of the servers is low. What
we can measure in practice is the average energy used and the
average server setup time. The setup time varies depending on
the hardware and the operating system and can be as large as
260 seconds; the energy consumption during the setup phase
is close to the maximal one for the server [10].
The time to switch the servers to a running state is critical
when the load is fast varying, the load variations are very
steep, and the spikes are unpredictable. The decisions when
to switch servers to a sleep state and back to a running state
are less critical when a strict admission control policy is in
place; then new service requests for large amounts of resources
can be delayed until the system is able to turn on a number
of sleeping servers to satisfy the additional demand.
4 The System Model
The model introduced in this section assumes a clustered or-
ganization of the cloud infrastructure and targets primarily
the IaaS cloud delivery model represented by Amazon Web
Services (AWS). AWS supports a limited number of instance
families, including M3 (general purpose), C3 (compute opti-
mized), R3 (memory optimized), I2 (storage optimized), G2
(GPU) and so on. An instance is a package of system re-
sources; for example, the c3.8xlarge instance provides 32
vCPU, 60 GiB of memory, and 2 × 320 GB of SSD storage.
AWS used to measure the server performance in ECUs (Elas-
tic Compute Units) but has switched recently to, yet to be
specified, vCPU units; one ECU is the equivalent CPU capac-
ity of a 1.0 − 1.2 GHz 2007 Opteron or 2007 Xeon processor.
Applications for one instance family have similar profiles,
e.g., are CPU-, memory-, or I/O-intensive and run on clus-
ters optimized for that profile; thus, the application interfer-
ence with one another is minimized. The normalized system
performance and the normalized power consumption are dif-
ferent from server to server; yet, warehouse scale computers
supporting an instance family use the same processor or fam-
ily of processors [4] and this reduces the effort to determine
the parameters required by our model.
In our model the migration decisions are based solely on the
vCPU units demanded by an application and the available
capacity of the host and of the other servers in the cluster.
The model could be extended to take into account not only
the processing power, but also the dominant resource for a
particular instance family, e.g., memory for R3, storage for I2,
GPU for G2 when deciding to migrate a VM. This extension
would complicate the model and add additional overhead for
monitoring the application behavior.
The model defines an energy-optimal regime for server op-
eration and the conditions when a server should be switched
to a sleep state. Also the model gives some hints regarding the
most appropriate sleep state the server should be switched to
and supports a decision making framework for VM migration
in horizontal scaling.
Clustered organization. A cluster C has a leader, a sys-
tem which maintains relatively accurate information about
the free capacity of individual servers in the cluster and com-
municates with the leaders of the other clusters for the imple-
mentation of global resource management policies. The leader
could consist of a multi-system configuration to guarantee a
fast response time and to support fault-tolerance.
An advantage of a clustered organization is that a large
percentage of scheduling decisions are based on local, there-
fore more accurate, information. Server Sk makes scheduling
decisions every τk units of time. The servers in the cluster
report to the leader the current load and other relevant state
information every τi
units of time, or earlier if the need to
migrate an application is anticipated.
We consider three levels of resource allocation decision mak-
ing: (a) the local system which has accurate information
about its state; (b) the cluster leader which has less accurate
information about the servers in the cluster; and (c) global
decisions involving multiple clusters. In this paper we are
only concerned with in-cluster scheduling coordinated by the
leader of the cluster. Inter-cluster scheduling is based on less
accurate information as the leader of cluster C exchanges in-
formation with other leaders less frequently.
System and application level resource management.
The model is based on a two-level decision making process,
one at the system and one at the application level. The sched-
uler of the Virtual Machine Monitor (VMM) of a server inter-
acts with the Server Application Manager (SAM) component
of the VMM to ensure that the QoS requirements of the appli-
cation are satisfied. SAM gathers information from individual
application managers of the VMs running on the server.
Model parameters. The cluster leader maintains static
4
For More Details Contact G.Venkat Rao
PVR TECHNOLOGIES 8143271457](https://image.slidesharecdn.com/energy-awareloadbalancingandapplicationscalingforthecloudecosystem-160111100918/85/Energy-aware-load-balancing-and-application-scaling-for-the-cloud-ecosystem-4-320.jpg)
![2168-7161 (c) 2015 IEEE. Personal use is permitted, but republication/redistribution requires IEEE permission. See
http://www.ieee.org/publications_standards/publications/rights/index.html for more information.
This article has been accepted for publication in a future issue of this journal, but has not been fully edited. Content may change prior to final publication. Citation information: DOI
10.1109/TCC.2015.2396059, IEEE Transactions on Cloud Computing
Normalized
performance
Normalized
power
(3) Optimal
1
1
(2) Suboptimal-low
(5) Undesirable-high
(4) Suboptimal-high
αk
opt,h
αk
opt,l
αk
sopt,l
αk
sopt,h
βk
sopt,l
βk
opt,h
βk
opt,l
βk
sopt,h
βk
0
(1) Undesirable-low
βk
αk
Figure 1: Normalized performance versus normalized power;
boundaries of the five operating regimes are shown.
and dynamic information about all servers in cluster C. Static
information includes:
Sk - the serverId;
γk - a constant quantifying the processing power of server
Sk; the processing power is expressed in vCPUs.
The model illustrated in Figure 1 uses several parameters:
αsopt,l
k αopt,l
k , αopt,h
k , and αsopt,h
k , the normalized perfor-
mance boundaries of different operating regimes.
τk - the reallocation interval. Ever τk units of time the
system determines if and how to reallocate resources.
The application record of application Ai,k includes the ap-
plicationId and several other parameters:
(1) ai,k(t) - current demand of application Ai for processing
power on server Sk at time t in vCPU units, e.g., 0.4.
(2) λi,k - highest rate of increase in demand for processing
power of application Ai on server Sk.
(3) pi,k(t) - migration cost.
(4) qi,k(t) - horizontal scaling cost.
The increase in demand for processing power of application
Ai,k during a reallocation interval is limited
ai,k(t + τk) ≤ ai,k(t) + λi,kτk. (1)
ak(t), the fraction of processing power of server Sk used
by all active applications at time t is an example of dynamic
information. This information is reported with period τi
, or
whenever the server determines that it needs to migrate an
application or to create additional VMs for an application.
To minimize communication costs, the reporting period τi
is
much larger than the rescheduling period of individual clus-
ters. A server Sk has a computational constant γk which
quantifies the highest level of performance it can deliver.
Server operating regimes. The normalized performance
of server Sk depends on the power level, αk(t) = fk[βk(t)]. We
distinguish five operating regimes of a server, an optimal one,
two suboptimal, and two undesirable, Figure 1:
R1 - undesirable-low regime
β0
k ≤ βk(t) ≤ βsopt,l
k and 0 ≤ ak(t) ≤ αsopt,l
k . (2)
R2, R3, R4, - suboptimal-low, optimal, and suboptimal
high regimes
βr1,llim
≤ βk ≤ βr2,hlim
and αr1,llim
≤ αk ≤ αr2,hlim
(3)
with:
R2: r1=sopt, r2=opt, llim=l, hlim=1
R3: r1=r2=opt, llim=l, hlim=h
R4: r1=opt, r2=sopt, llim=h, hlim=h
R5 - undesirable-high regime
βsopt,h
k ≤ βk(t) ≤ 1 and αsopt,h
k ≤ ak(t) ≤ 1. (4)
Our choice of five operating regimes is motivated by the
desire to distinguish three types of system behavior in terms
of power utilization: optimal, suboptimal, and undesirable.
The optimal regime is power efficient and gives a degree of
confidence that the sever will not be forced to request VM
migrations during the next few scheduling cycles while the
sub-optimal regimes are acceptable only for limited periods
of time. The five-regime model coupled with delayed actions,
e.g., allowing a system to operate within a suboptimal or
undesirable-high regimes, could reduce the system overhead
and even save power by reducing VM migration costs. One
can consider a more refined system behavior, e.g., a seven-
regime model, but this adds to the model complexity without
clear benefits.
This classification captures the current system load and al-
lows us to distinguish the actions to be taken to return to the
optimal regime. A system operating in the suboptimal-low
regime is lightly loaded; the server is a candidate for switch-
ing to a sleep state. The undesirable-high regime should be
avoided because a scaling request would immediately trig-
ger VM migration and, depending on the system load, would
require activating one of the servers in a sleep state. This
classification also captures the urgency of the actions taken;
suboptimal regimes do not require an immediate attention,
while the undesirable-low does. The time spent operating in
each suboptimal regime is also important.
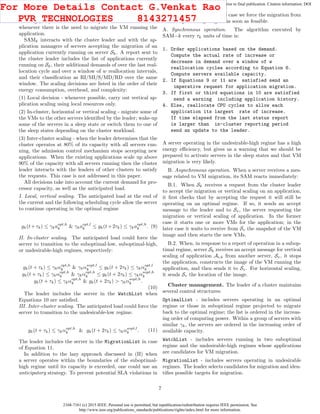
Measuring server energy efficiency. A recent bench-
mark [29] compares the energy efficiency of typical business
applications running on a Java platform. For example, Table
1 based on data reported in Figure 5.3 of [4] shows the re-
sults for the SPECpower ssj2008 benchmark for a server with
a single chip 2.83 GHz quad core Intel Xeon processor, 4GB
of DRAM, and one 7.2 k RPM 3.5” SATA disk drive.
From Table 1 we see that the energy efficiency is nearly-
linear. Consider the case when the workload of n servers
operating in the R1 regime migrates to nopt
servers already
in the R3 regime and the n servers are forced to a sleep state.
The energy saved over an interval of time T, Es
(T), while
delivering the same level of performance satisfies the condition
Es
(T) ≥ n×β0 ×T −n×(¯p+ ¯s)−nopt
×(βopt,h
−βopt,l
), (5)
5
For More Details Contact G.Venkat Rao
PVR TECHNOLOGIES 8143271457](https://image.slidesharecdn.com/energy-awareloadbalancingandapplicationscalingforthecloudecosystem-160111100918/85/Energy-aware-load-balancing-and-application-scaling-for-the-cloud-ecosystem-5-320.jpg)
![2168-7161 (c) 2015 IEEE. Personal use is permitted, but republication/redistribution requires IEEE permission. See
http://www.ieee.org/publications_standards/publications/rights/index.html for more information.
This article has been accepted for publication in a future issue of this journal, but has not been fully edited. Content may change prior to final publication. Citation information: DOI
10.1109/TCC.2015.2396059, IEEE Transactions on Cloud Computing
Table 1: The average workload as a percentage of the maximal workload, the power used in Watts, the number of transac-
tions, and the computational efficiency, the ratio of transactions to the average power consumption, from [4]
Load (%) 0 10 20 30 35 40 50 60 70 80 90 100
P - power (W) 165 180 185 190 195 200 210 220 225 235 240 250
T- transactions 0 175 335 484 552 620 738 854 951 1,049 1,135 1,214
Efficiency= T/P 0 0.97 1.81 2.55 2.83 3.10 3.51 3.88 4.23 4.46 4.73 4.84
assuming that all servers have the same: (1) energy consump-
tion when idle, β0; (2) average migration costs ¯p; and (3) av-
erage setup cost ¯s. The first term of Equation 5 shows that
the longer the system operates in this mode, the larger the
energy savings. The second term measures the energy used
for VM migration and for server setup when they need to be
brought back from the sleep state. The last term of Equa-
tion 5 accounts for the increase in energy consumption due
to additional load of the nopt
servers operating in the optimal
regime. For the example in Table 1, β0 = 165 W. In [10]
the setup time is 260 seconds and during that time the power
is consumed at the peak rate of ¯s = 200 W. There are no
reliable estimations of the migration costs. Processors with
low-power halt states, such as the C1E state of x86, have a
lower setup cost [4].
The results in Table 1 suggest the following boundaries for
the five operating regions:
αsub,l
= 35%, αopt,l
= 50%, αsub,l
= 80%, αund,h
= 90% (6)
These boundaries will be used for the simulation discussed
in Section 6. The parameters for the five operating regimes
R1, R2, R3, R4 and R5 corresponding to the boundaries in
Equation 6 are summarized in Table 2.
Table 2: The thresholds α, the average power consumption
per processor, ¯P, the average performance measured as the
number of transactions, ¯T, and the ratio ¯T/ ¯P for the five
regimes: R1, R2, R3, R4 and R5.
R1 R2 R3 R4 R5
α 0-34.9 35-49.9 50-79.9 80-89.9 90-100
¯P 180 202.5 222.5 237.5 245
¯T 276 645 894 1,092 1,175
¯T/ ¯P 1.410 3.165 3.985 4.595 4.785
Application scaling. We assume that the SAM of server
Sk updates every τk units of time the ai,k(t) of all applications
Ai,k and predicts the consumption at the beginning of the
next reallocation interval. The SAM maintains a control data
structure including all currently running applications, ordered
by ai,k(t). At each reallocation instance, server Sk determines
its available capacity
dk(t) = αopt,h
k −
1
γk i
ai,k(t), (7)
as well as the largest possible demand for processing capacity
at the end of that reallocation interval
gk(t + τk) =
i
(ai,k(t) + λi,kτk) . (8)
5 Energy-aware Scaling Algorithms
The objective of the algorithms is to ensure that the largest
possible number of active servers operate within the bound-
aries of their respective optimal operating regime. The actions
implementing this policy are: (a) migrate VMs from a server
operating in the undesirable-low regime and then switch the
server to a sleep state; (b) switch an idle server to a sleep state
and reactivate servers in a sleep state when the cluster load
increases; (c) migrate the VMs from an overloaded server, a
server operating in the undesirable-high regime with applica-
tions predicted to increase their demands for computing in
the next reallocation cycles.
The clustered organization allows us to accommodate some
of the desirable features of the strategies for server consolida-
tion discussed in Section 3. For example, when deciding to
migrate some of the VMs running on a server or to switch
a server to a sleep state, we can adopt a conservative policy
similar to the one advocated by autoscaling [10] to save en-
ergy. Predictive policies, such as the ones discussed in [33] will
be used to allow a server to operate in a suboptimal regime
when historical data regarding its workload indicates that it
is likely to return to the optimal regime in the near future.
The cluster leader has relatively accurate information about
the cluster load and its trends. The leader could use predictive
algorithms to initiate a gradual wake-up process for servers in
a deeper sleep state, C4 − C6, when the workload is above a
“high water mark” and the workload is continually increasing.
We set up the high water mark at 80% of the capacity of active
servers; a threshold of 85% is used for deciding that a server
is overloaded in [12], based on an analysis of workload traces.
The leader could also choose to keep a number of servers in C1
or C2 states because it takes less energy and time to return
to the C0 state from these states. The energy management
component of the hypervisor can use only local information
to determine the regime of a server.
Scaling decisions. The Server Application Manager
SAMk is a component of the Virtual Machine Monitor (VMM)
of a server Sk. One of its functions is to classify the appli-
cations based on their processing power needs over a window
of w reallocation intervals in several categories: rapidly in-
creasing resource demands (RI), moderately increasing (MI),
6
For More Details Contact G.Venkat Rao
PVR TECHNOLOGIES 8143271457](https://image.slidesharecdn.com/energy-awareloadbalancingandapplicationscalingforthecloudecosystem-160111100918/85/Energy-aware-load-balancing-and-application-scaling-for-the-cloud-ecosystem-6-320.jpg)
![2168-7161 (c) 2015 IEEE. Personal use is permitted, but republication/redistribution requires IEEE permission. See
http://www.ieee.org/publications_standards/publications/rights/index.html for more information.
This article has been accepted for publication in a future issue of this journal, but has not been fully edited. Content may change prior to final publication. Citation information: DOI
10.1109/TCC.2015.2396059, IEEE Transactions on Cloud Computing
SleepList - includes servers in one of the sleep states; the list
is ordered on the type of sleep state and then in the increasing
order of computing power reflected by the constant γk.
The leader performs several functions: admission control
for new applications, server consolidation and reactivation,
and VM migration.
1. Admission control. When the cluster leader receives a
request to accept a new application it computes the available
capacity and admits it if the system is not overloaded
dC(t)
na
C
k=1 γk
≤ 0.8 with dC(t) =
na
C
k=1
dk(t) (12)
with dC(t) is the available capacity and na
C represents the
number of servers operating in the optimal and subopti-
mal regimes, those included in the OptimalList and the
WatchList. If the SleepList is not empty, the leader has
the choice to place the application on a standby queue and
then wake up one or more servers in this list and assign the
application to these servers.
2. Server consolidation and re-activation. The leader ex-
amines each server in the MigrationList and attempts to
pair those operating in the lower undesirable regime with the
ones in the upper undesirable regime and to migrate applica-
tions from the later to the former ones taking into account the
application profile. Servers left to operate in the lower unde-
sirable region are then ordered to switch to one of the sleep
states, depending on the current system load and the pre-
dicted future load. These servers are added to the SleepList.
When the server load reaches the high water mark, then the
leader initiates gradual server transitions from deeper sleep
states to the lighter sleep states and reactivation of some
servers in state C1.
3. VM migration. A VM can only be migrated at the time
when checkpointing is possible and a consistent cut [23] can
be defined. The leader acts as a broker for the selection of a
target for horizontal or vertical scaling of application A. Once
it receives a request for in-cluster scaling it first identifies a
potential target; then the two servers, the one sending the
request and the one accepting to be the target for horizontal
or vertical scaling, negotiate the VM migration. Once an
agreement has been reached, the two servers carry out the
operation without the intervention of the leader. The target
selection is guided by two objectives:
(i) Ensure that the selected target server will be able to
accommodate application scaling for an extended period of
time, while operating in its optimal regime; this will help
reduce the migration costs and the power consumption.
(ii) Keep the user costs low by selecting the least costly
server, the one with the lowest γk that satisfies condition (i).
The strategy is to consider a window of future intervals,
φ, and determine the largest possible increase in resource de-
mand of application Ai.
ai(t + φ × λi) = ai(t) + φλi (13)
Then search the WatchList for a server operating in the lower
suboptimal regime with suitable available capacity
dv(t) > ai(t + φ × λi). (14)
If such a server does not exist, then server Su from SleepList
with the lowest γu is selected if it satisfies the conditions
ai(t) ≥ γuαsopt,l
u and ai(t + φ × λi) ≤ αsopt,l
u . (15)
The algorithms assume that the thresholds for normal-
ized performance and power consumption of server Sk are
constant. When the processor supports dynamic volt-
age and frequency scaling [32] the thresholds, αopt,l
k (t),
αopt,high
k (t), αsopt,l
k (t), αsopt,high
k (t), βopt,l
k (t), βopt,high
k (t),
βsopt,l
k (t), βsopt,high
k (t) will vary in time. The basic philos-
ophy will be the same, we shall attempt to keep every server
in an optimal operating regime. An additional complication
of the algorithms is that we have to determine if it is benefi-
cial to increase/decrease the power used thus, push up/down
the thresholds of the operating regimes of the server. We still
want to make most scaling decisions locally.
6 Simulation Experiments
The effectiveness of an energy-aware load balancing and scal-
ing algorithm is characterized by its computational efficiency,
the number of operations per Watt of power, and by its nega-
tive impact reflected by the potential SLA violations. In our
study we shall use the data in Table 2 based on the measure-
ments reported in Table 1 from [4]. These measurements are
for a transection processing benchmark, SPECpower ssj2008,
thus, the computational efficiency will be the number of trans-
actions per Watt. We define the ideal computational efficiency
as the number of transactions when all servers operate at the
upper limit of the optimal region, at 8o% load, and no SLA
violations occur. In this case
T
P ideal
=
T80%
P80%
=
1049
235
= 4.46 transactions/Watt. (16)
We conduct a simulation study to evaluate the effectiveness
of the algorithms discussed in Section 5 . The simulation
experiments reported in this paper were conducted on the
Amazon cloud; an c3.8xlarge EC2 instance with 60 G memory
and 32 cores was used.
The study will give us some indications about the operation
of the algorithm in clusters of different sizes and subject to a
range of workloads. The metrics for assessing the effectiveness
and the overhead of the algorithms are:
(i) The evolution of the number of servers in each of the five
operating regimes as a result of the load migration mandated
by the algorithm.
(ii) The computational efficiency before and after the appli-
cation of the algorithm.
(iii) The ratio of local versus in-cluster scaling decisions during
simulation. This reflects the overhead of the algorithm.
8
For More Details Contact G.Venkat Rao
PVR TECHNOLOGIES 8143271457](https://image.slidesharecdn.com/energy-awareloadbalancingandapplicationscalingforthecloudecosystem-160111100918/85/Energy-aware-load-balancing-and-application-scaling-for-the-cloud-ecosystem-8-320.jpg)
![2168-7161 (c) 2015 IEEE. Personal use is permitted, but republication/redistribution requires IEEE permission. See
http://www.ieee.org/publications_standards/publications/rights/index.html for more information.
This article has been accepted for publication in a future issue of this journal, but has not been fully edited. Content may change prior to final publication. Citation information: DOI
10.1109/TCC.2015.2396059, IEEE Transactions on Cloud Computing
Table 3: The effects of application scaling and load balancing algorithm on a system with the parameters described in Table
2. We experimented with two average system loads, 30% and 70% of the server capacity and three different cluster sizes,
102
, 103
, and 104
. The data before/after the application of the algorithm are: (a) the number of servers in each one of the
five operating regimes, R1, R2, R3, R4, R5 and in the sleep state (slp) (columns 3-8); (b) P - the average power consumption
per processor in Watts (column 9); (c) T - the performance measured as the average number of transactions per processor
(column 10); and (d) the average ratio T/P (column 11).
Load Size # in R1 # in R2 # in R3 # in R4 # in R5 # in slp P T T/P
30% 102
65/0 35/27 0/64 0/2 0/3 0/4 188/197 264/746 1.4/3.8
103
550/0 450/300 0/598 0/20 0/64 0/18 190/214 442/825 2.3/3.8
104
5500/0 4500/3050 0/5950 0/50 0/319 0/631 190/203 442/771 2.3/3.8
70% 102
0/0 0/58 20/35 80/2 0/5 0/0 234/204 1,052/742 4.5/3.6
103
0/0 0/430 190/490 810/20 0/56 0/4 234/215 1,054/823 4.5 /3.7
104
0/0 0/4000 2000/4500 8000/250 0/233 0/17 235/193 1,052/715 4.5/3.7
For simplicity we chose only two sleep states C3 and C6 in
the simulation. If the load of the cluster is more than 60% of
the cluster capacity we do not choose the C6 state because the
probability that the system will require additional resources
in the next future is high. Switching from the C6 state to
C0 requires more energy and takes more time. On the other
hand, when the cluster load is less than 60% of its capacity
we choose the C6 state because it is unlikely that the server
will be reactivated in the next future.
The simulation uses Amazon Web Services (AWS). AWS
offers several classes of services; the servers in each class are
characterized by the architecture, CPU execution rate, main
memory, disk space, and I/O bandwidth. The more powerful
the server, the higher the cost per hour for the class of service.
Table 3 summarizes the effects of application scaling and
load balancing algorithm on a cluster when the parameters of
the servers are given in Table 2 and the application is a trans-
action processing system. In a transaction processing system
there is no workload migration, a front-end distributes the
transactions to the servers thus, we did not include migration
costs. To asses the power consumption and the performance
measured by the number of transactions we use average val-
ues for each regime. Recall that in this case the boundaries
of the five operating regimes are given in Equation 6.
The effect of the system load. In [27] we report on
simulation experiments designed to evaluate the effectiveness
of the algorithms for load balancing and energy optimization
during application scaling. One of the questions we addressed
was whether the system load has an effect on the resource
management strategy to force the servers in a cluster to oper-
ate within the boundaries of the optimal regime. The exper-
iments we report in this paper are for clusters with 102
, 103
,
and 104
servers consisting of multiple racks of a WSC. For
each cluster size we considered two load distributions:
(i) Low average load - an initial load uniformly distributed
in the interval 20 − 40% of the server capacity. Figure 2 (a)
shows the distribution of the number of servers in the five
operating regimes for clusters with 104
servers, before and
after load balancing; the distributions for 102
and 103
servers
in a cluster are similar. When the average server load is 30% of
their capacity, the algorithm is very effective; it substantially
improves the energy efficiency to 3.8 from as low as 1.4. After
load balancing, the number of servers in the optimal regime
increases from 0 to about 60% and a fair number of servers
are switched to the sleep state.
(ii) High average load - initial server load uniformly dis-
tributed in the 60 − 80% of the server capacity. Figure 2 (b)
shows that when the average server load is 70% of their capac-
ity, the average computational efficiency decreases from about
4.5 to 3.6 as many servers, about 80% of them, are forced from
R4 to the R2 and R3 regimes to reduce the possibility of SLA
violations. Initially, no servers operated in the R5 regime. In
this experiment we did not use the anticipatory strategy and
allowed servers to operate in the R5 regime after load balanc-
ing; as a result, a small fraction of servers ended up in the R5
regime. There is a balance between computational efficiency
and SLA violations; the algorithm can be tuned to maximize
computational efficiency or to minimize SLA violations ac-
cording to the type of workload and the system management
policies.
These results are consistent with the ones reported in [27]
for smaller cluster sizes, 20, 40, 60, and 80 servers. This shows
that the algorithms operate effectively for a wide range of
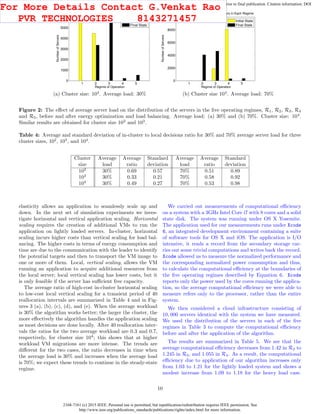
cluster sizes and for lightly, as well as, heavily loaded systems.
0 10 20 30 40 50 60 70 80 90 100 110
0
1
2
3
4
5
Time
RatioofInclustertoLocalDecisions
Ratio
Figure 4: The ratio of in-cluster to local decisions in response
to scaling requests versus time for a cluster with 40 servers
when the average workload is 50% of the server capacity.
High-cost versus low-cost application scaling. Cloud
9
For More Details Contact G.Venkat Rao
PVR TECHNOLOGIES 8143271457](https://image.slidesharecdn.com/energy-awareloadbalancingandapplicationscalingforthecloudecosystem-160111100918/85/Energy-aware-load-balancing-and-application-scaling-for-the-cloud-ecosystem-9-320.jpg)
![2168-7161 (c) 2015 IEEE. Personal use is permitted, but republication/redistribution requires IEEE permission. See
http://www.ieee.org/publications_standards/publications/rights/index.html for more information.
This article has been accepted for publication in a future issue of this journal, but has not been fully edited. Content may change prior to final publication. Citation information: DOI
10.1109/TCC.2015.2396059, IEEE Transactions on Cloud Computing
Table 5: The effects of application scaling and load balancing algorithm on a system with 104
servers 3GHz Intel Core
i7. Shown are the number of servers in each one of the five operating regimes before and after the application of the
algorithm according to Table 3 and the average computational efficiency in each regime ¯CRi
ef , 1 ≤ i ≤ 5 determined by our
measurements. ¯Cef shows the average computational efficiency before and after the application of the algorithm.
Load # in R1 # in R2 # in R3 # in R4 # in R5
¯Cef
¯CR1
ef = 0.725 ¯CR2
ef = 1.420 ¯CR3
ef = 1.245 ¯CR4
ef = 1.055 ¯CR5
ef = 1.050
30% 5500/0 4500/3050 0/5950 0/50 0/319 1.03/1.21
70% 0/0 0/4000 2000/4500 8000/250 0/233 1.09/1.18
7 Conclusions & Future Work
The realization that power consumption of cloud computing
centers is significant and is expected to increase substantially
in the future motivates the interest of the research community
in energy-aware resource management and application place-
ment policies and the mechanisms to enforce these policies.
Low average server utilization [30] and its impact on the en-
vironment [8] make it imperative to devise new energy-aware
policies which identify optimal regimes for the cloud servers
and, at the same time, prevent SLA violations.
A quantitative evaluation of an optimization algorithm or
an architectural enhancement is a rather intricate and time-
consuming process; several benchmarks and system configu-
rations are used to gather the data necessary to guide future
developments. For example, to evaluate the effects of architec-
tural enhancements supporting Instruction-level or Data-level
Parallelism on the processor performance and their power con-
sumption several benchmarks are used [17]. The results show
different numerical outcomes for the individual applications
in each benchmark. Similarly, the effects of an energy-aware
algorithm depend on the system configuration and on the ap-
plication and cannot be expressed by a single numerical value.
Research on energy-aware resource management in large-
scale systems often use simulation for a quasi-quantitative
and, more often, a qualitative evaluation of optimization al-
gorithms or procedures. As stated in [4] “First, they (WSCs)
are a new class of large-scale machines driven by a new and
rapidly evolving set of workloads. Their size alone makes
them difficult to experiment with, or to simulate efficiently.”
It is rather difficult to experiment with the systems discussed
in this paper and this is precisely the reason why we choose
simulation.
The results of the measurements reported in the literature
are difficult to relate to one another. For example, the wake-
up time of servers in the sleep state and the number of servers
in the sleep state are reported for the AutoScale system [10];
yet these figures would be different for another processor, sys-
tem configuration, and application.
We choose computational efficiency, the ratio of the amount
of normalized performance to normalized power consumption,
as the performance measure of our algorithms. The amount
of useful work in a transition processing benchmark can be
measured by the number of transactions, but it is more diffi-
cult to assess for other types of applications. SLA violations
in a transaction processing benchmark occur only when the
workload exceeds the capacity of all servers used by the appli-
cation, rather than the capacity of individual servers. Thus,
in our experiment there are no SLA violation because there
are servers operating in low-load regimes.
We need to balance computational efficiency and SLA vio-
lations; from Table 3 we see that the computational efficiency
increases up to 3.6 − 3.8, while the optimum is 4.46 transac-
tions/Watt. Figure 2 (b) and Table 3 show that the compu-
tational efficiency decreases after the application of the algo-
rithm to a system with the average load 70% because servers
operating in the suboptimal-high regime are forced to reduce
their workload. The lazy approach discussed in Section 5
would eliminate this effect.
Even the definition of an ideal case when a clairvoyant re-
source manager makes optimal decisions based not only on
the past history, but also on the knowledge of the future can
be controversial. For example, we choose as the ideal case the
one when all servers operate at the upper boundary of the
optimal regime; other choices for the ideal case and for the
bounds of the five regimes could be considered in case of fast
varying, or unpredictable workloads.
The five-regime model introduced in this paper reflects the
need for a balanced strategy allowing a server to operate in an
optimal or near-optimal regime for the longest period of time
feasible. A server operating in the optimal regime is unlikely
to request a VM migration in the immediate future and to
cause an SLA violation, one in a sub-optimal regime is more
likely to request a VM migration, while one in the undesirable-
high regime is very likely to require VM migration. Servers
in the undesirable-low regime should be switched to a sleep
state as soon as feasible.
The model is designed for clusters built with the same type
of processors and similar configurations; the few parameters
of the model are then the same for all the servers in the clus-
ter. The clustered organization allows an effective manage-
ment of servers in the sleep state as they should be switched
proactively to a running state to avoid SLA violations. It
also supports effective admission control, capacity allocation,
and load balancing mechanisms as the cluster leader has rel-
atively accurate information about the available capacity of
individual servers in the cluster.
Typically, we see a transient period when most scaling de-
cisions require VM migration, but in a steady-state, local de-
cisions become dominant. Table 4 shows that the average
12
For More Details Contact G.Venkat Rao
PVR TECHNOLOGIES 8143271457](https://image.slidesharecdn.com/energy-awareloadbalancingandapplicationscalingforthecloudecosystem-160111100918/85/Energy-aware-load-balancing-and-application-scaling-for-the-cloud-ecosystem-12-320.jpg)
![2168-7161 (c) 2015 IEEE. Personal use is permitted, but republication/redistribution requires IEEE permission. See
http://www.ieee.org/publications_standards/publications/rights/index.html for more information.
This article has been accepted for publication in a future issue of this journal, but has not been fully edited. Content may change prior to final publication. Citation information: DOI
10.1109/TCC.2015.2396059, IEEE Transactions on Cloud Computing
system load affects the average ratio of in-cluster to local de-
cisions thus, the migration costs, increases from 0.33 to 0.55
for a cluster with 103
servers when the average system load
increases from 30% to 70%. As pointed out in [4] there is a
real need for energy benchmarks such as the one in [29] which
could be used to guide the design choices for new systems.
From the large number of questions posed by energy-aware
load balancing policies we restrict our analysis to the condi-
tions when a server should be switched to a sleep state and
the choice of the sleep state, and how to chose the target
server where to move a VM. The mechanisms for load bal-
ancing and application scaling policies are consistent with the
requirements discussed in Section 3, scalability, effectiveness,
practicality, and consistency with global system objectives.
Though designed specifically for the IaaS cloud delivery
model, the algorithms discussed in Section 5 can be adapted
for the other cloud delivery models. Typically, PaaS applica-
tions run for extended periods of time and the smallest set of
servers operating at an optimal power level to guarantee the
required turnaround time can be determined accurately.
Our future work will evaluate the overhead and the limi-
tations of the algorithm proposed in this paper; it will also
include the implementation of a Server Application Manager
and the evaluation of the overhead for the algorithm proposed
in this paper. The algorithm will be incorporated in the self-
management policies introduced in [24].
8 Acknowledgments
The authors are grateful for the constructive comments of
anonymous reviewers.
References
[1] D. Ardagna, B. Panicucci, M. Trubian, and L. Zhang.
“Energy-aware autonomic resource allocation in multi-
tier virtualized environments.” IEEE Trans. on Services
Computing, 5(1):2–19, 2012.
[2] J. Baliga, R.W.A. Ayre, K. Hinton, and R.S. Tucker.
“Green cloud computing: balancing energy in process-
ing, storage, and transport.” Proc. IEEE, 99(1):149-167,
2011.
[3] L. A. Barroso and U. H¨ozle. “The case for energy-
proportional computing.” IEEE Computer, 40(12):33–
37, 2007.
[4] L. A. Barossso, J. Clidaras, and U.H¨ozle. The Data-
center as a Computer; an Introduction to the Design of
Warehouse-Scale Machines. (Second Edition). Morgan
& Claypool, 2013.
[5] A. Beloglazov, R. Buyya “Energy efficient resource man-
agement in virtualized cloud data centers.” Proceedings
of the 2010 10th IEEE/ACM International Conference
on Cluster, Cloud and Grid Comp., 2010.
[6] A. Beloglazov, J. Abawajy, R. Buyya. “Energy-aware
resource allocation heuristics for efficient management of
data centers for Cloud computing.” Future Generation
Computer Systems, 28(5):755-768, 2012.
[7] A. Beloglazov and R. Buyya. “Managing overloaded
hosts for dynamic consolidation on virtual machines in
cloud centers under quality of service constraints.” IEEE
Trans. on Parallel and Distributed Systems, 24(7):1366-
1379, 2013.
[8] M. Blackburn and A. Hawkins. “Unused server survey
results analysis.” www.thegreengrid.org/media/White
Papers/Unused%20Server%20Study WP 101910 v1.
ashx?lang=en (Accessed on December 6, 2013).
[9] M. Elhawary and Z. J. Haas. “Energy-efficient protocol
for cooperative networks.” IEEE/ACM Trans. on Net-
working, 19(2):561–574, 2011.
[10] A. Gandhi, M. Harchol-Balter, R. Raghunathan, and
M.Kozuch. “AutoScale: dynamic, robust capacity man-
agement for multi-tier data centers.” ACM Trans. on
Computer Systems, 30(4):1–26, 2012.
[11] A. Gandhi, M. Harchol-Balter, R. Raghunathan, and
M.Kozuch. “Are sleep states effective in data centers?”
Proc. Int. Conf. on Green Comp., pp. 1–10, 2012.
[12] D. Gmach, J. Rolia, L. Cherkasova, G. Belrose, T. Tu-
cricchi, and A. Kemper. “An integrated approach to re-
source pool management: policies, efficiency, and quality
metrics.” Proc. Int. Conf. on Dependable Systems and
Networks, pp. 326–335, 2008.
[13] Google. “Google’s green computing: efficiency at scale.”
http://static.googleusercontent.com/external content/
untrusted dlcp/www.google.com/en/us/green/pdfs/google
-green-computing.pdf (Accessed on August 29, 2013).
[14] V. Gupta and M. Harchol-Balter. “Self-adaptive admis-
sion control policies for resource-sharing systems.” Proc.
11th Int. Joint Conf. Measurement and Modeling Com-
puter Systems (SIGMETRICS’09), pp. 311–322, 2009.
[15] K. Hasebe, T. Niwa, A. Sugiki, and K. Kato. “Power-
saving in large-scale storage systems with data migra-
tion.” Proc IEEE 2nd Int. Conf. on Cloud Comp. Tech-
nology and Science, pp. 266–273, 2010.
[16] B. Heller, S. Seetharaman, P. Mahadevan, Y. Yiakoumis,
P. Sharma, S. Banerjee, and N. McKeown. “Elastic-
Tree: saving energy in data center networks.” Proc. 7th
USENIX Conf. on Networked Systems Design and Im-
plementation, pp. 17–17, 2011.
[17] J. L. Hennessy and D. A. Patterson. Computer Archi-
tecture; A Quantitative Approach, 5th Edition. Morgan
Kaufmann, 2012.
13
For More Details Contact G.Venkat Rao
PVR TECHNOLOGIES 8143271457](https://image.slidesharecdn.com/energy-awareloadbalancingandapplicationscalingforthecloudecosystem-160111100918/85/Energy-aware-load-balancing-and-application-scaling-for-the-cloud-ecosystem-13-320.jpg)
![2168-7161 (c) 2015 IEEE. Personal use is permitted, but republication/redistribution requires IEEE permission. See
http://www.ieee.org/publications_standards/publications/rights/index.html for more information.
This article has been accepted for publication in a future issue of this journal, but has not been fully edited. Content may change prior to final publication. Citation information: DOI
10.1109/TCC.2015.2396059, IEEE Transactions on Cloud Computing
[18] Hewlet-Packard/Intel/Microsoft/Phoenix/Toshiba.
“Advanced configuration and power interface
specifications, revision 5.0” http://www.acpi.info/
DOWNLOADS/ACPIspec50.pdf, 2011. (Accessed on
November 10, 2013).
[19] J. G. Koomey. “Estimating total power consumption
by servers in the US and world.” http://hightech.lbl.
gov/documents/data centerssvrpwrusecompletefinal.pdf
(Accessed on May 11, 2013).
[20] J.G. Koomey, S. Berard, M. Sanchez, and H. Wong. “Im-
plications of historical trends in the energy efficiency of
computing.” IEEE Annals of Comp., 33(3):46–54, 2011.
[21] E. Le Sueur and G. Heiser. “Dynamic voltage and fre-
quency scaling: the laws of diminishing returns.” Proc.
Workshop on Power Aware Computing and Systems,
HotPower’10, pp. 2–5, 2010.
[22] B. Li; J. Li; J. Huai; T. Wo; Q. Li; L. Zhong. “EnaCloud:
an energy-saving application live placement approach for
cloud computing environments.” Cloud Comp., 2009.
CLOUD ’09, pp.17 - 24, 2009.
[23] D. C. Marinescu. Cloud Computing; Theory and Prac-
tice. Morgan Kaufmann, 2013.
[24] D. C. Marinescu, A Paya, and J.P. Morrison. “Coalition
formation and combinatorial auctions; applications to
self-organization and self-management in utility comput
ing.” http: //arxiv.org/pdf/1406.7487v1.pdf, 2014.
[25] C. Mastroianni, M. Meo, G. Papuzzo. “ Probabilis-
tic consolidation of virtual machines in self-organizing
cloud data centers.” IEEE Trans. on Cloud Computing,
1(2):215–228, 2013.
[26] NRDC and WSP 2012. “The carbon emissions of
server computing for small-to medium-sized organi-
zation - a performance study of on-premise vs. the
cloud.” http://www.wspenvironmental.com/media/docs/
ourlocations/usa/NRDC-WSP Cloud Computing.pdf
October 2012 (Accessed on November 10, 2013).
[27] A. Paya and D. C. Marinescu. “Energy-aware load
balancing policies for the cloud ecosystem.” http:
//arxiv.org/pdf/1307.3306v1.pdf, December 2013.
[28] C. Preist and P. Shabajee. “Energy use in the media
cloud.” Proc IEEE 2nd Int. Conf. on Cloud Comp. Tech-
nology and Science, pp. 581–586, 2010.
[29] SPEC ”SPECpower ssj2008 benchmark.” https://www.
spec.org/power ssj2008/ (Accessed on May 15, 2014).
[30] B. Snyder. “Server virtualization has stalled, despite
the hype.” http://www.infoworld.com/print/146901 (Ac-
cessed on December 6, 2013).
[31] B. Urgaonkar and C. Chandra. “Dynamic provisioning
of multi-tier Internet applications.” Proc. 2nd Int. Conf,
on Automatic Comp., pp. 217–228, 2005.
[32] H. N. Van, F. D. Tran, and J.-M. Menaud. “Performance
and power management for cloud infrastructures.” Proc.
IEEE 3rd Int. Conf. on Cloud Comp., pp. 329–336, 2010.
[33] A. Verma, G. Dasgupta, T. K. Nayak, P. De, and R.
Kothari. “Server workload analysis for power mini-
mization using consolidation.” Proc. USENIX’09 Conf.,
pp.28–28, 2009.
[34] S. V. Vrbsky, M. Lei, K. Smith, and J. Byrd. “Data
replication and power consumption in data grids.” Proc
IEEE 2nd Int. Conf. on Cloud Computing Technology
and Science, pp. 288–295, 2010.
[35] ZDNet. “Infrastructucture is not a differentiator.”
http://www.zdnet.com/amazon-cto-werner-vogels-
infrastructure-is-not-a-differentiator-7000014213 (Ac-
cessed on August 29, 2013).
Ashkan Paya is a Ph.D. candidate in the Electrical Engi-
neering and Computer Science Department at University of
Central Florida pursuing his degree in Computer Science. He
graduated from Sharif University of Technology in Tehran,
Iran, with a BS Degree in the same major in 2011. His re-
search interests are in the area of resource management in
large-scale systems and cloud computing.
Dan C. Marinescu. During the period 1984-2001 Dan
Marinescu was an Associate and then Full Professor in the
Computer Science Department at Purdue University in West
Lafayette, Indiana. Since August 2001 he is a Provost Pro-
fessor of Computer Science at University of Central Florida.
He has published more than 220 papers in referred journals
and conference proceedings and several books including Cloud
Computing: Theory and Practice, Morgan Kaufmann, 2013.
14
For More Details Contact G.Venkat Rao
PVR TECHNOLOGIES 8143271457](https://image.slidesharecdn.com/energy-awareloadbalancingandapplicationscalingforthecloudecosystem-160111100918/85/Energy-aware-load-balancing-and-application-scaling-for-the-cloud-ecosystem-14-320.jpg)

This document summarizes an article that introduces an energy-aware operation model for load balancing and application scaling in cloud computing environments. It aims to define an energy-optimal operation regime for servers and maximize the number operating in this regime. Idle and lightly loaded servers would be switched to low-power sleep states to save energy. The document provides background on energy efficiency in data centers and systems, discusses related work, and outlines the contributions and evaluation approach of the article.