This document summarizes research on developing a spam filtering system for SMS messages on mobile devices. The researchers preprocessed a dataset of SMS messages, extracting features like word counts and frequencies. They applied logistic regression and gradient boosting models, achieving up to 98% accuracy. Significant features for detecting spam included words like "win", "urgent", and message length. Incorporating interaction terms further improved model performance. The system aims to minimize incorrectly flagging legitimate messages as spam.
![I. INTRODUCTION
A spam is defined as an irrelevant or unsolicited message sent over communication channels,
typically to a large numbers of users, for the purposes of advertising, phishing, spreading
malware, etc. With the humongous boom in the number of mobile users, SMS has grown into a
multi-billion dollars commercial industry. As per Wikipedia [1] is the most widely used data
application with an estimated 3.5 billion active users, or about 80% of all mobile phone
subscribers at the end of 2010.
A spam filter is a program that is used to prevent spam from getting to a user's inbox. Like other
types of filtering[2] programs, a spam filter looks for certain criteria on which it bases
judgments. For example, the simplest and earliest versions (such as the one available with
Microsoft's Hotmail) can be set to watch for particular words in the subject line of messages and
to exclude these from the user's inbox. This method is not especially effective, too often omitting
perfectly legitimate messages (these are called false positives) and letting actual spam through. In
general, Spam filters are estimated to reduce costs by roughly 30%.
II. BUSINESS SCOPE
According to a study [3], the volume of SMS spam has risen 45% in the US in 2011 to 4.5 billion
messages and, in 2012, more than 69% of the mobile users claimed to have received text spam.
A paper [4] published in the journal of Economic perspectives titled “The Economics of Spam”
estimated that Americans experience costs of almost $20 billion annually due to spam, while
spammers and spam-advertised merchants collect gross worldwide revenues on the order of $200
million per year, and conclude that the 'externality ratio' of external costs to internal benefits for
spam is around 100:1. Spammers are claimed to have been dumping a lot on society and reaping
fairly little in return.
Research [5] by a Stanford University Scholar states that due to increased popularity in young
demographics and the decrease in text messaging charges over the years (in China it now costs
less than $0.001 to send a text message), SMS Spam is showing growth, and in 2012 in parts of
Asia up to 30% of text messages was spam. SMS spams being very personal and more irritating
than email spams contribute to costs for the receiver as well. If SMS span remains unaddressed, a
mobile operator with 10 million subscribers can incur up to $6 Billion in losses per year.
While drawing a boundary for filtering out SMS spams on a user based scale, the business
considerations include the costs of misclassification of legitimate SMS as being fake and the
inconvenience caused by allowing a certain proportion of spams when the genuinity cannot be
ascertained. The attempt here has been to provide a worthwhile solution in light of the concerns.
The dataset has been taken from UCI Machine Learning repository which contains 5574 text
messages [8].](https://image.slidesharecdn.com/reportpdgbacdagroup2-160815121705/85/Enabling-Spam-filtering-2-320.jpg)
![III. DATA PREPROCESSING
The dataset of experiment consists of one large text file in which each line corresponds to a text
message (SMS). Therefore, preprocessing of the data, extraction of features and further
engineering, and tokenization of each message is required.
For the initial analysis of the data, each message in dataset is split into tokens of alphanumeric
characters. Tokenization has been done keeping space as the delimiter. Stop-words [7] were
removed from all the text messages as they appear most frequently along both response class and
don’t have much discriminative power. The effect of abbreviations in the messages is ignored,
and no word stemming algorithm is used. Additionally, more tokens are generated based on the
number of special characters (!,(,),.,:,$,etc), the number of uppercase letters, number of spelling
mistakes and the overall number of characters in the message. The intuition behind calculation of
the number of special characters is to detect the spam which usually tend to have more number
of special characters like $, @, # etc. The number of uppercase letters gives a lead in detecting
spam as usual presence of uppercase letters for emphasis. The intuition behind entering the
length of message as a feature is that the cost of sending a text message is the same as long as it
is contained below 160 characters, so marketers would prefer to use most of the space available
to them as long as it doesn’t exceed the limit. The interesting observation from the data was the
presence of misspelled words which are prevalent in ham and usually not in spam. Unigram
frequency analysis has been carried out to understand the most frequent words used in spam after
removing the stop words. Hence, the most frequently occurring words were identified from the
spam messages using term document matrix. These words certainly will have more
discriminative power in determining spam. However, not all of these words are useful in the
classification. Tokens (words) which fall into the top 5 percentile based on frequency (having
frequency in the list of all words appear in spam, has been considered as separate features). Here
is the list of words used as features: {150p, call, cash, chat, claim, com, contact, customer, free,
get, guaranteed, just, mobile, msg, new, nokia, now, per, phone, please, prize, reply, send,
service, stop, text, tone, txt, urgent, week, will, win, won, www}. Indicator variable were used to
denote presence of each word - ‘1’ for presence of the particular word, 0 otherwise. Considering
all the features, the training data finally contains 40 predictor variables.
IV. METHODOLOGY AND RESULTS
The logical approach to handle problem is to identify the features which are distinct in spam and
we define ham messages as those which are not spam. Thus, the response contains two class
spam (1) and ham (0).
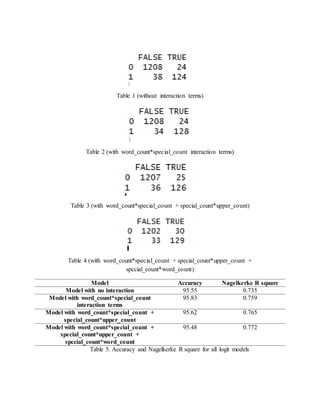
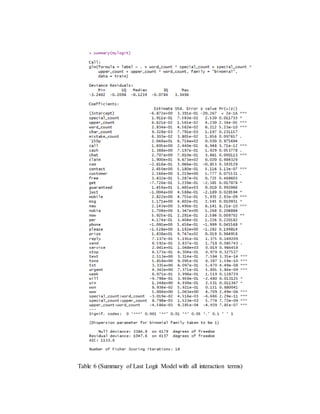
In the first phase of analysis, a multinomial general linear regression with a binomial logit link
was applied on 40 explanatory variables without considering any interaction terms. An accuracy
of 95.55% was achieved, for this model on the test set and is presented as a confusion matrix in
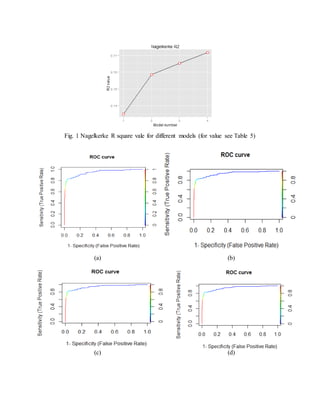
Table 1. For measuring goodness-of-fit, the NagelKerke R-square was calculated and it shows a
value of 0.735. From the model, the significant explanatory variable were identified as
word_count, character_count, special_count from the engineered features and win, won, urgent,](https://image.slidesharecdn.com/reportpdgbacdagroup2-160815121705/85/Enabling-Spam-filtering-3-320.jpg)
![txt, text, tone, mobile, new, contact and call. The subjective inferences from the above are
directly conclusive as the word reflects the specific interest of the marketers who tend to send
spam messages. The words seem instigating to make a forward step with the spam messages as
obvious. Furthermore, it comes costly, when a ham is misclassified as spam and thus, the
objective is to minimize the type-I error. The threshold along which the predicted probabilities
has been clamped to 0 (ham) or 1 (spam) has been obtained running an iterative search where it
achieves minimum type-I error. It deteriorates the model accuracy, which means type-II error
increased. As a suitable trade-off, type-I error of 0.02% is allowed. For the first model, the
threshold chosen is .85. The ROC curve also shows the point where it achieves maximum AUC.
(Figure 2). Still, the threshold obtained by the iterative minimization was considered to keep the
objective as minimization of misclassification of hams.
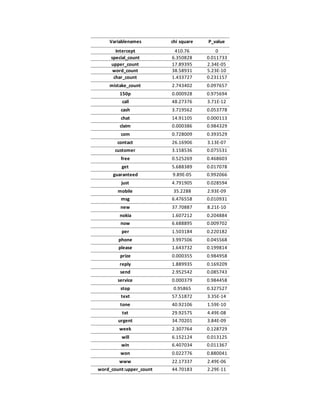
The flow of investigation naturally asks for the further investigation to incorporate interaction
terms in the model. Interaction terms, namely, word_count * special_count, special_count *
upper_count, upper_count*word_count, were incorporated sequentially and each time, all
previous predictors intact were kept intact. It is observed that the NagelKerke R-square value
continuously increased with the addition of interaction terms. The best NagelKerke R-square was
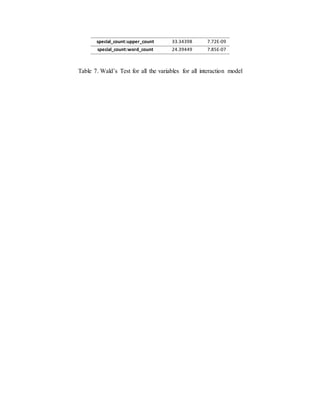
achieved when all the reported interaction terms were included along with the other 40 variables
(Table 5). Wald’s test (Table 7) was performed for all the predictor variables for the model
which gives the best Nagelkerke R-squared value (Table 6). The accuracy did not improve much
and it stays same even with the best model so far (Table 1, 2, 3, 4).
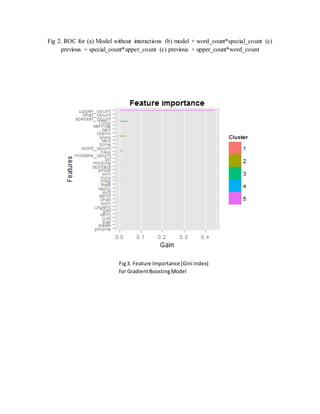
A boosting method ,which is an process of finding function in each iteration and caters to
different segmentation of the dataset for those all models from previous iteration are not
confident about, was also explored. The Gradient Boosting with general linear regression as the
basic model reaches an accuracy of 98.02% (Table 6) which is significantly higher than a single
logistic model. The ensemble performs better even in the front of minimizing the type-I error and
the threshold chosen was .85. It helps improve the type-II error and in turn improve the accuracy.
The result was compared with the report [7] which deals with same dataset and applies SVM,
Multinonimal Naive Bayes, KNN and AdaBoost with decision trees. It beats of their models in
terms of Type-I error which comes out as .40% in cost of the decrease in accuracy only by .06%.
V. CONCLUSION AND FUTURE SCOPE
The model presents an efficient spam detection algorithm which is at par with the state-of-the art
and has significantly low type-II error. Thus, it is highly efficient in detecting spam as well as
not blocking the hams. The drawback of this analysis is that it does not consider the combined
occurrence of words, which occurs naturally in language. The bi-gram and trigram frequency
analysis can be carried out to further, to improve the accuracy. Similar analysis can be carried in
case of emails, with almost similar features. As Xiaomi extended its capability of detecting spam
and built a recommendation engine which allows user to identify the spam messages, this
algorithm can be used for any in-house IT services in academic institutions which empowers
better spam detection while keeping the type-II error very low.](https://image.slidesharecdn.com/reportpdgbacdagroup2-160815121705/85/Enabling-Spam-filtering-4-320.jpg)
![REFERENCES:
[1] https://en.wikipedia.org/wiki/Short_Message_Service
[2] http://whatis.techtarget.com/definition/filter
[3] http://www-users.cs.umn.edu/~zhzhang/Papers/raid2013_jiang_spam.pdf
[4] https://www.aeaweb.org/articles?id=10.1257/jep.26.3.87
[5] http://cs229.stanford.edu/proj2013/ShiraniMehrSMSSpamDetectionUsingMachineLearningApproach.pdf
[6] https://en.wikipedia.org/wiki/Stop_words
[7] http://cs229.stanford.edu/proj2013/ShiraniMehr-SMSSpamDetectionUsingMachineLearningApproach.pdf
[8] https://archive.ics.uci.edu/ml/datasets/SMS+Spam+Collection](https://image.slidesharecdn.com/reportpdgbacdagroup2-160815121705/85/Enabling-Spam-filtering-5-320.jpg)


![[DSC Europe 25] Milos Belcevic - Product Professional's Journey to Full-Stack...](https://cdn.slidesharecdn.com/ss_thumbnails/1zovd6fgsycdg4wvgvls-milos-belcevic-product-professionals-journey-to-full-stack-product-developer-260123083019-d993120d-thumbnail.jpg?width=640&height=640&fit=bounds)


![[DSC Europe 25] Ekaterina Bubenko - Behind the Curtain: How Data Roles Collab...](https://cdn.slidesharecdn.com/ss_thumbnails/anmv6x8dstqbbzchoklr-ekaterina-bubenko-behind-the-curtain-how-data-roles-collaborate-in-the-ai-era-a-260123083019-4b252ec7-thumbnail.jpg?width=640&height=640&fit=bounds)