Download to read offline
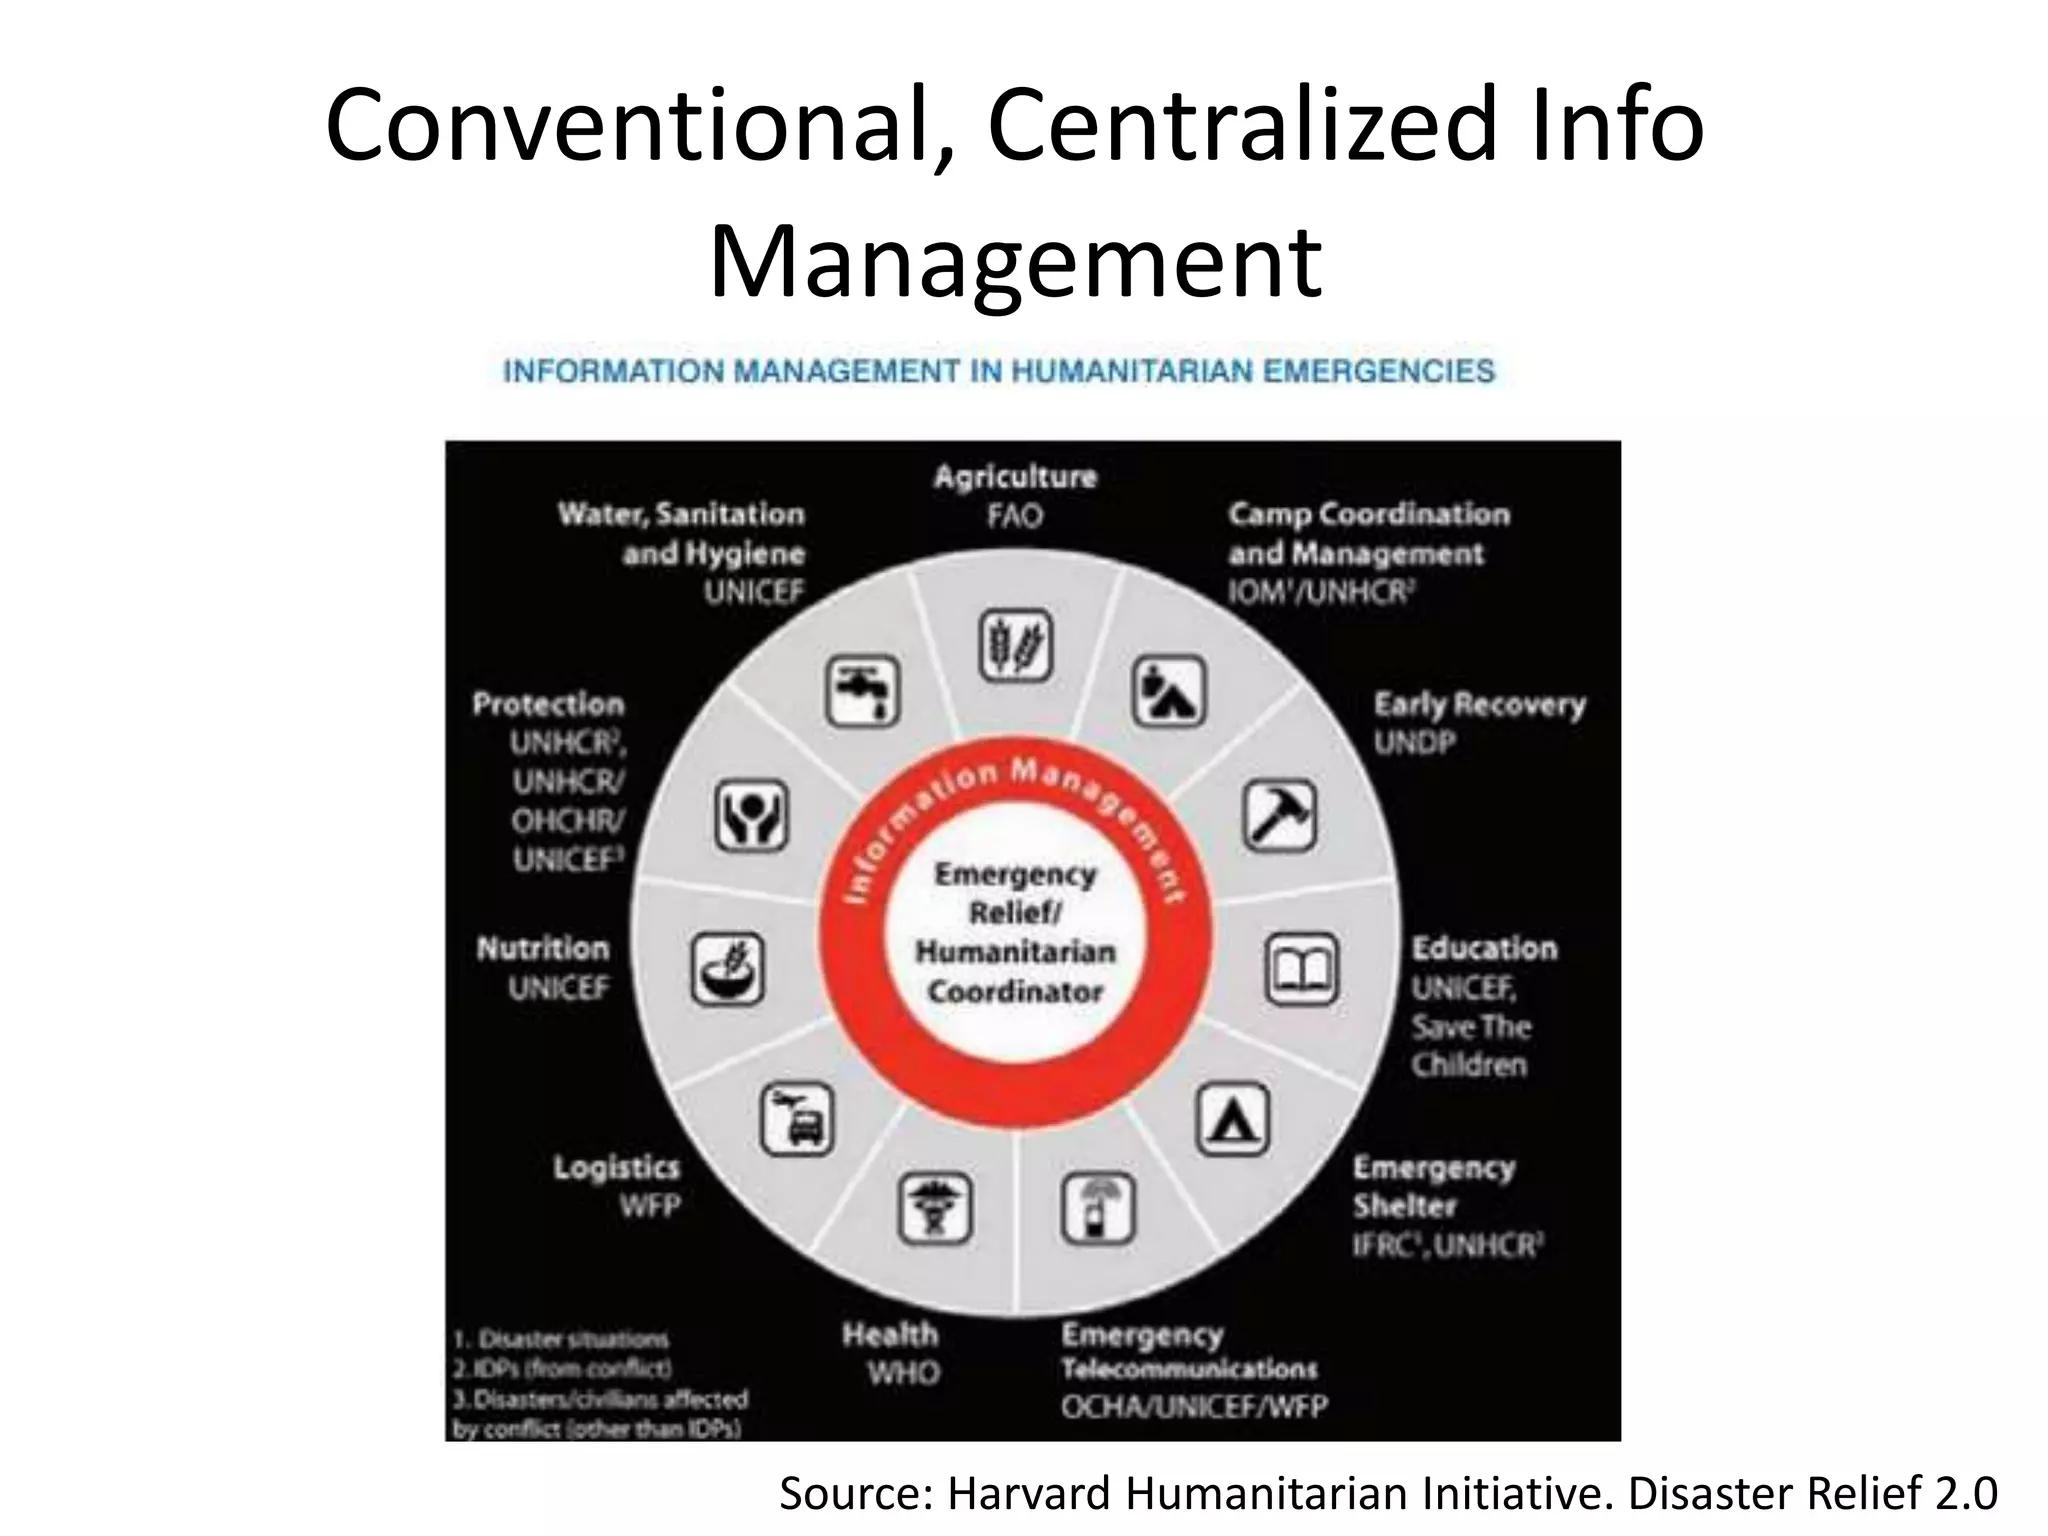
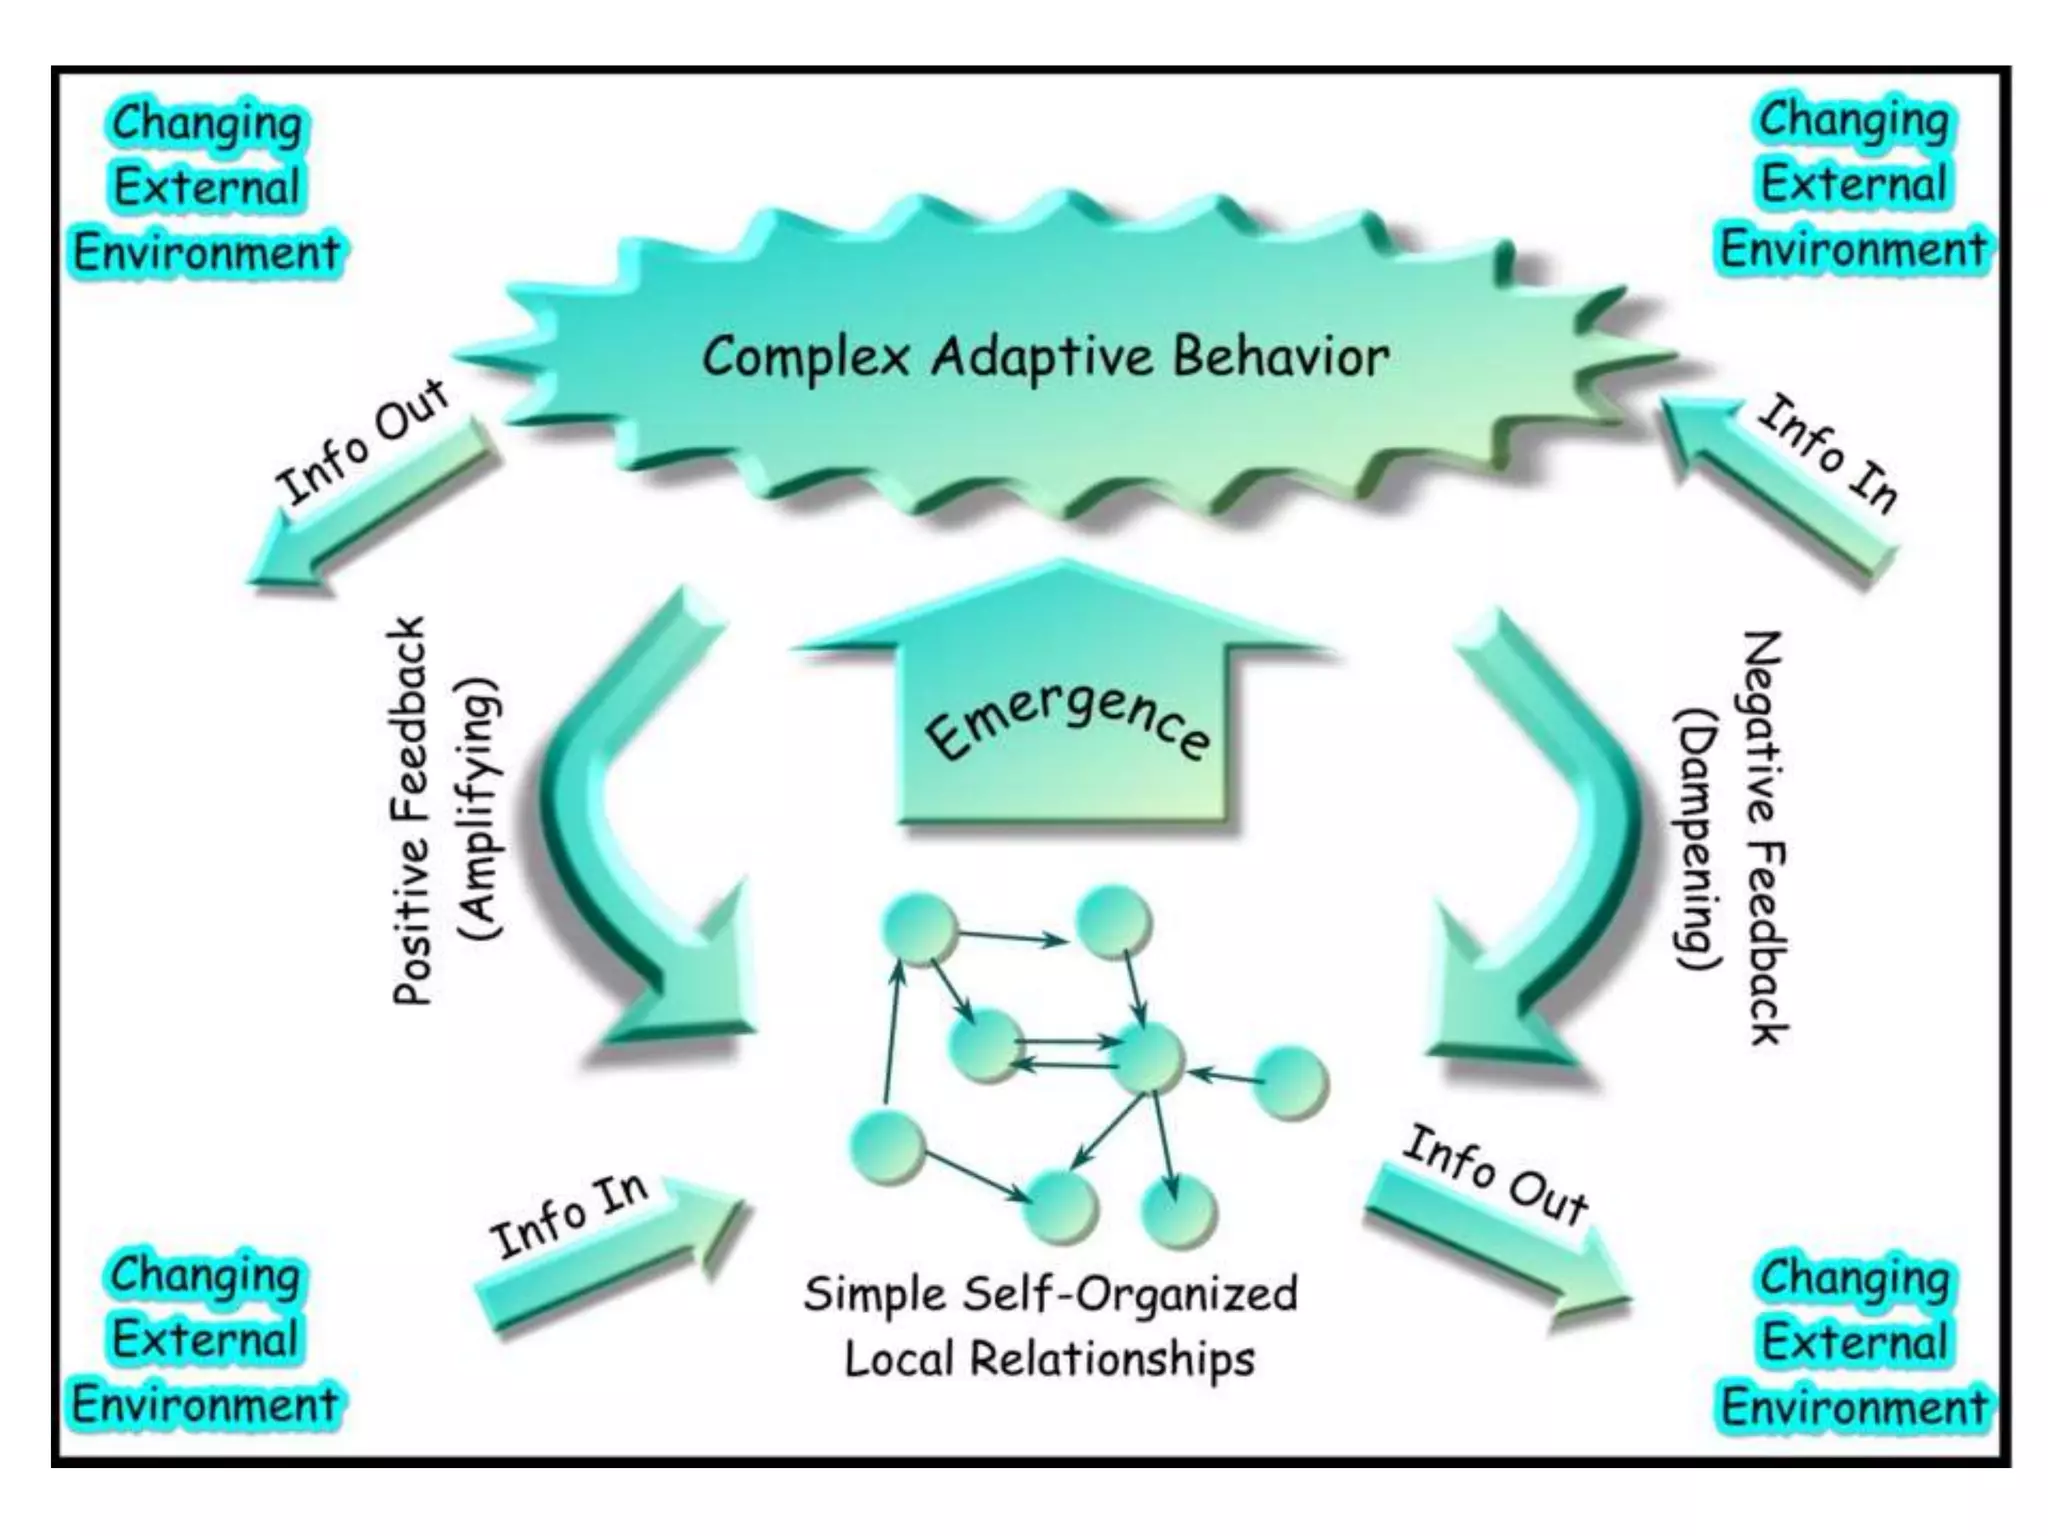
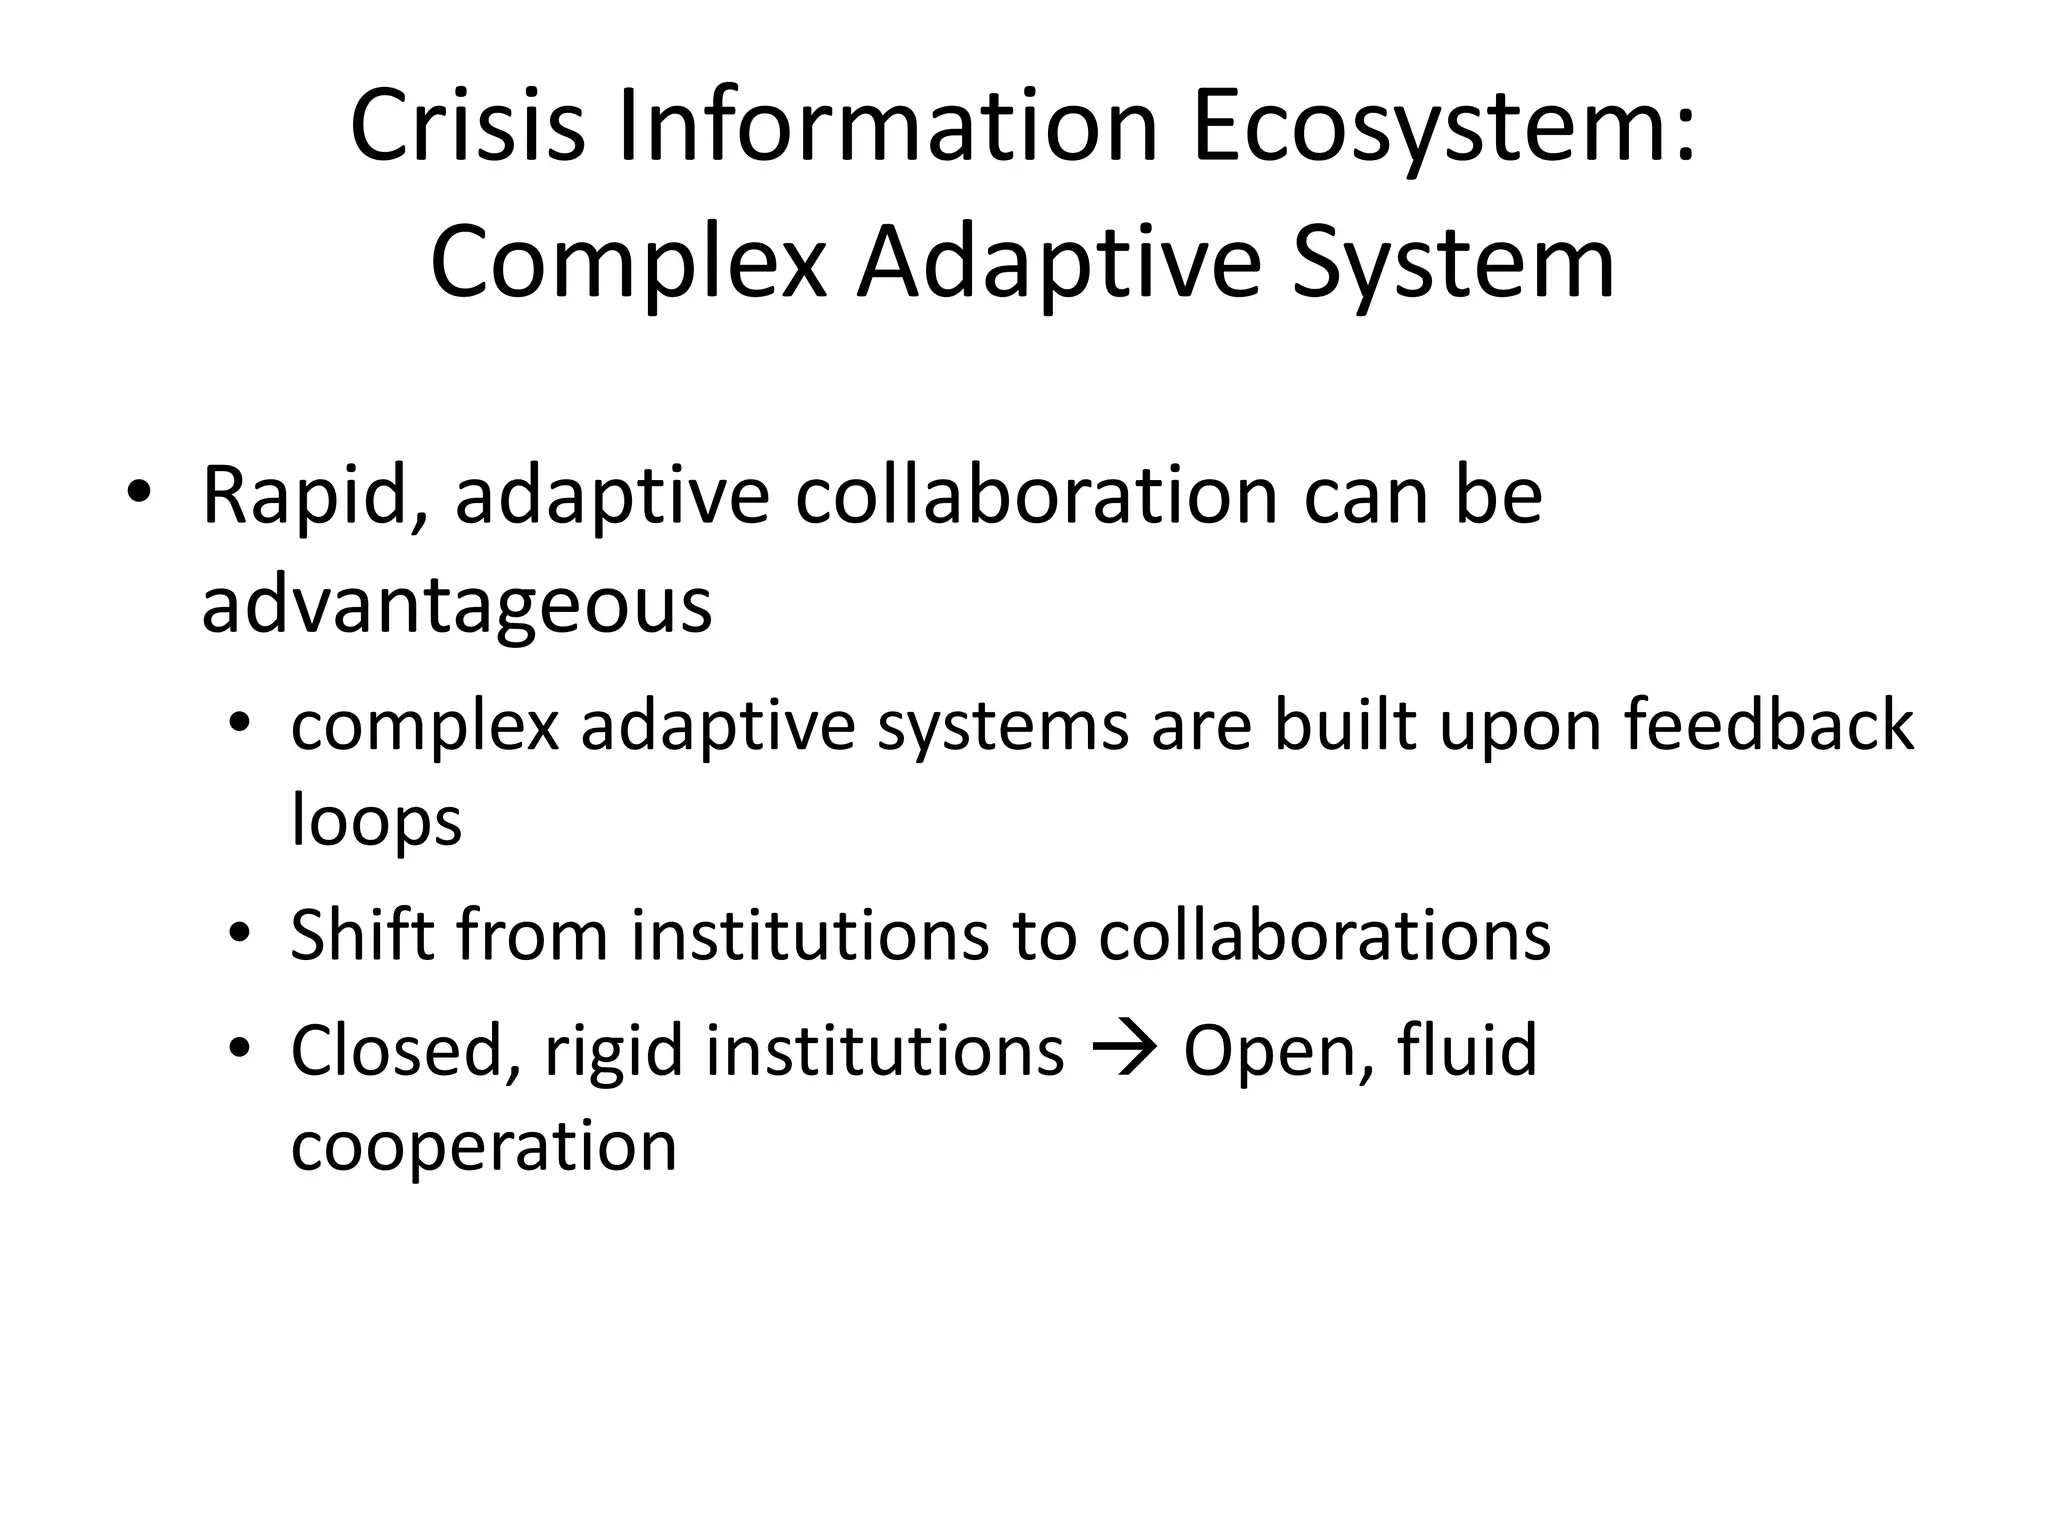
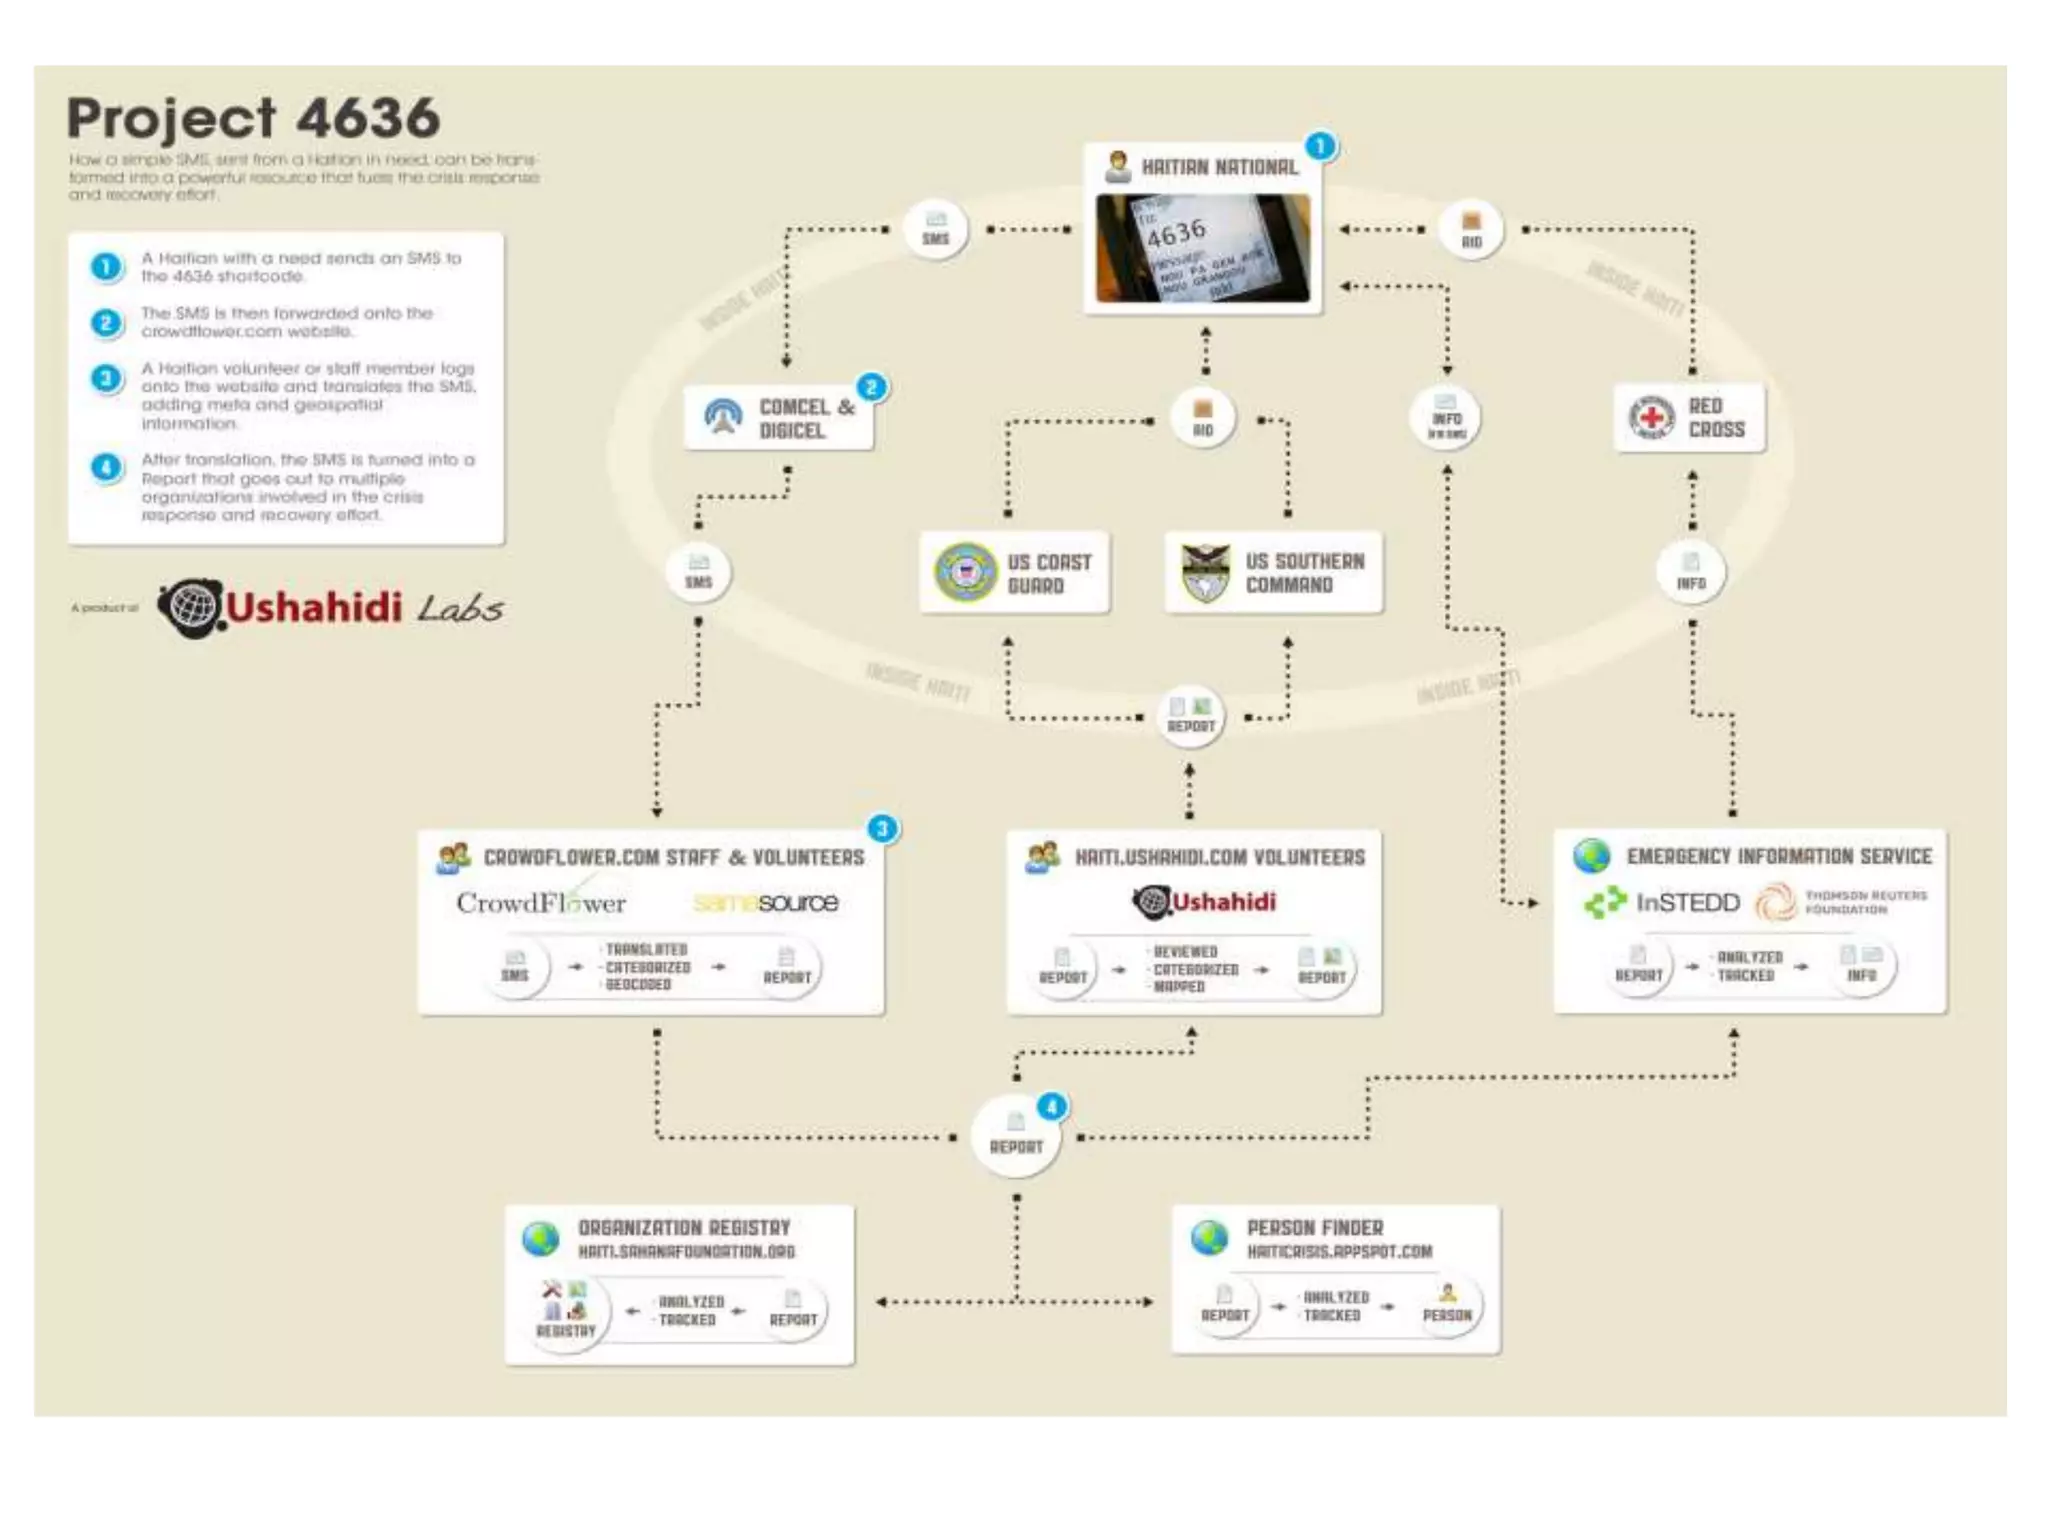
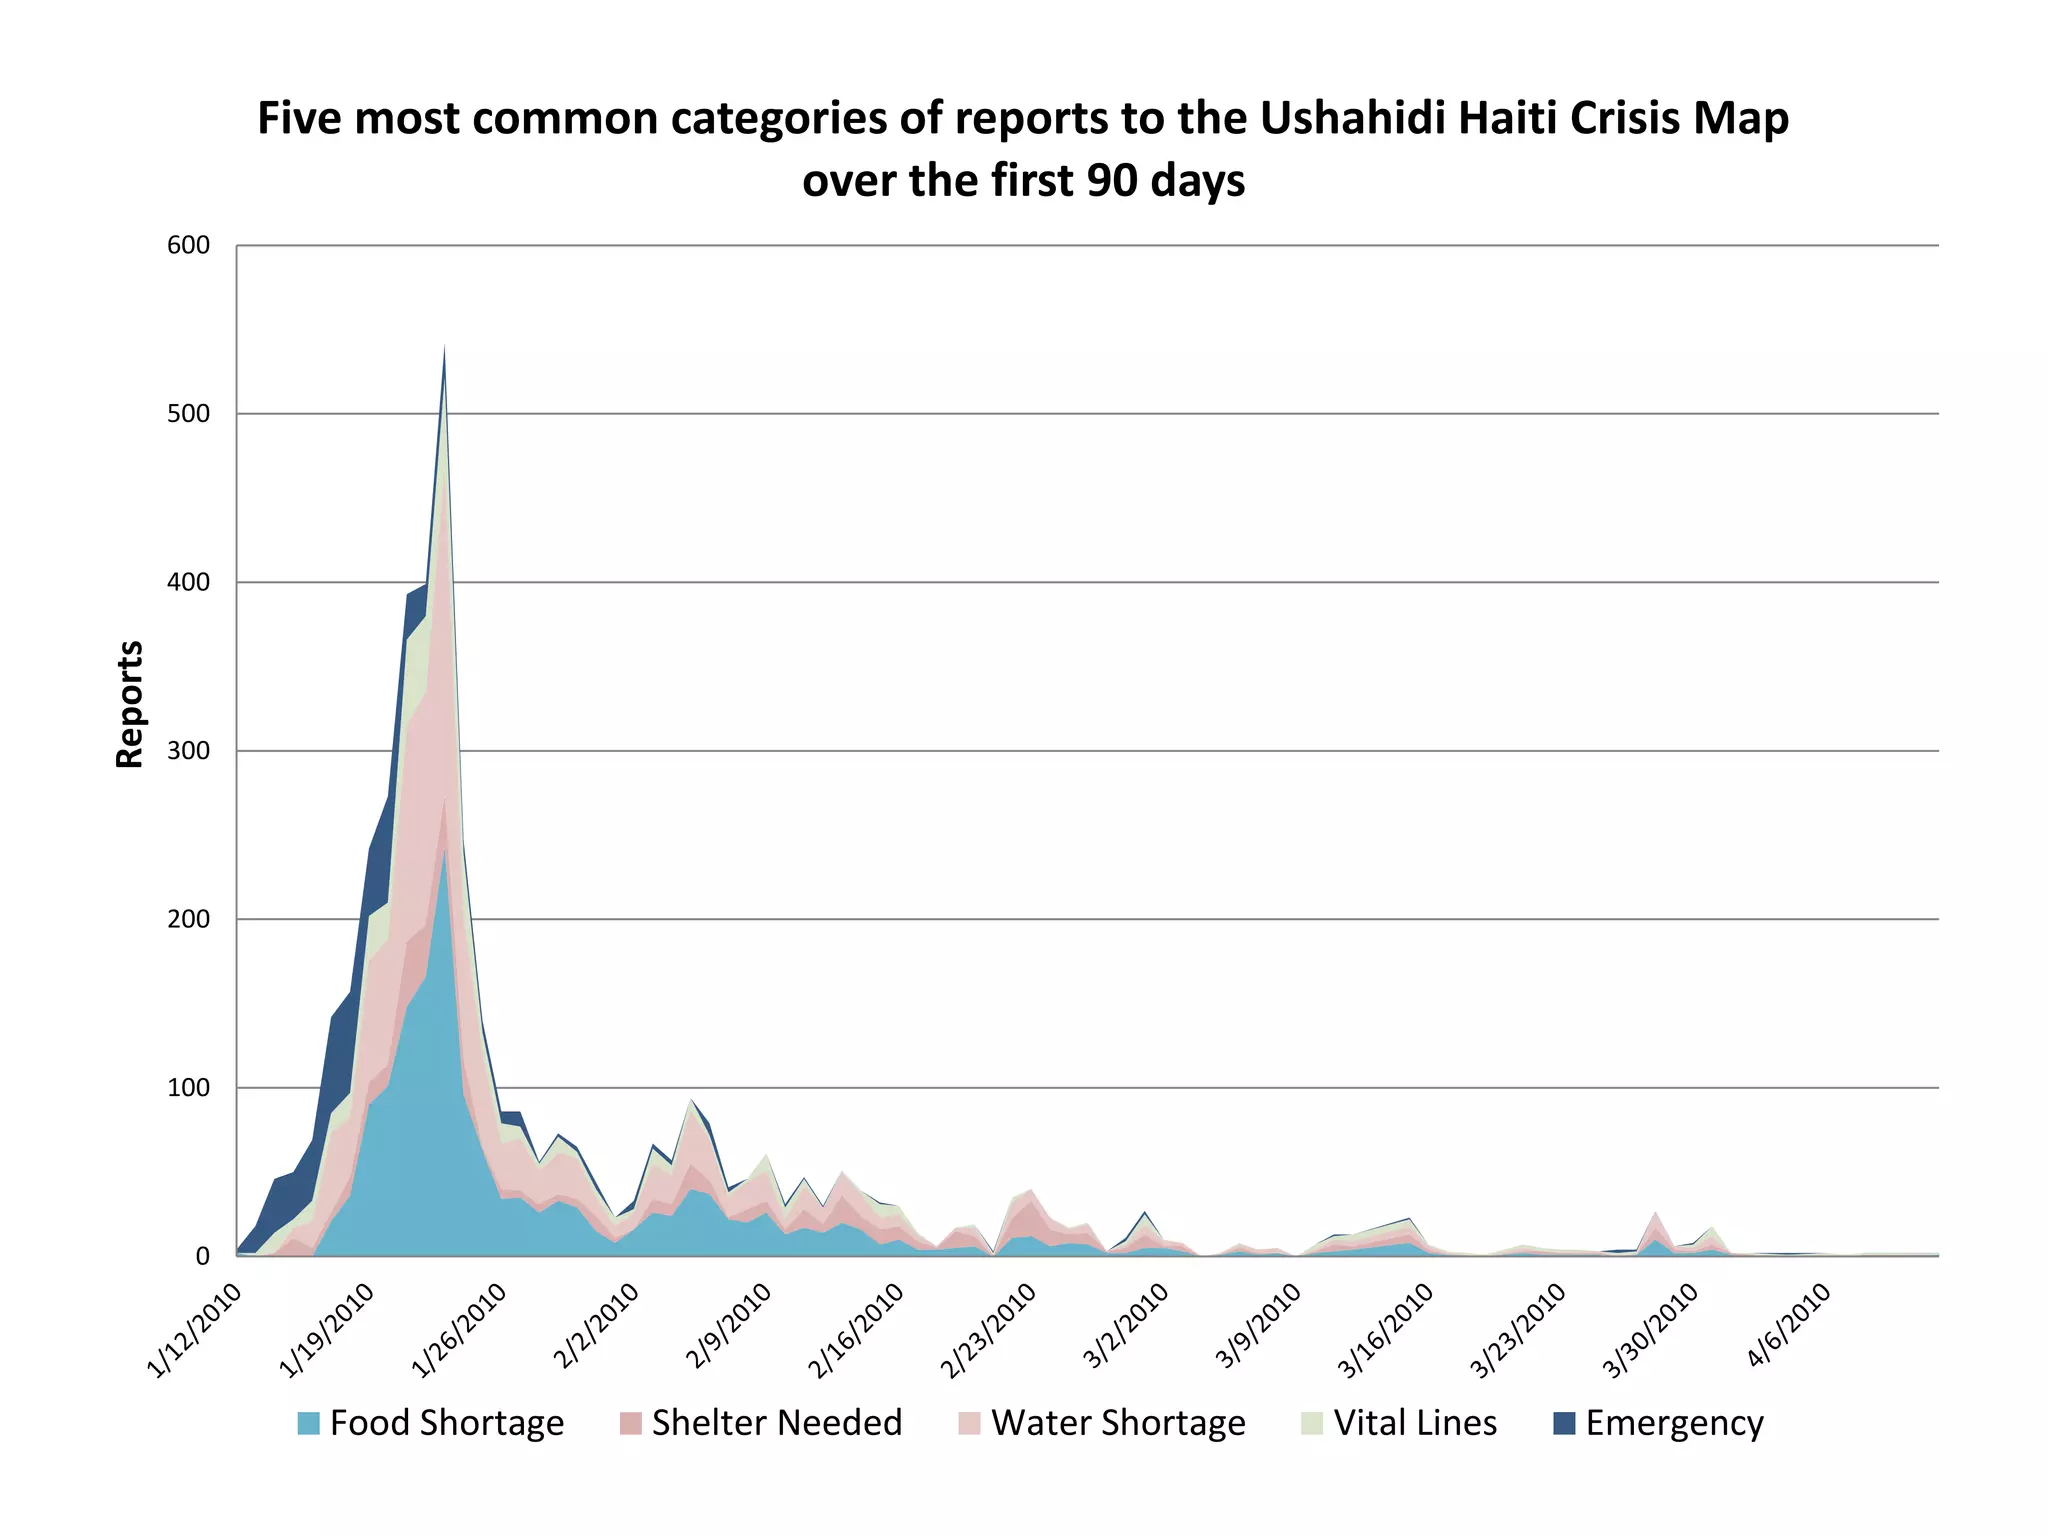
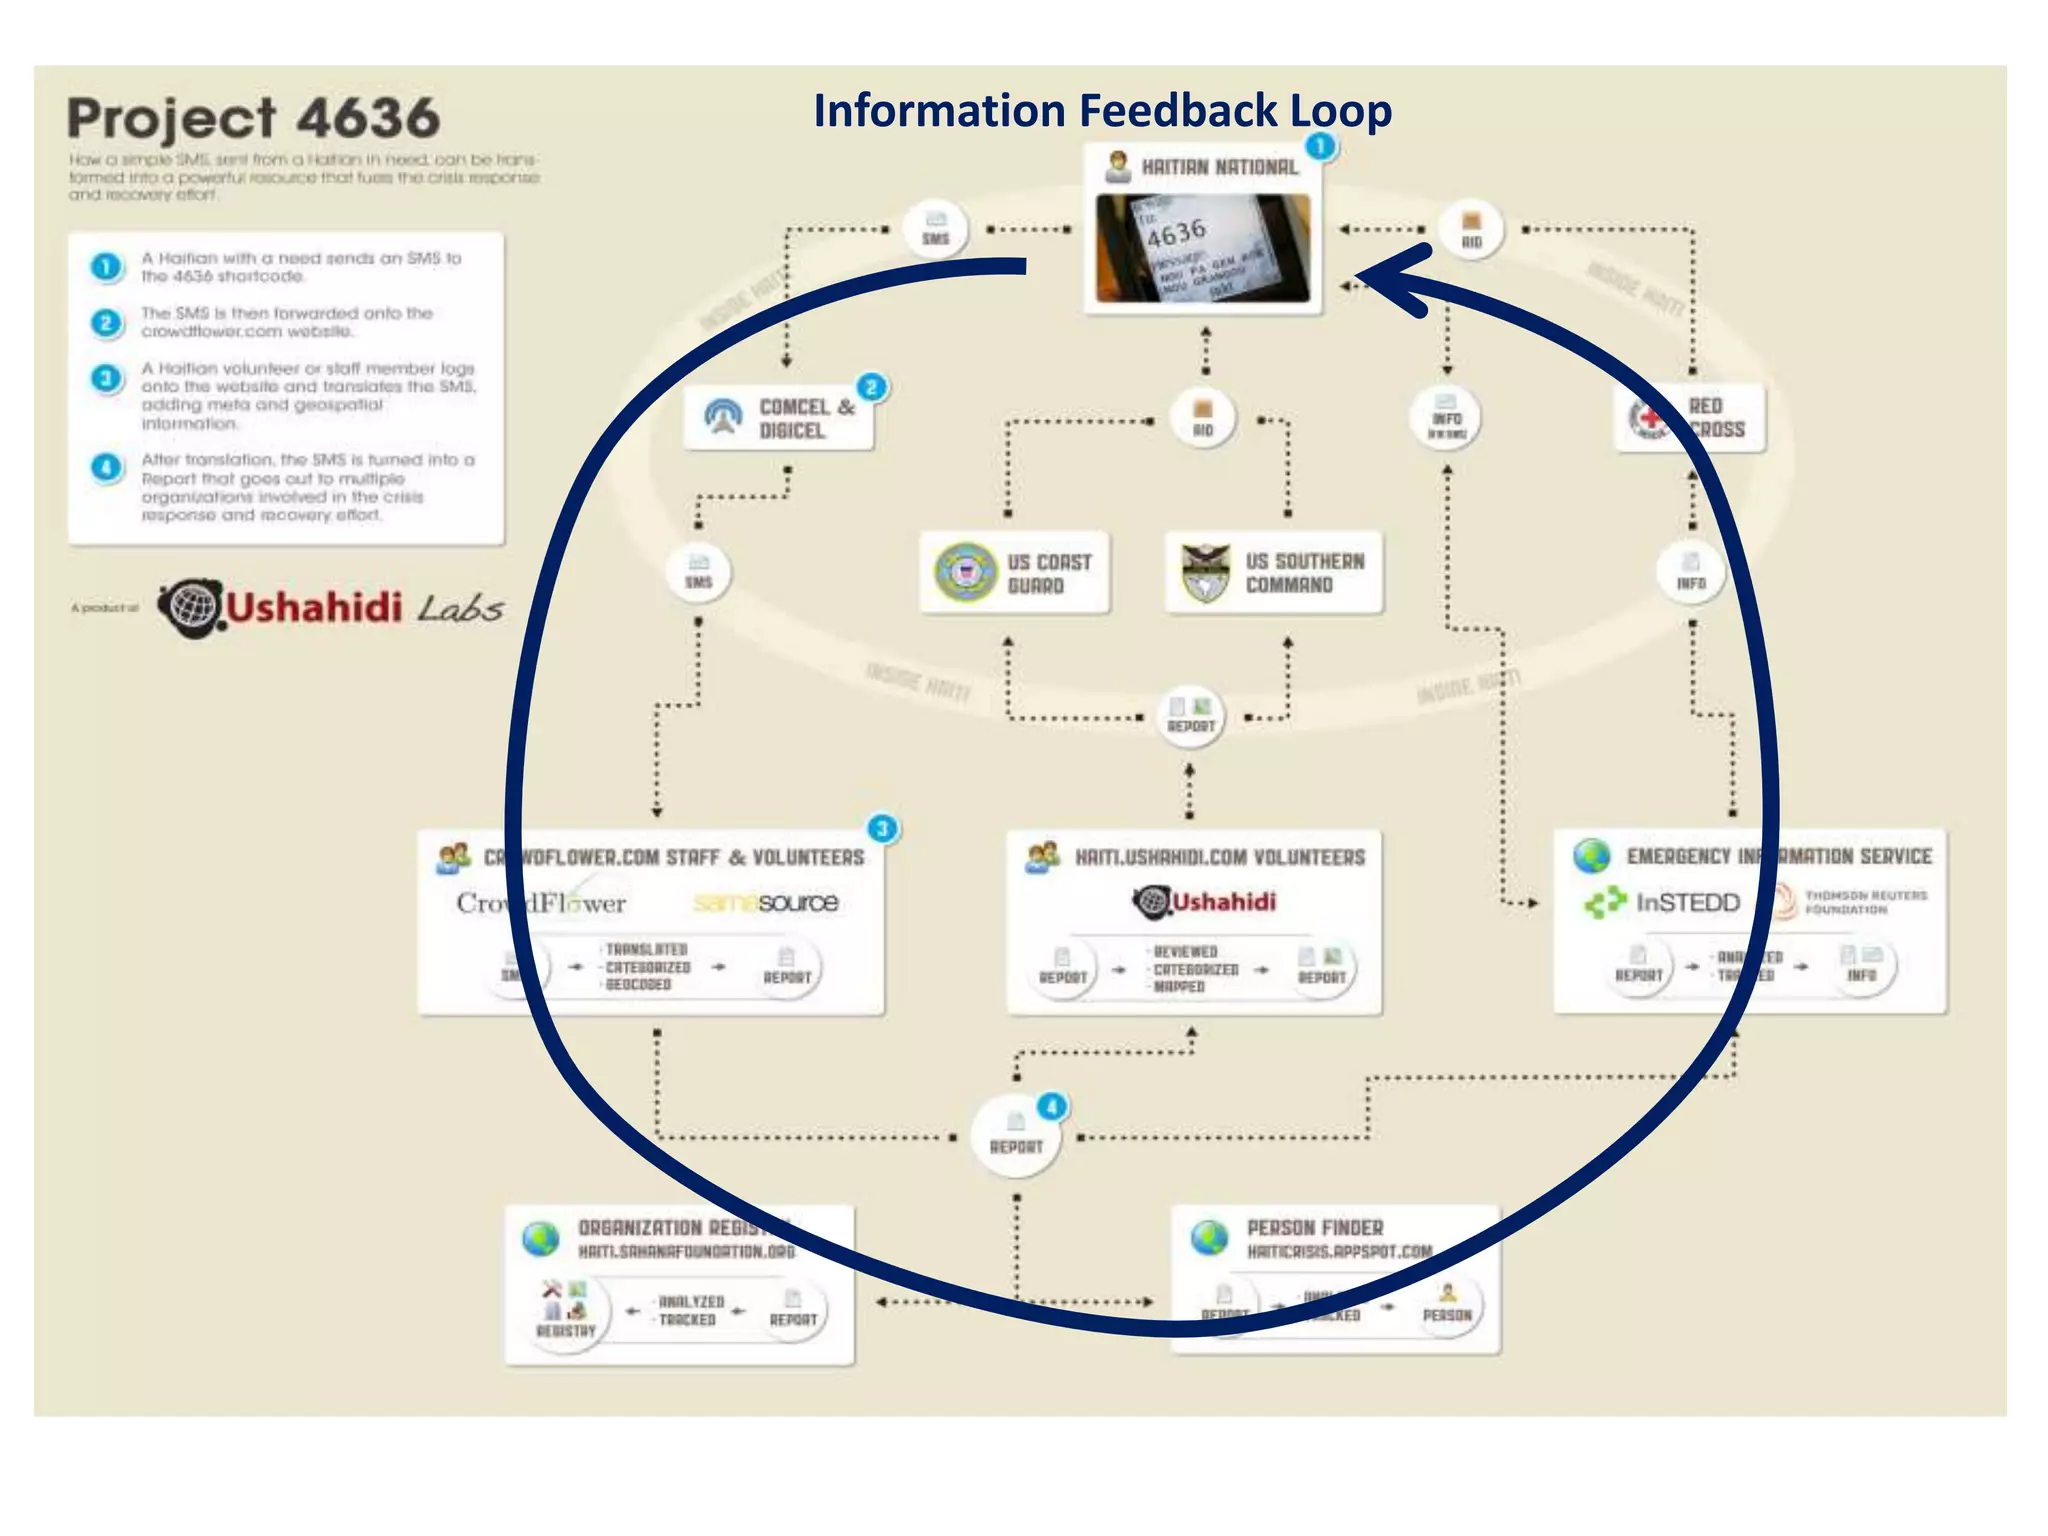
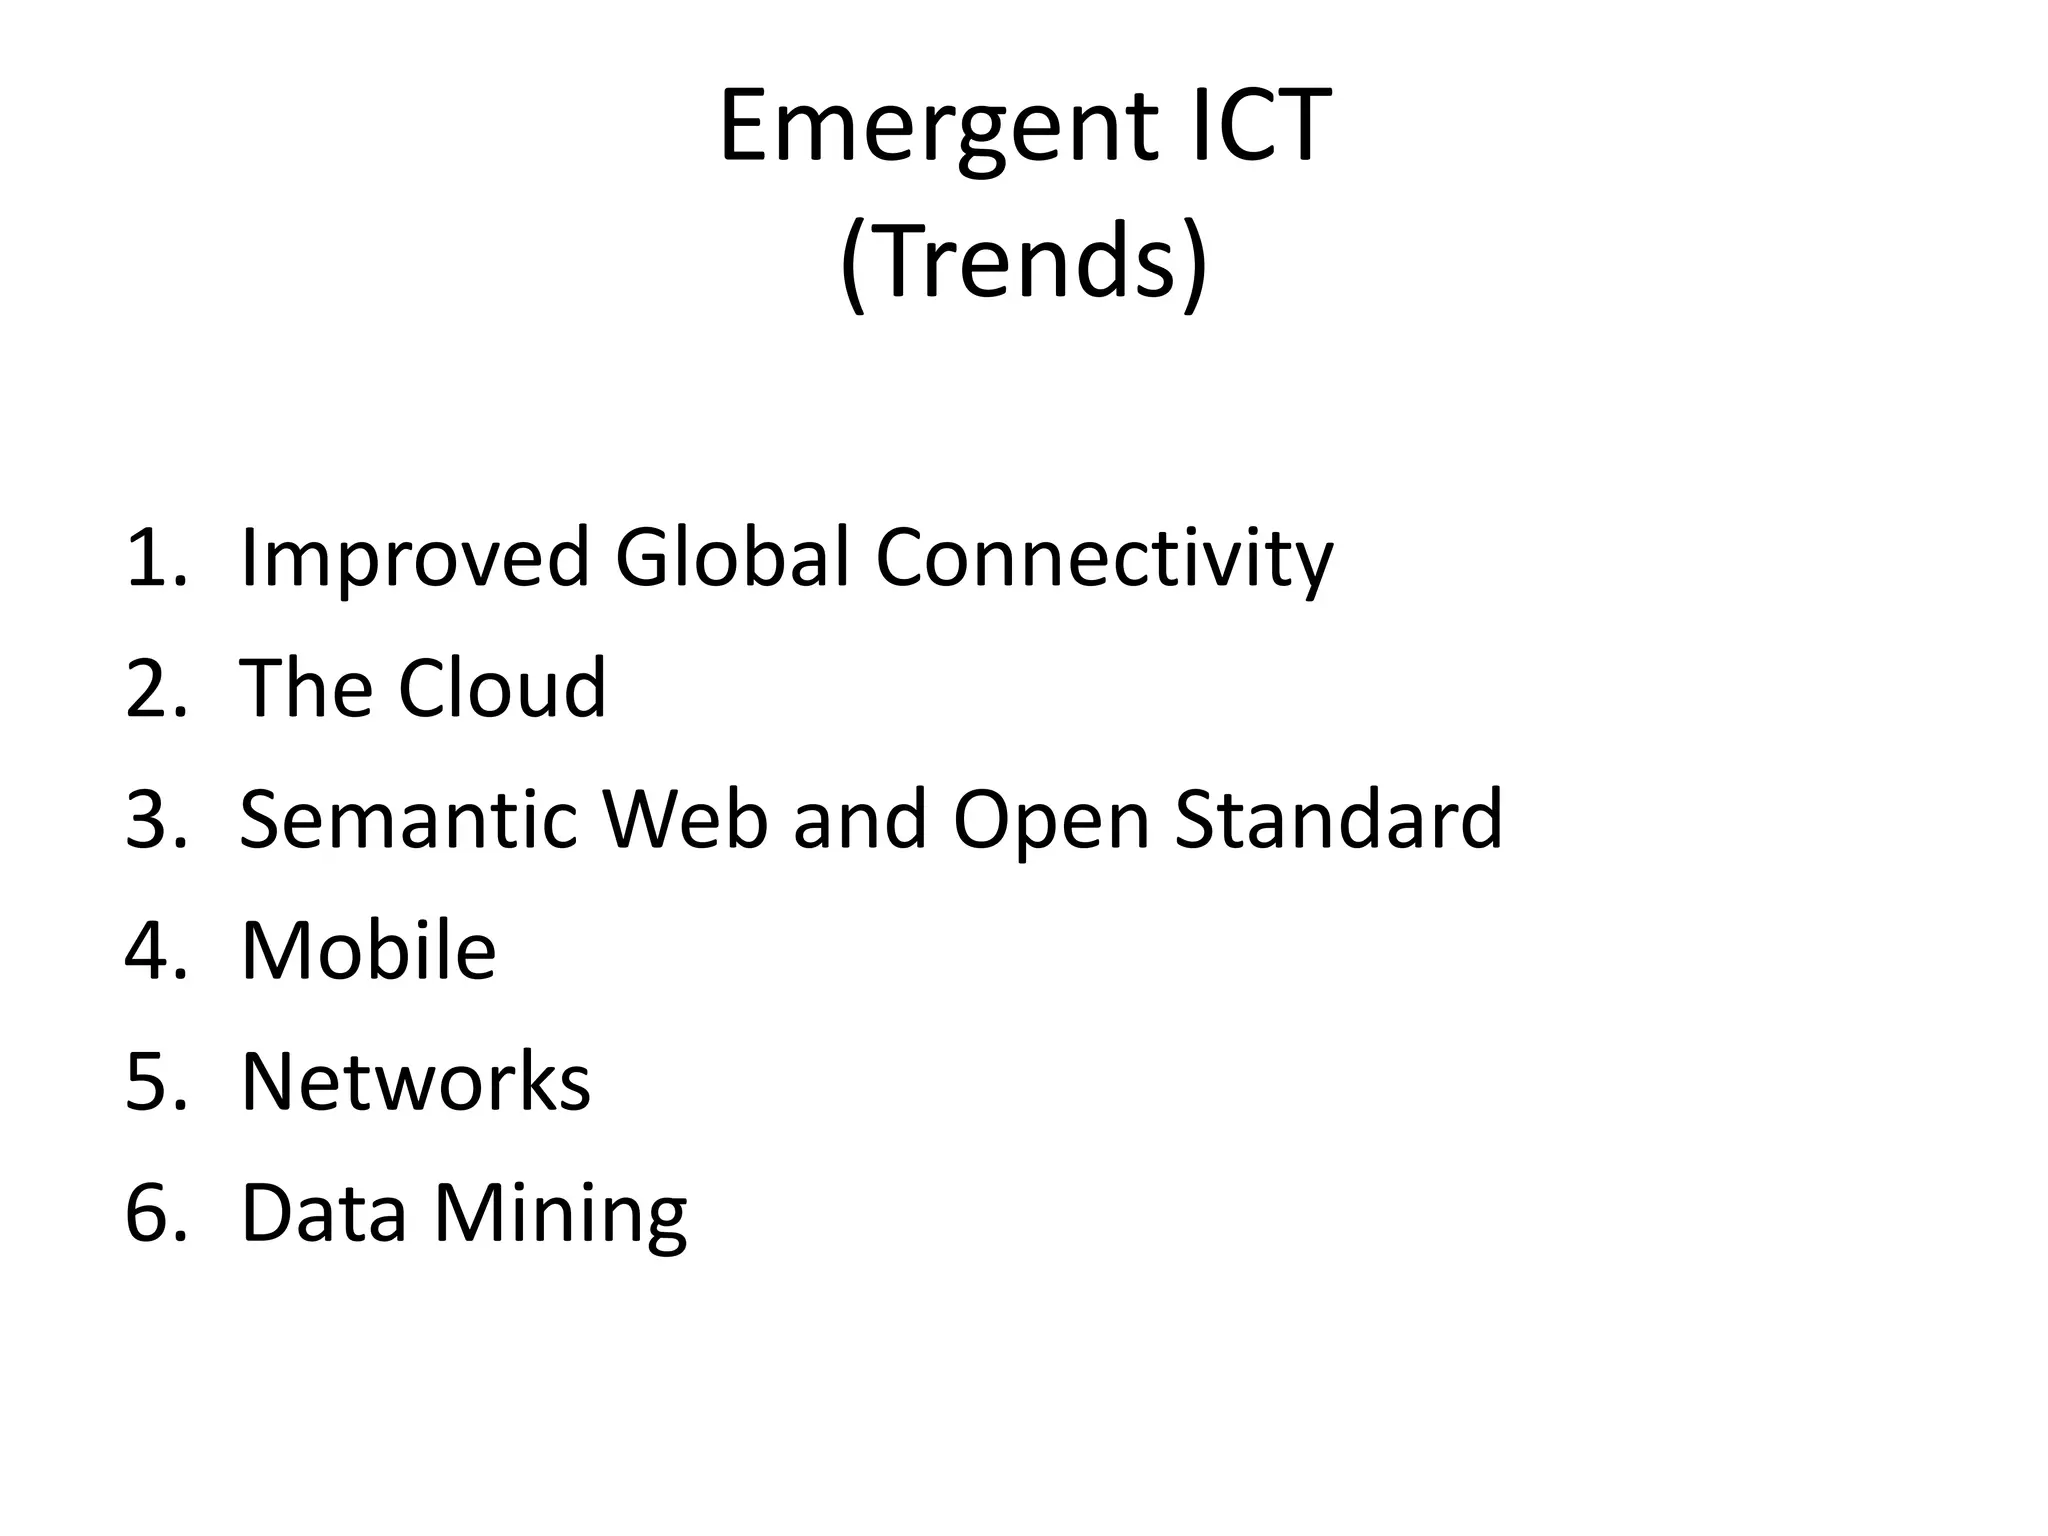
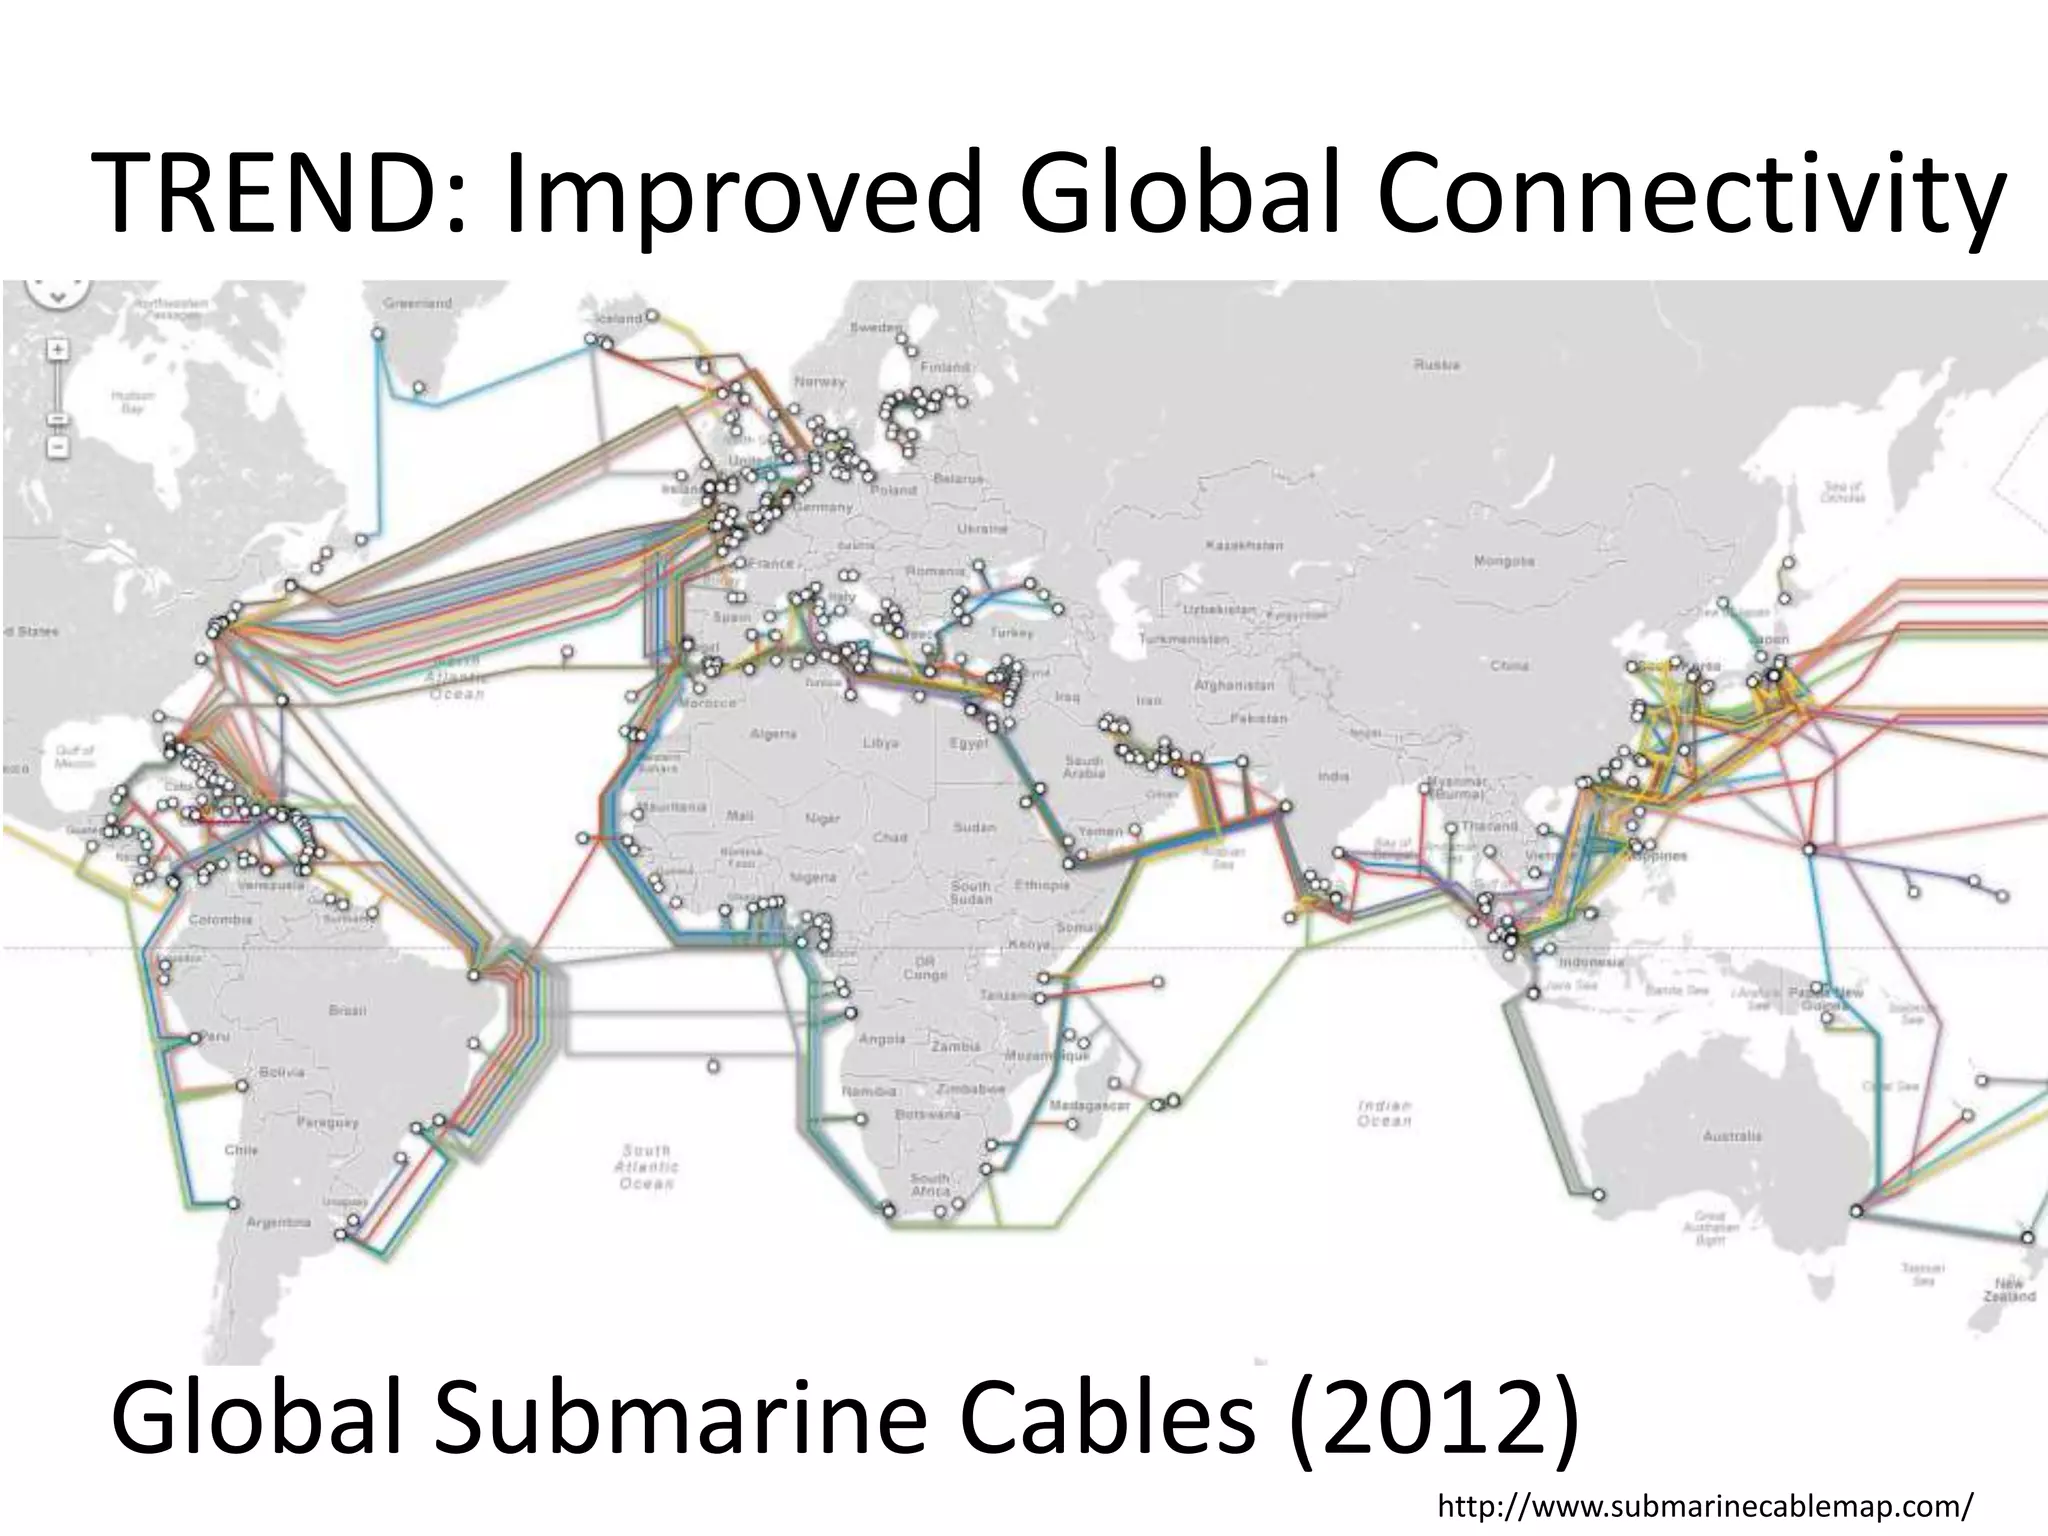
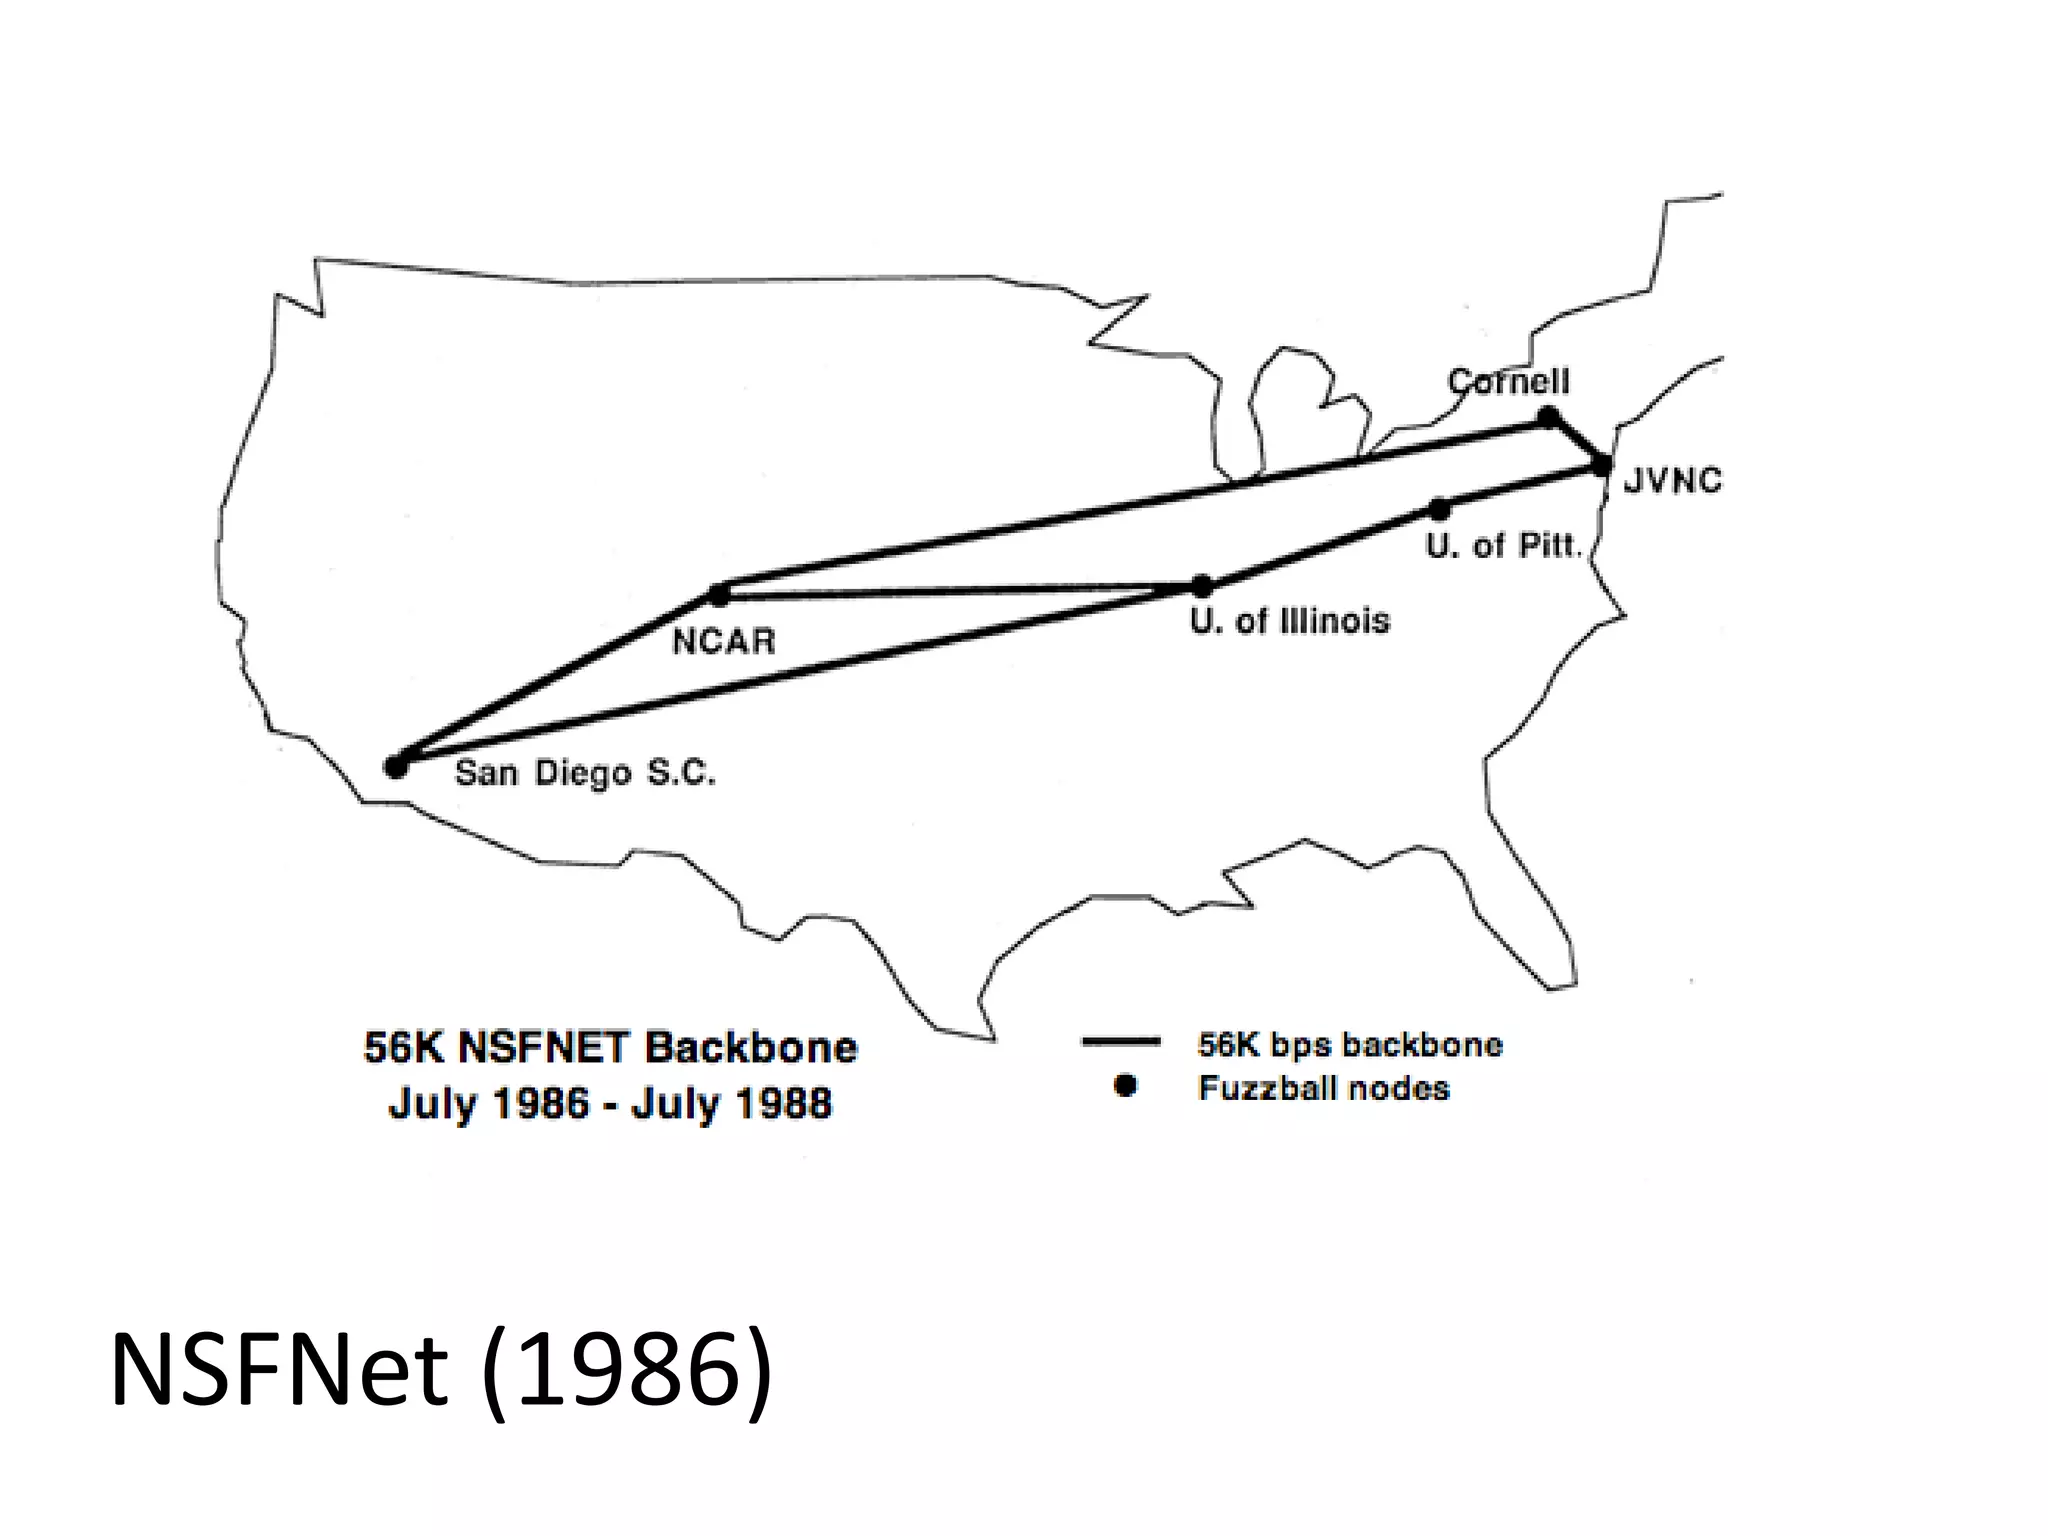
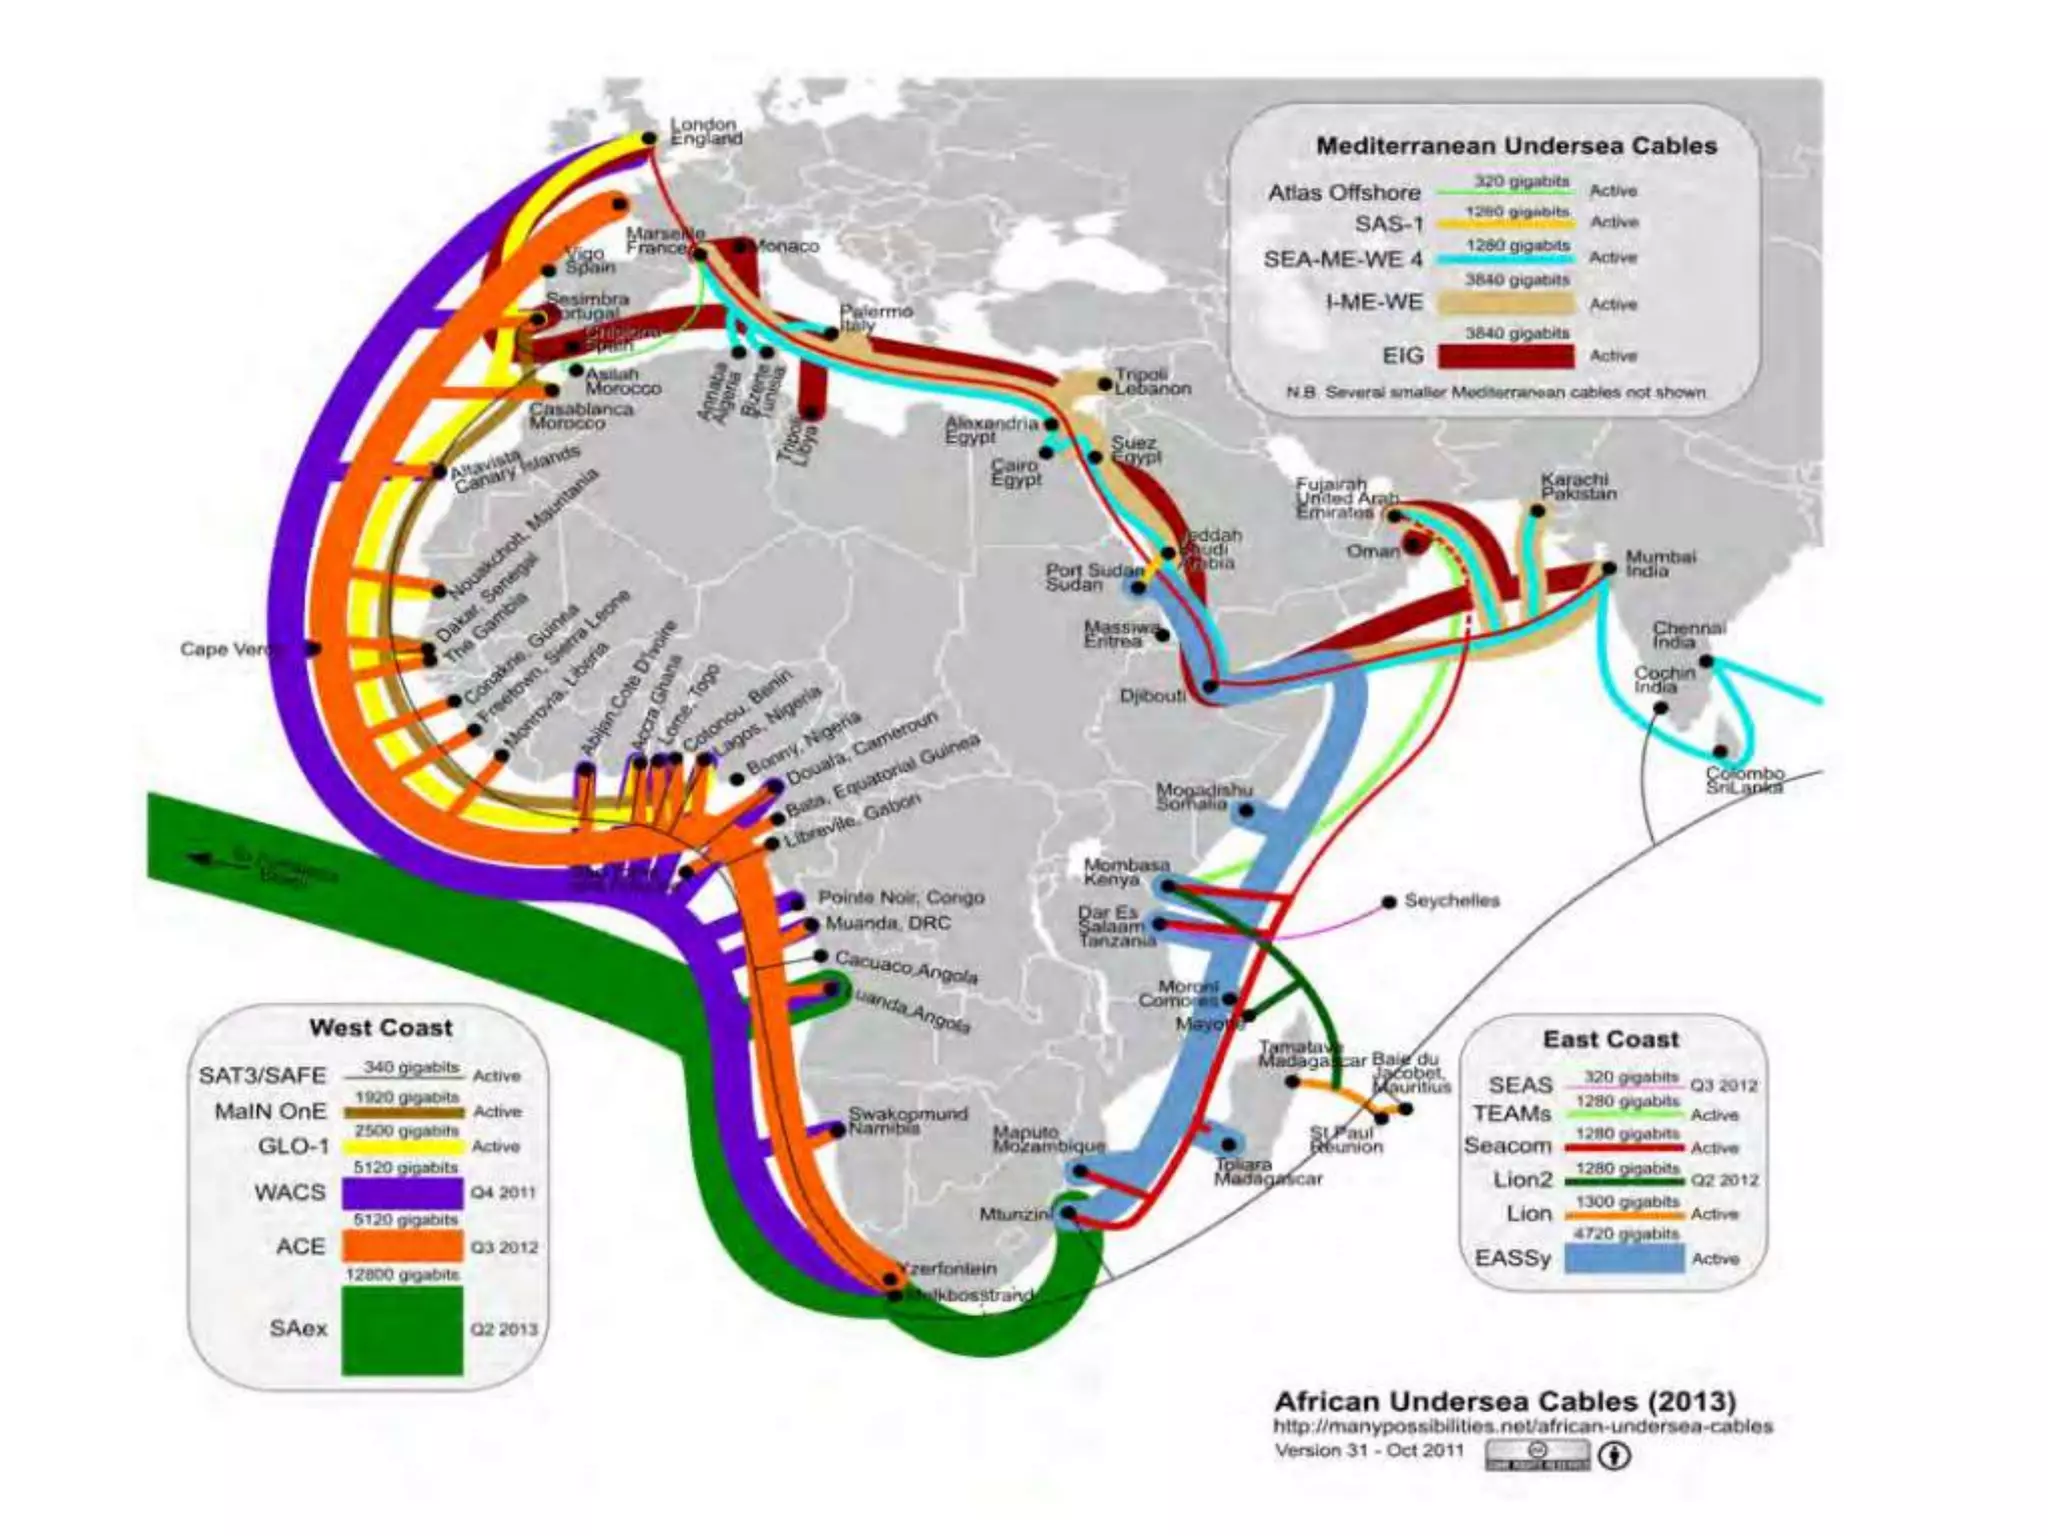
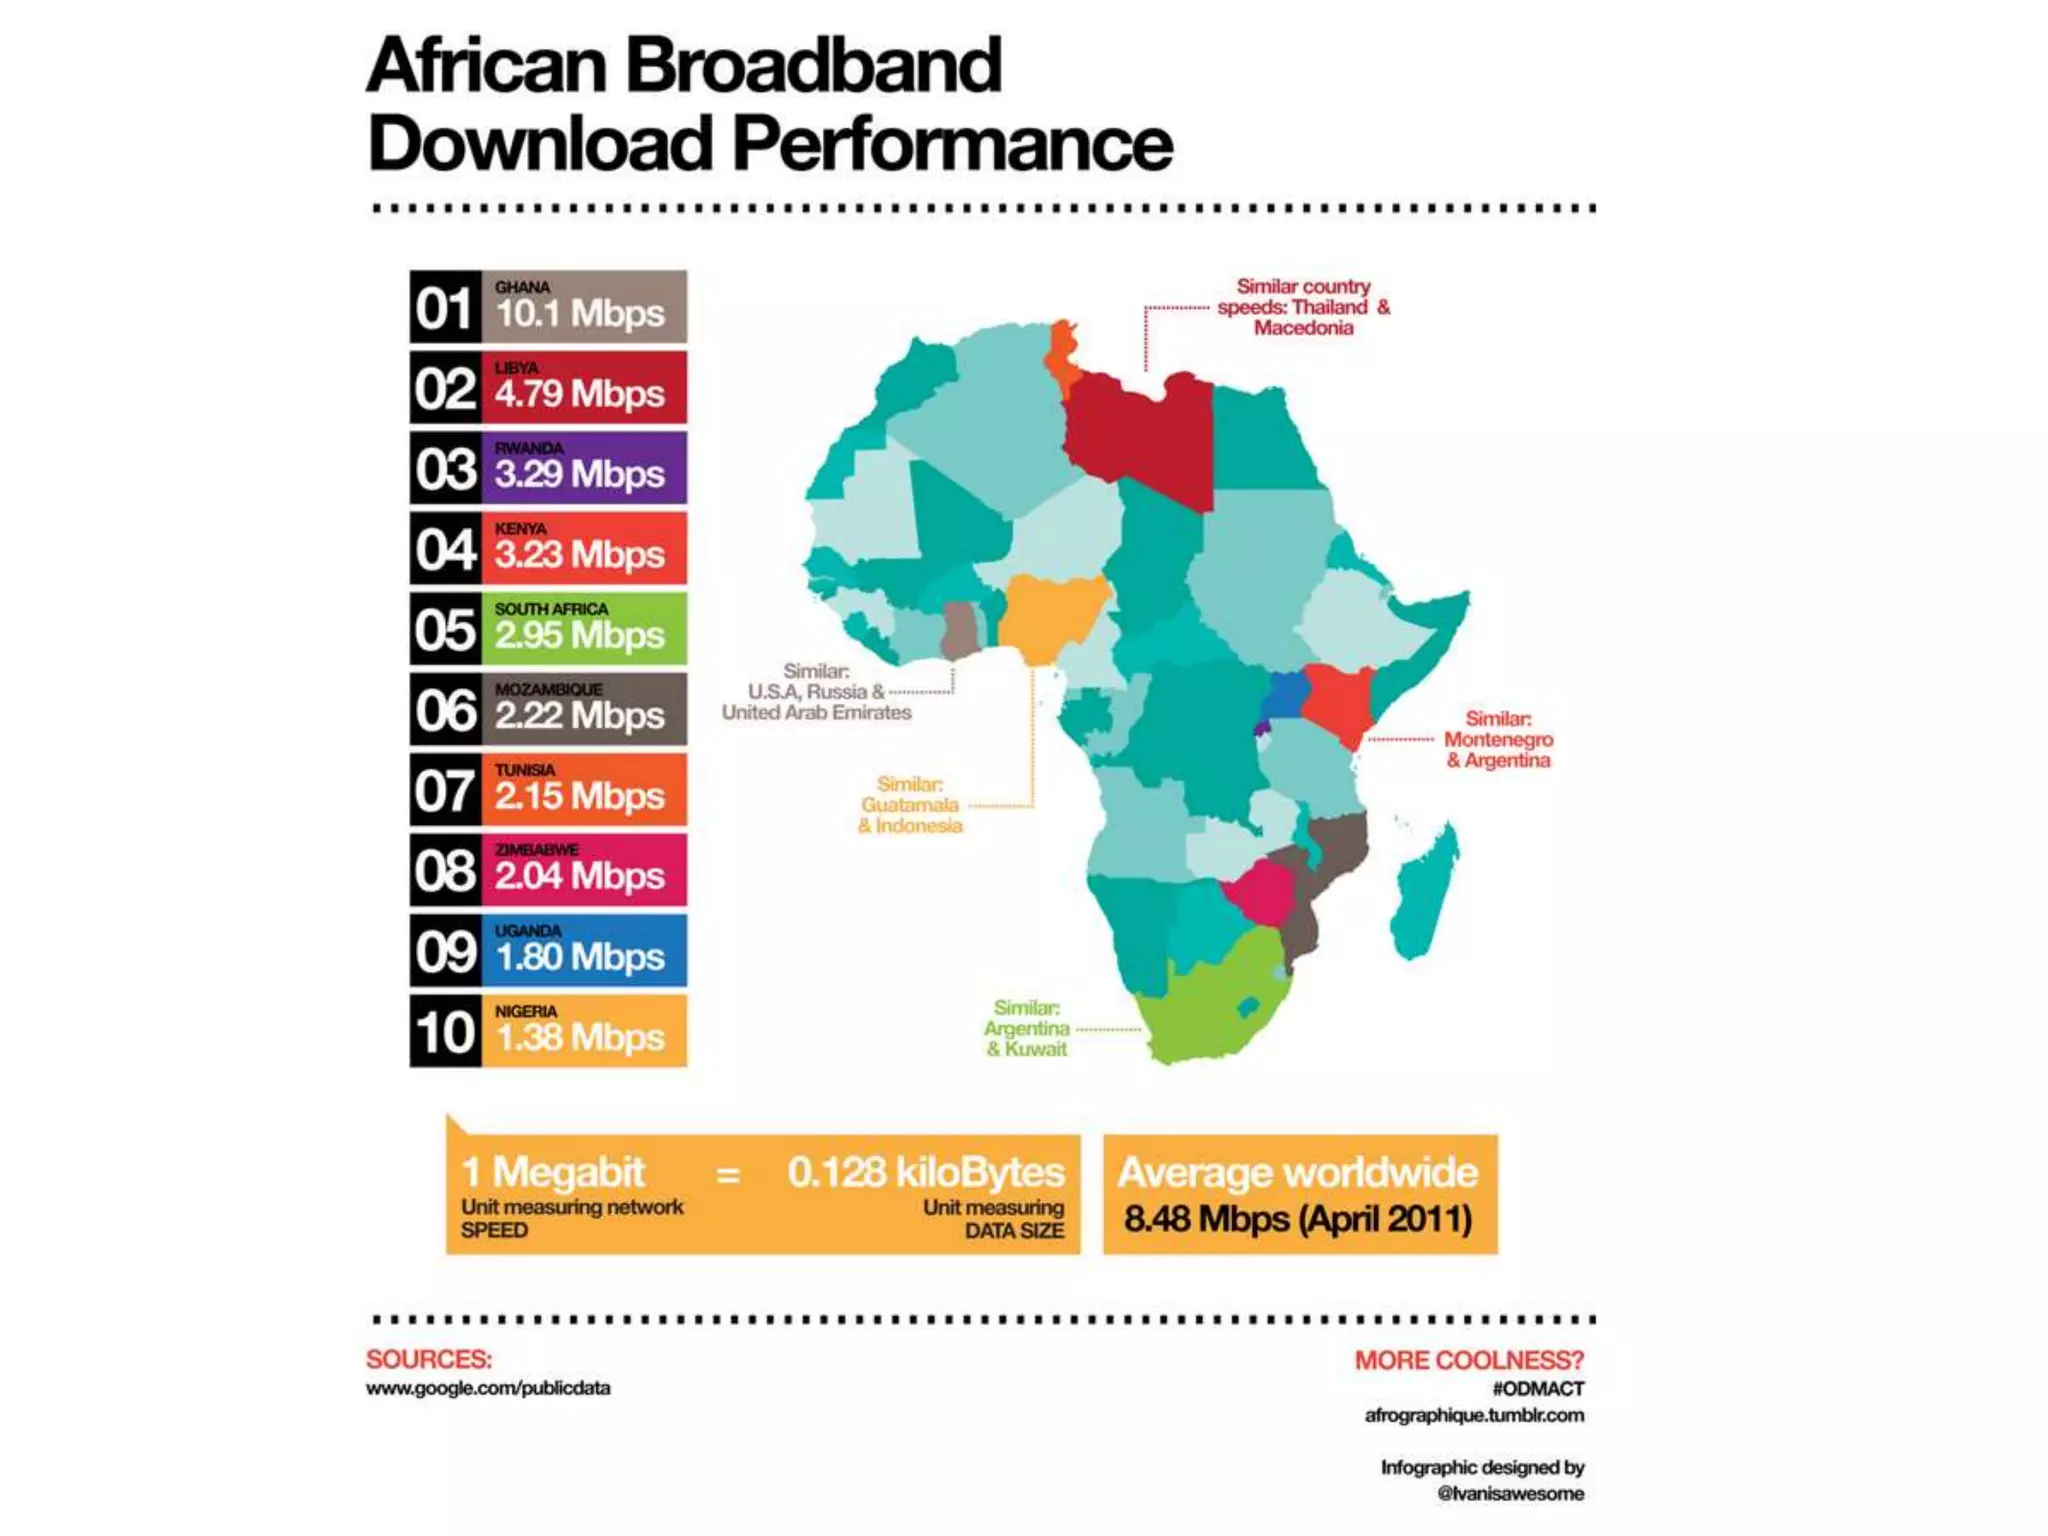
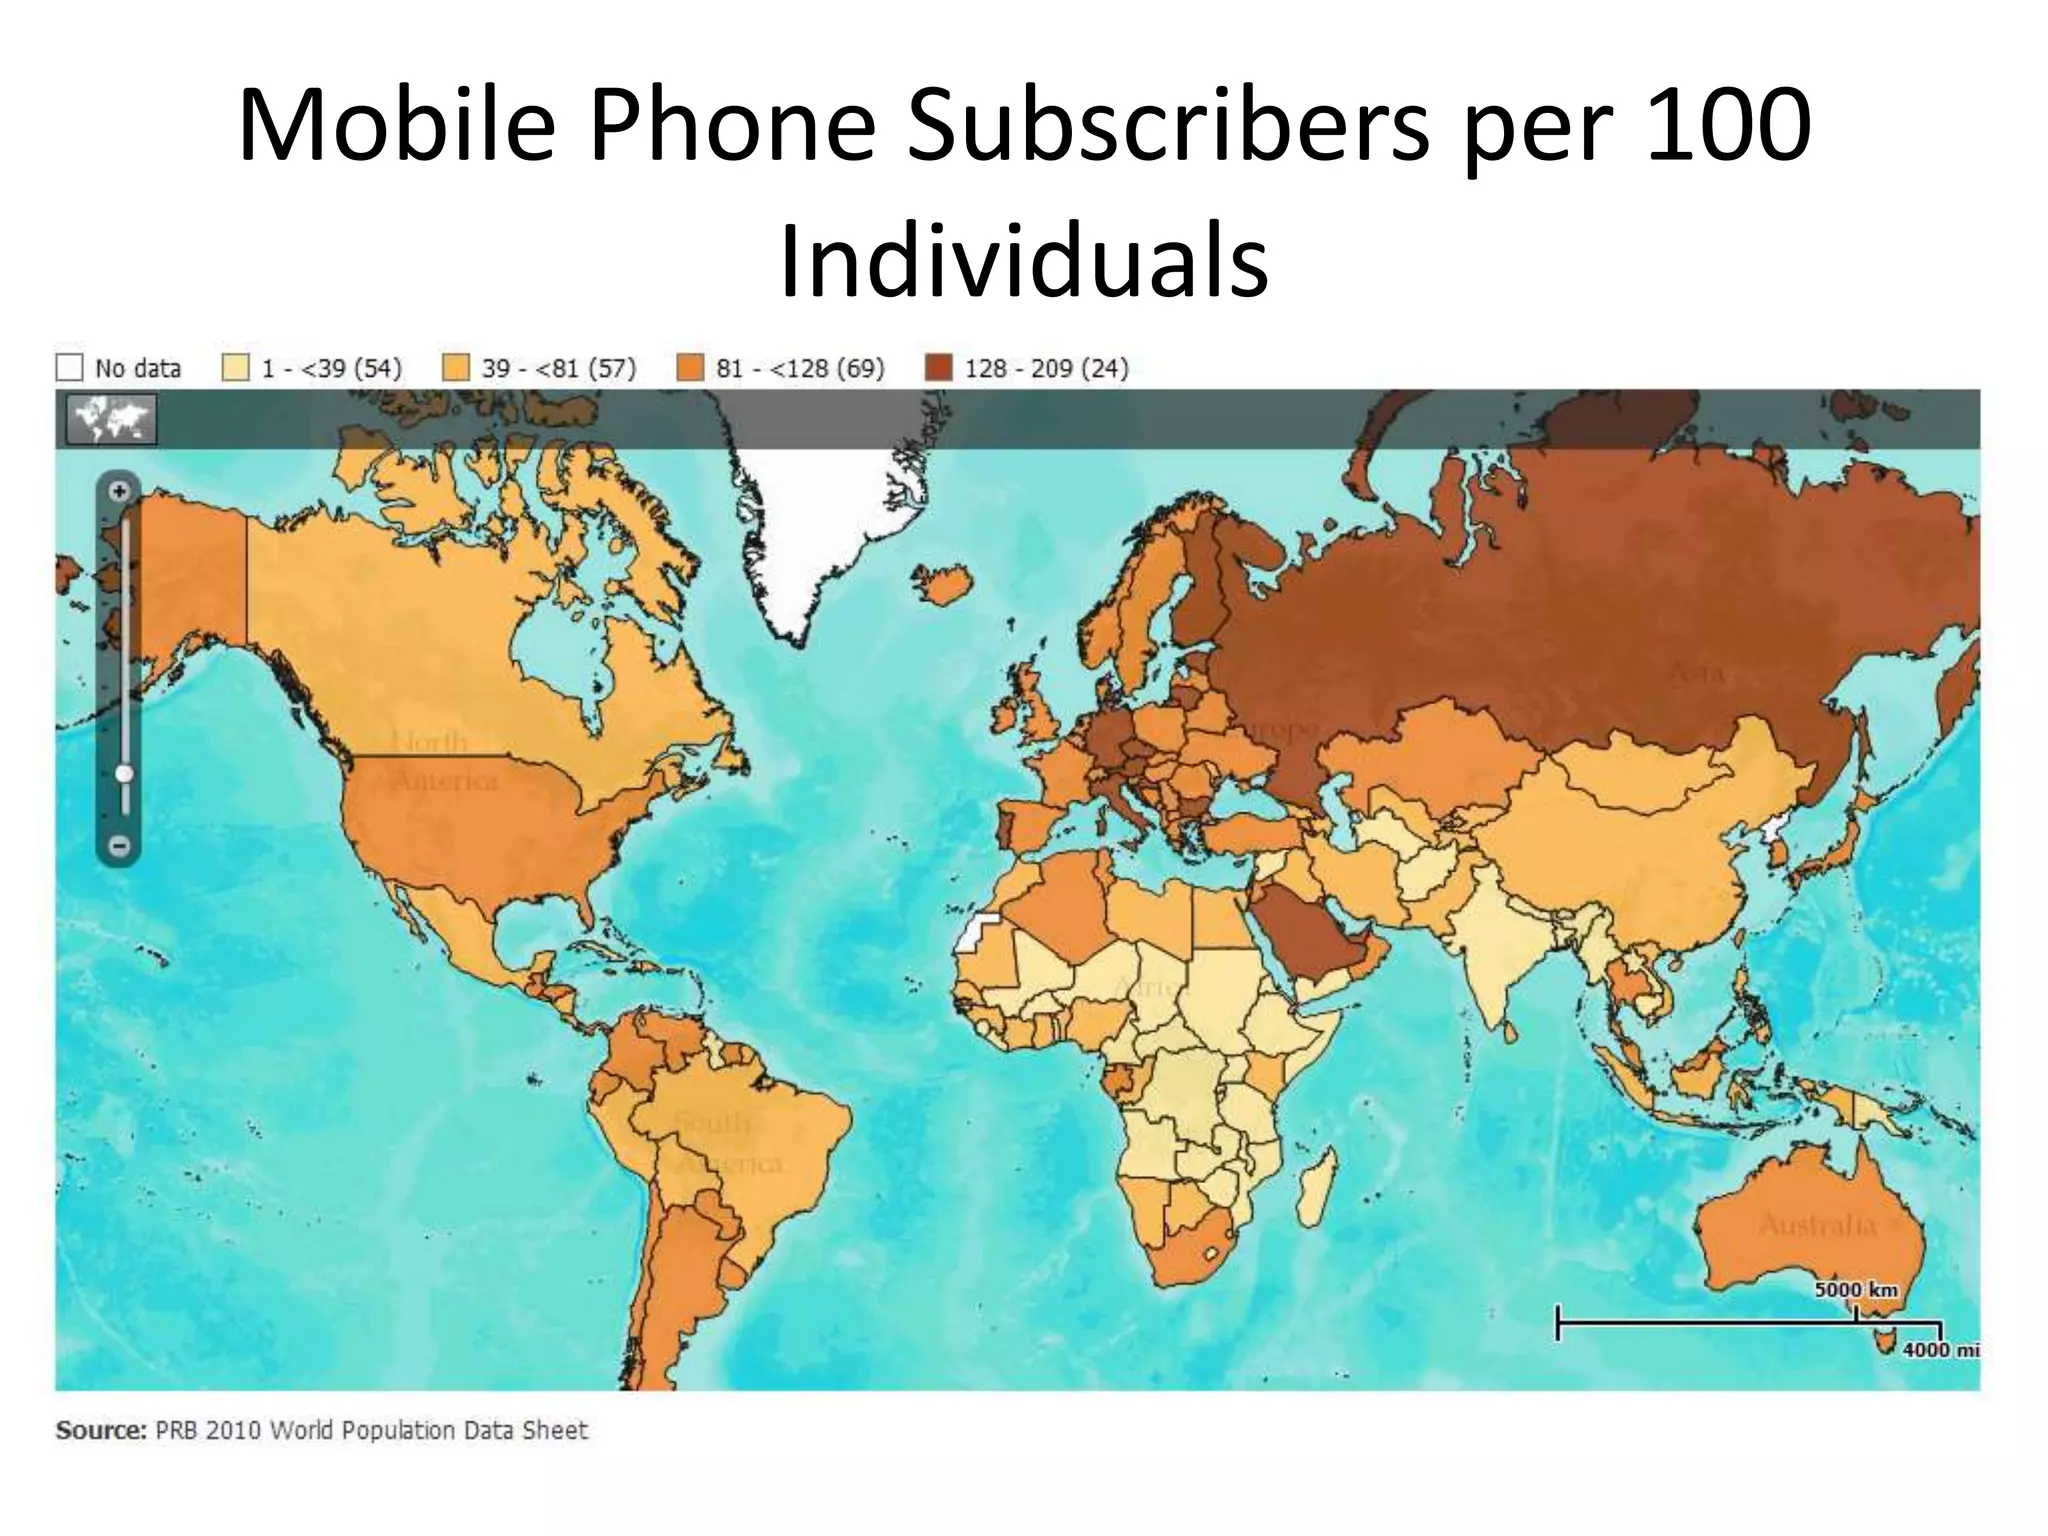
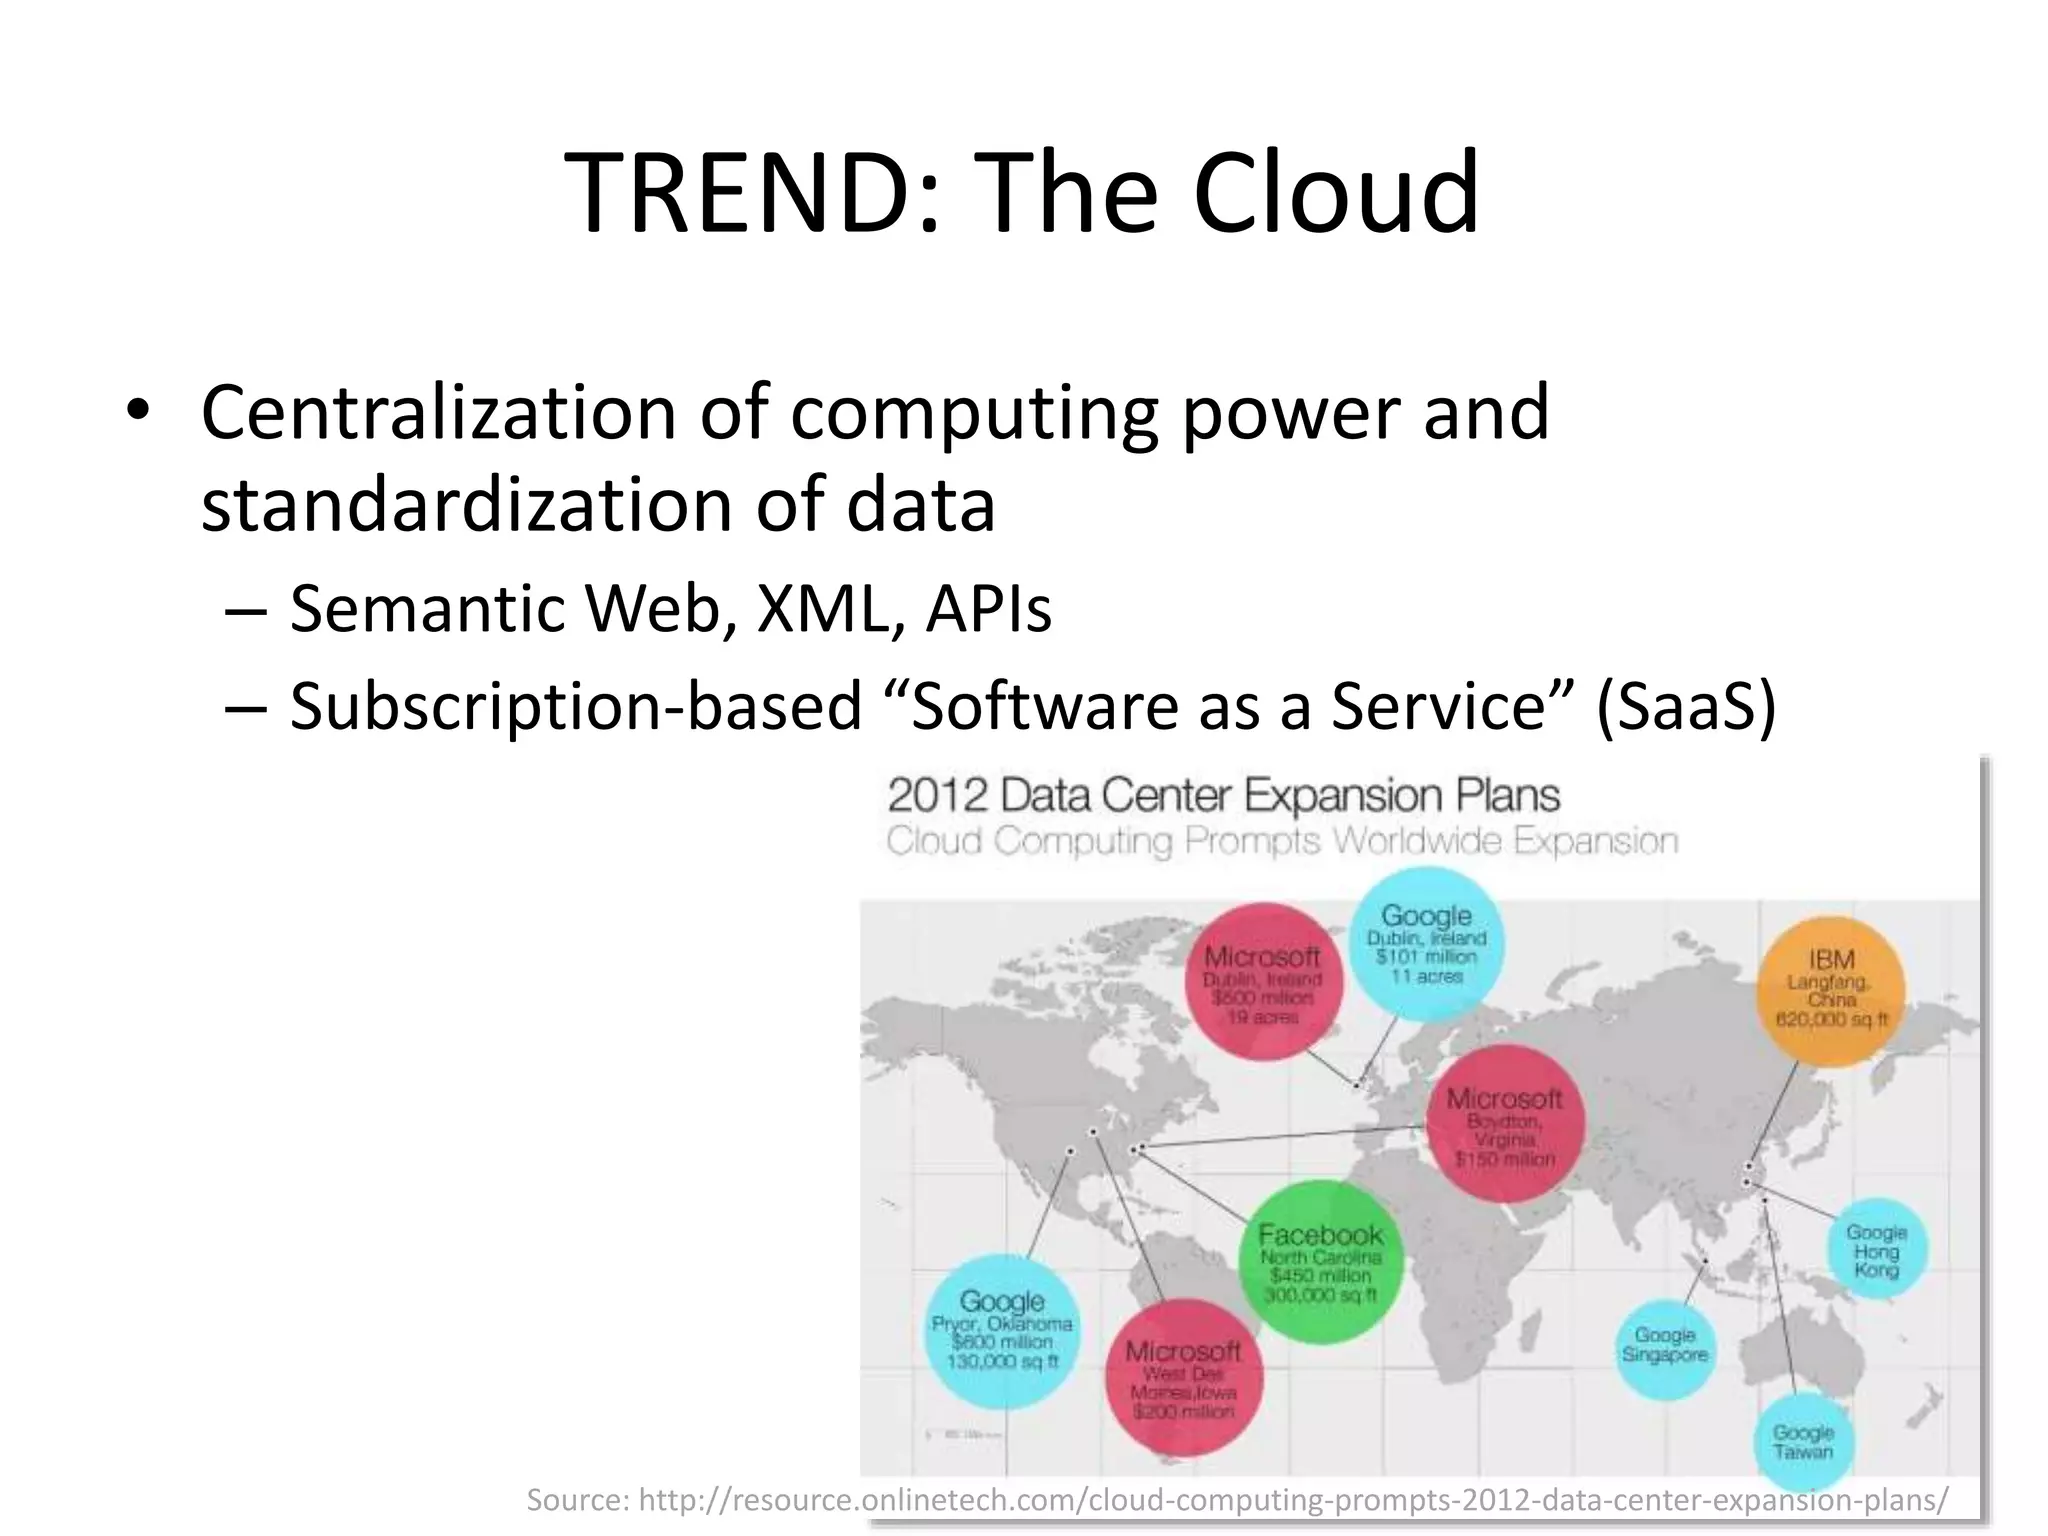
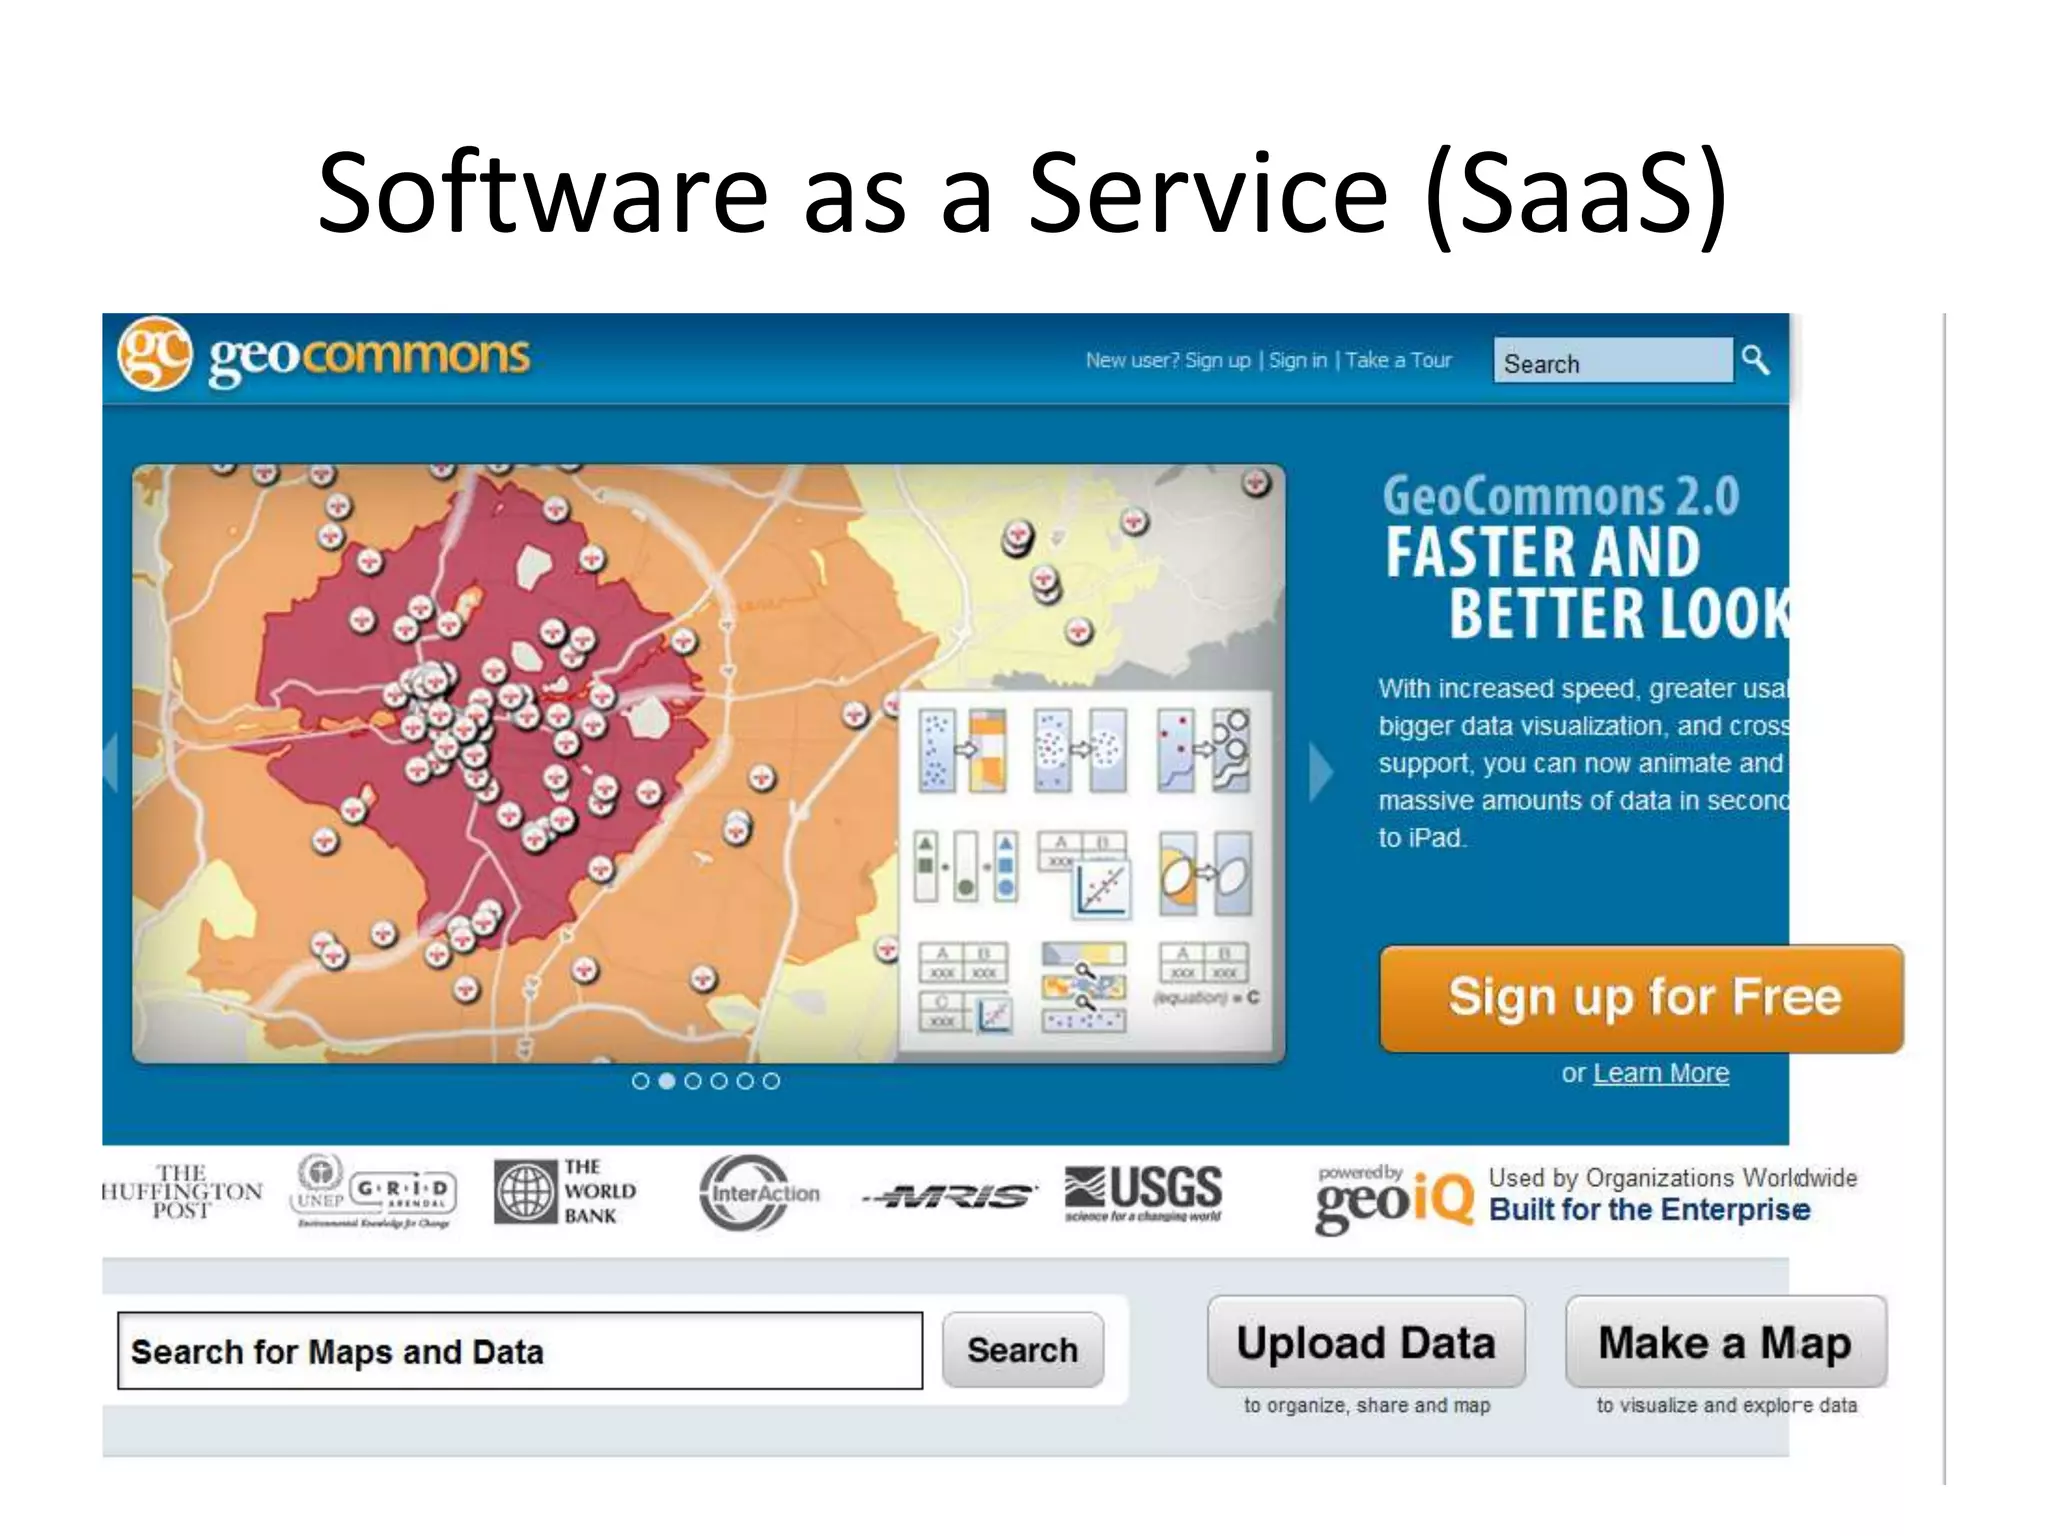
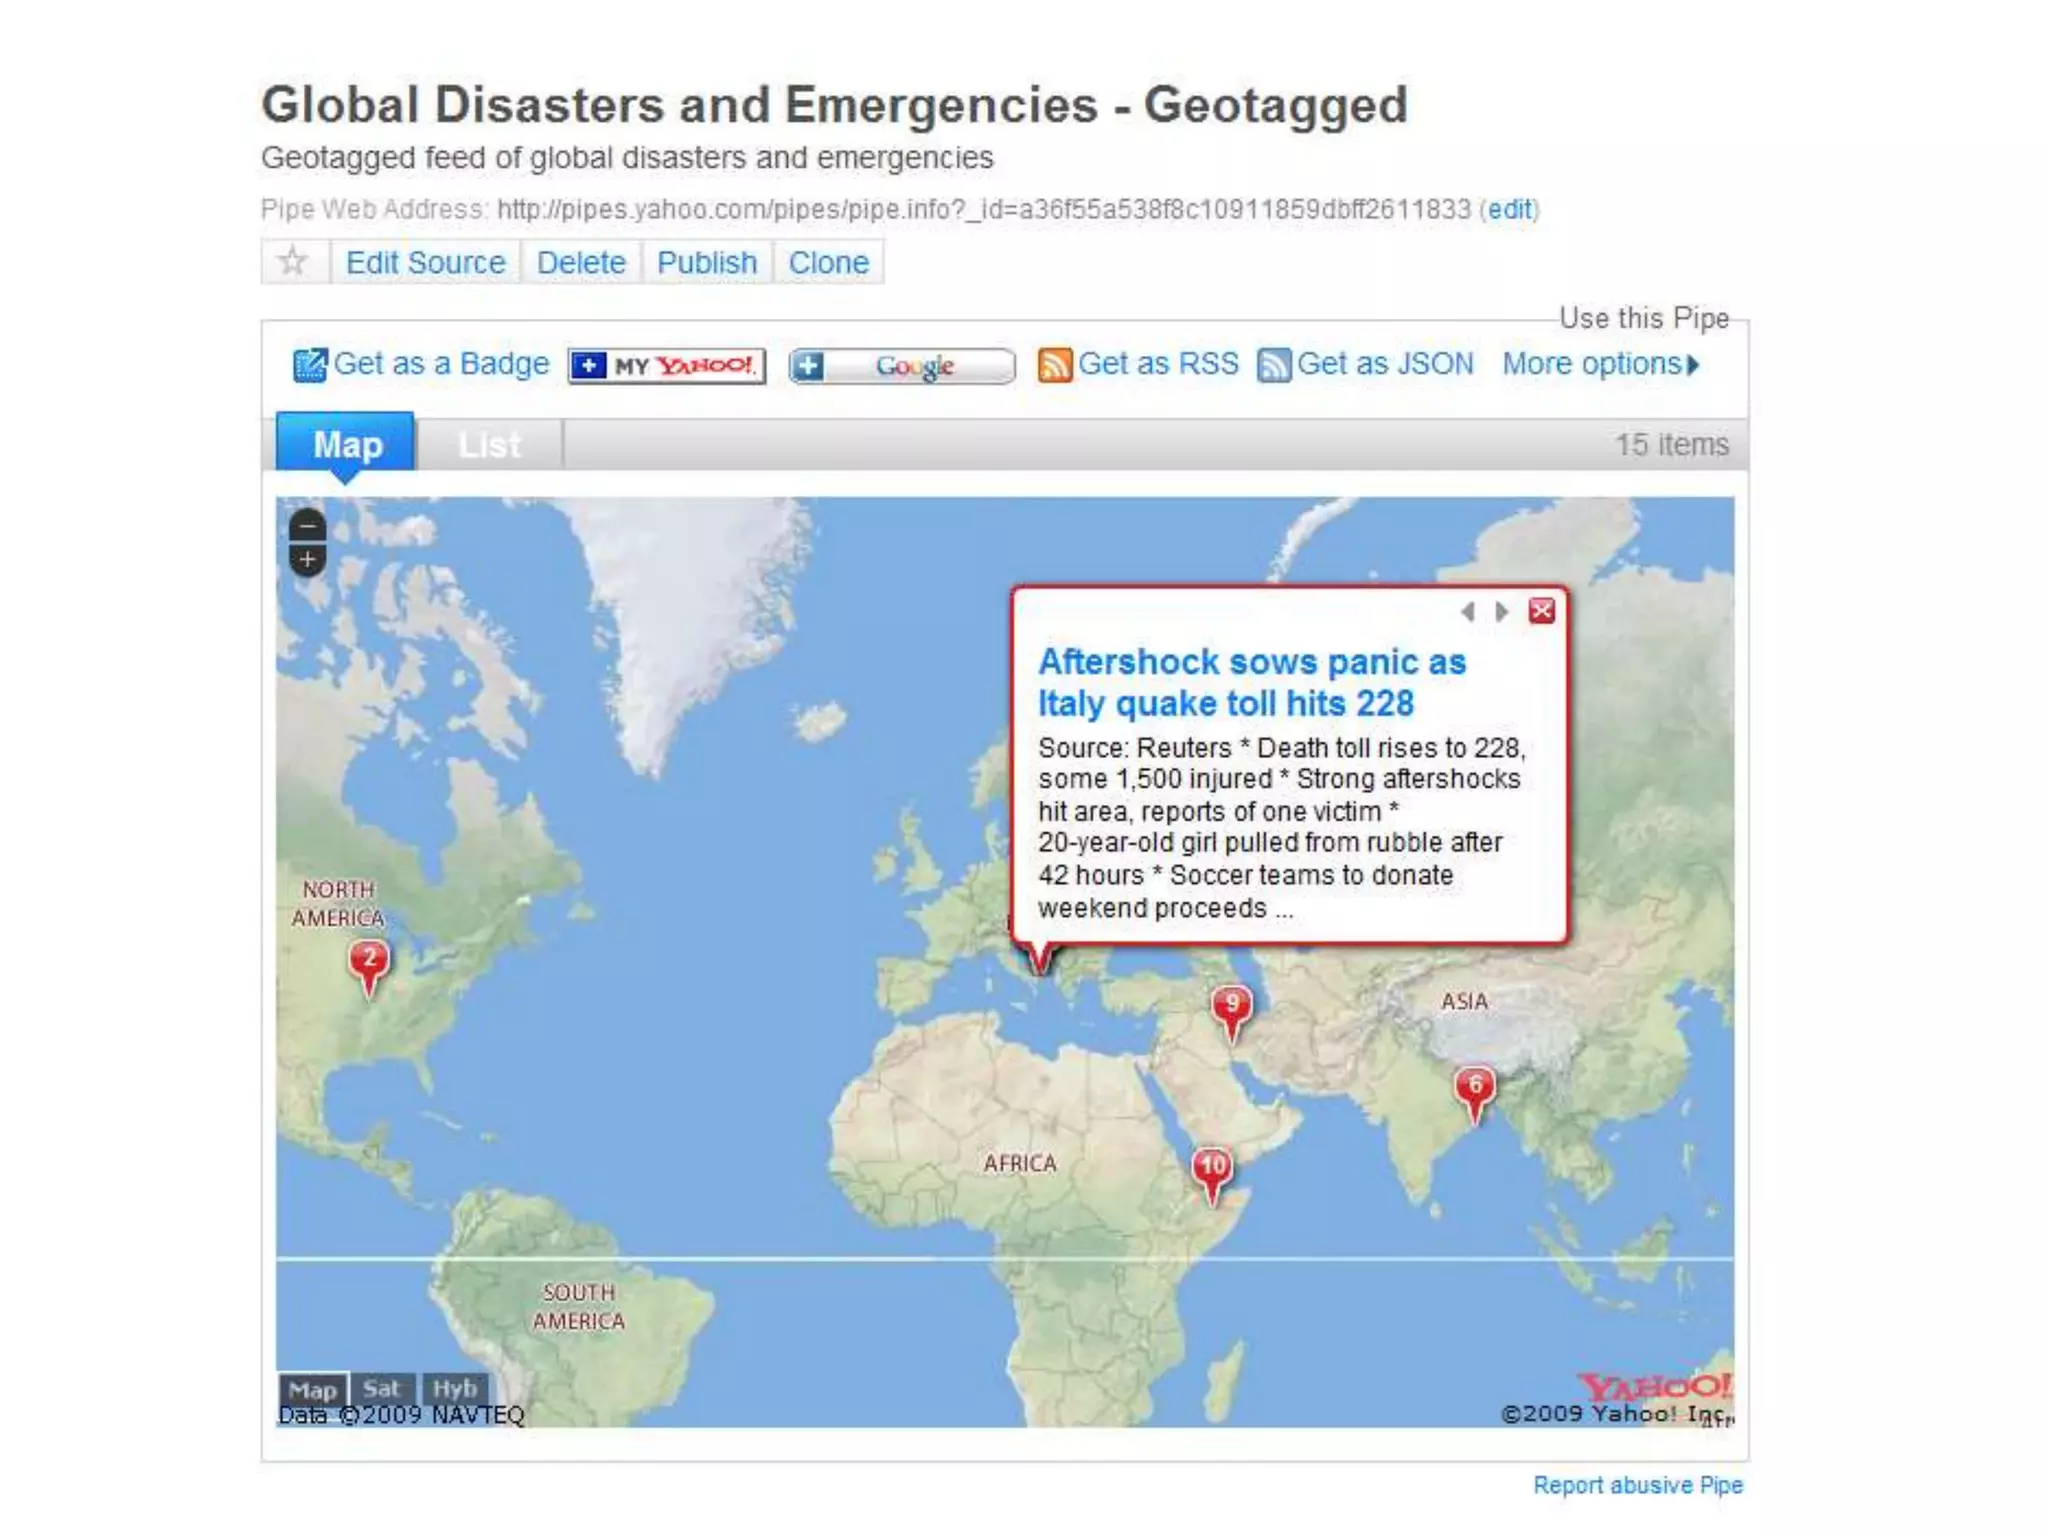
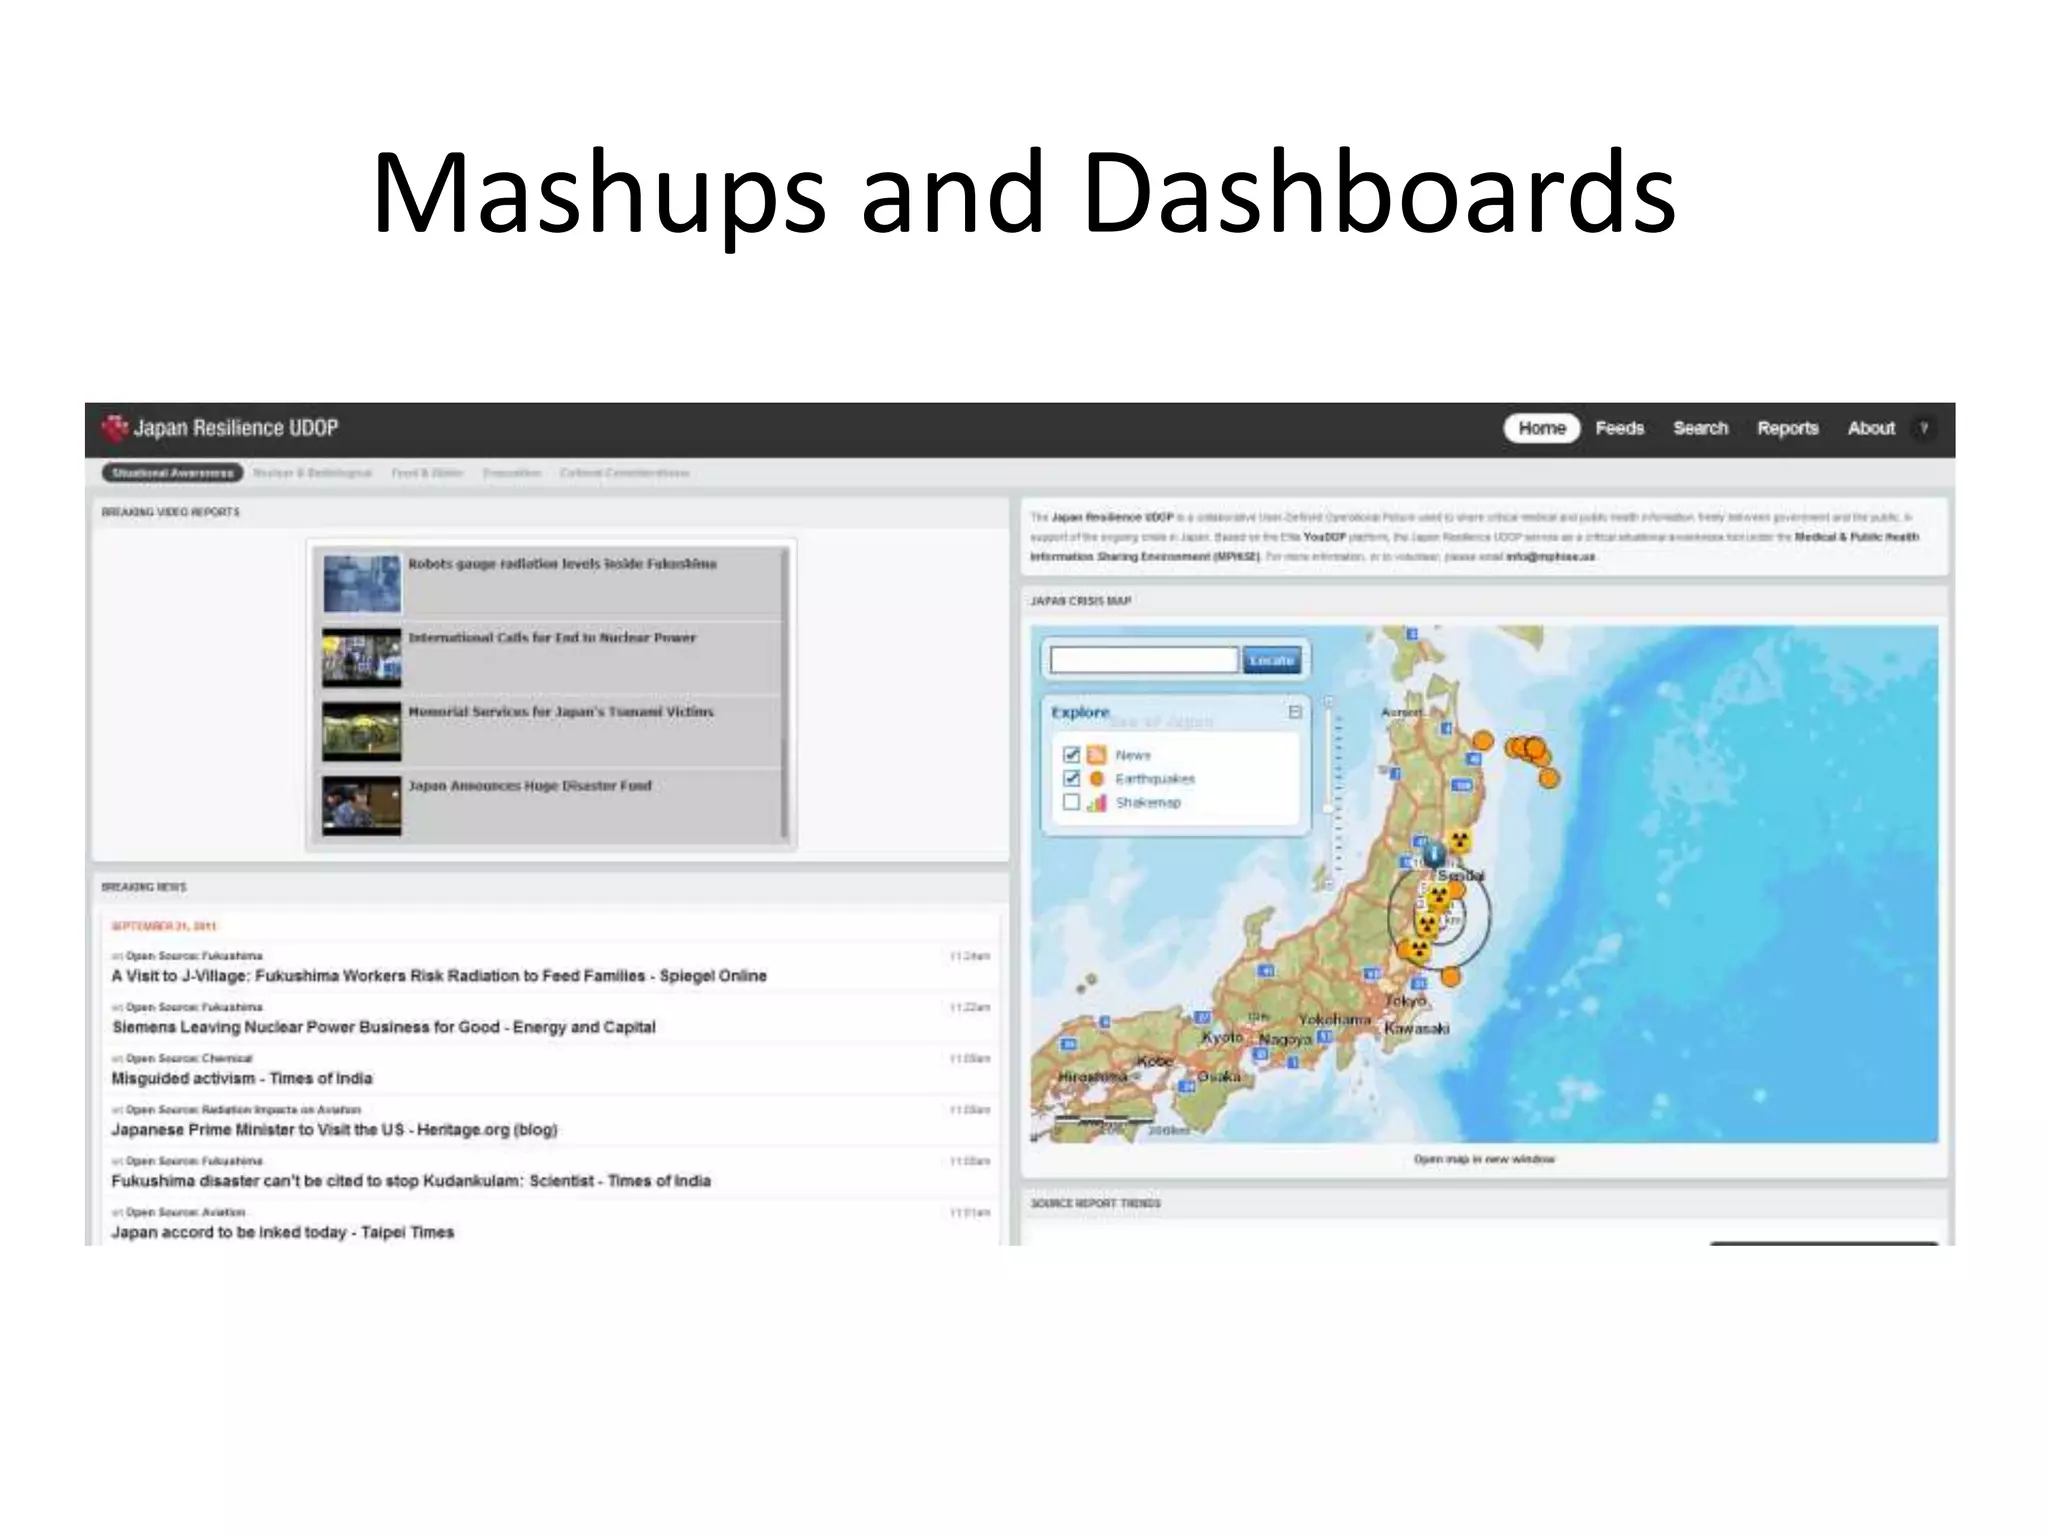
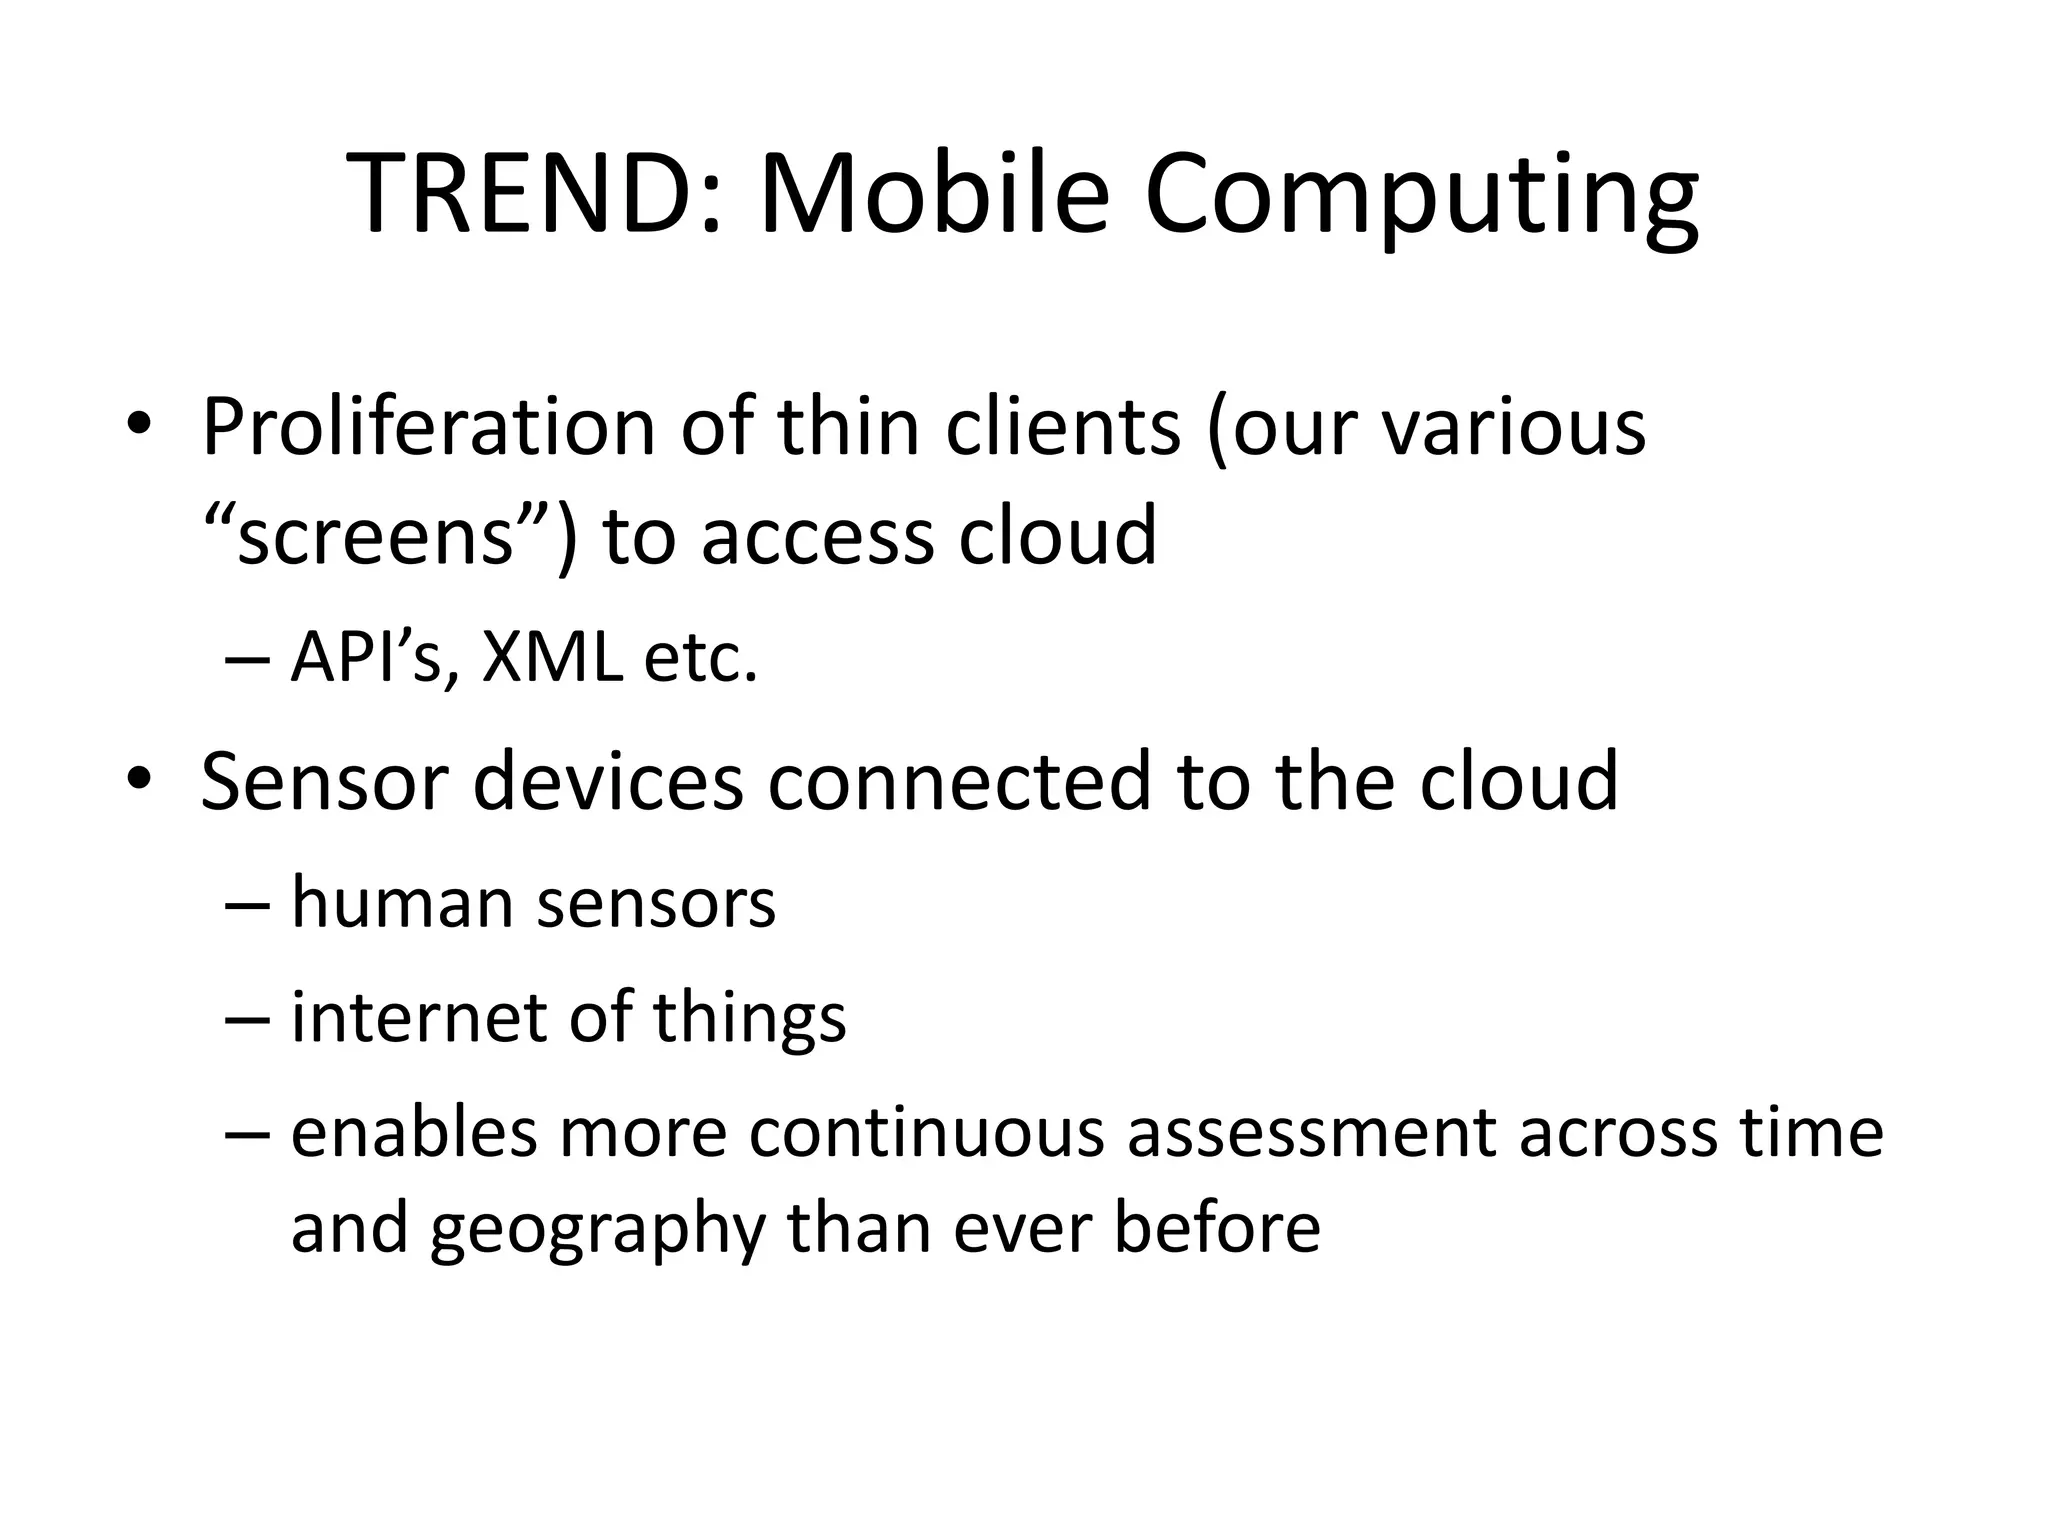

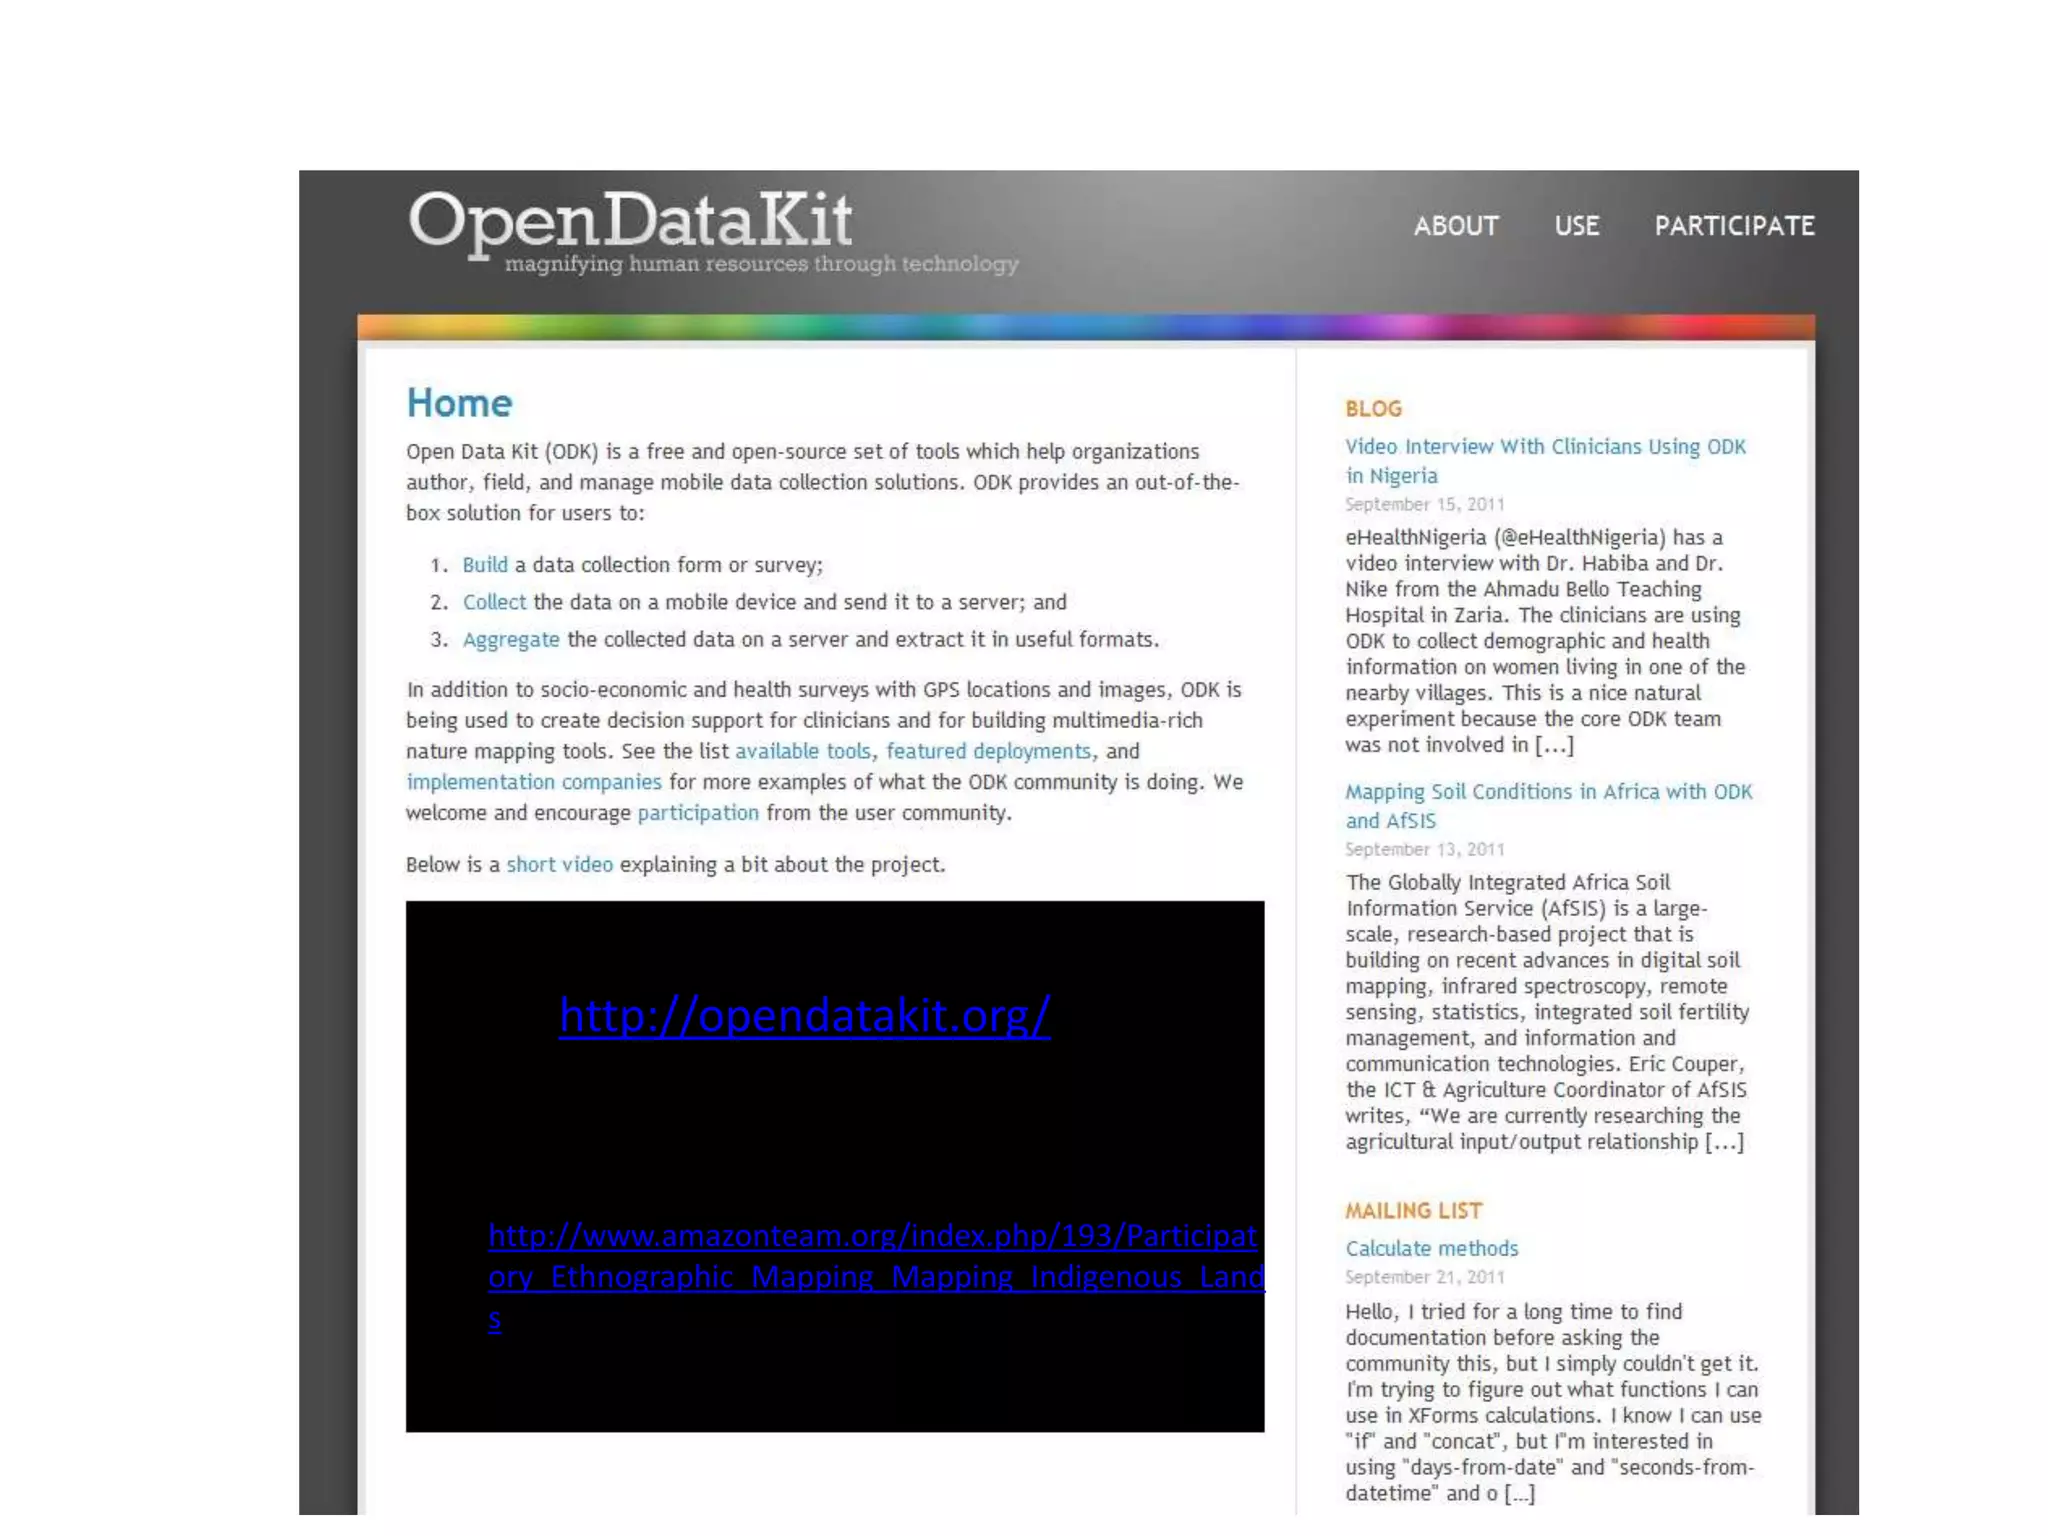
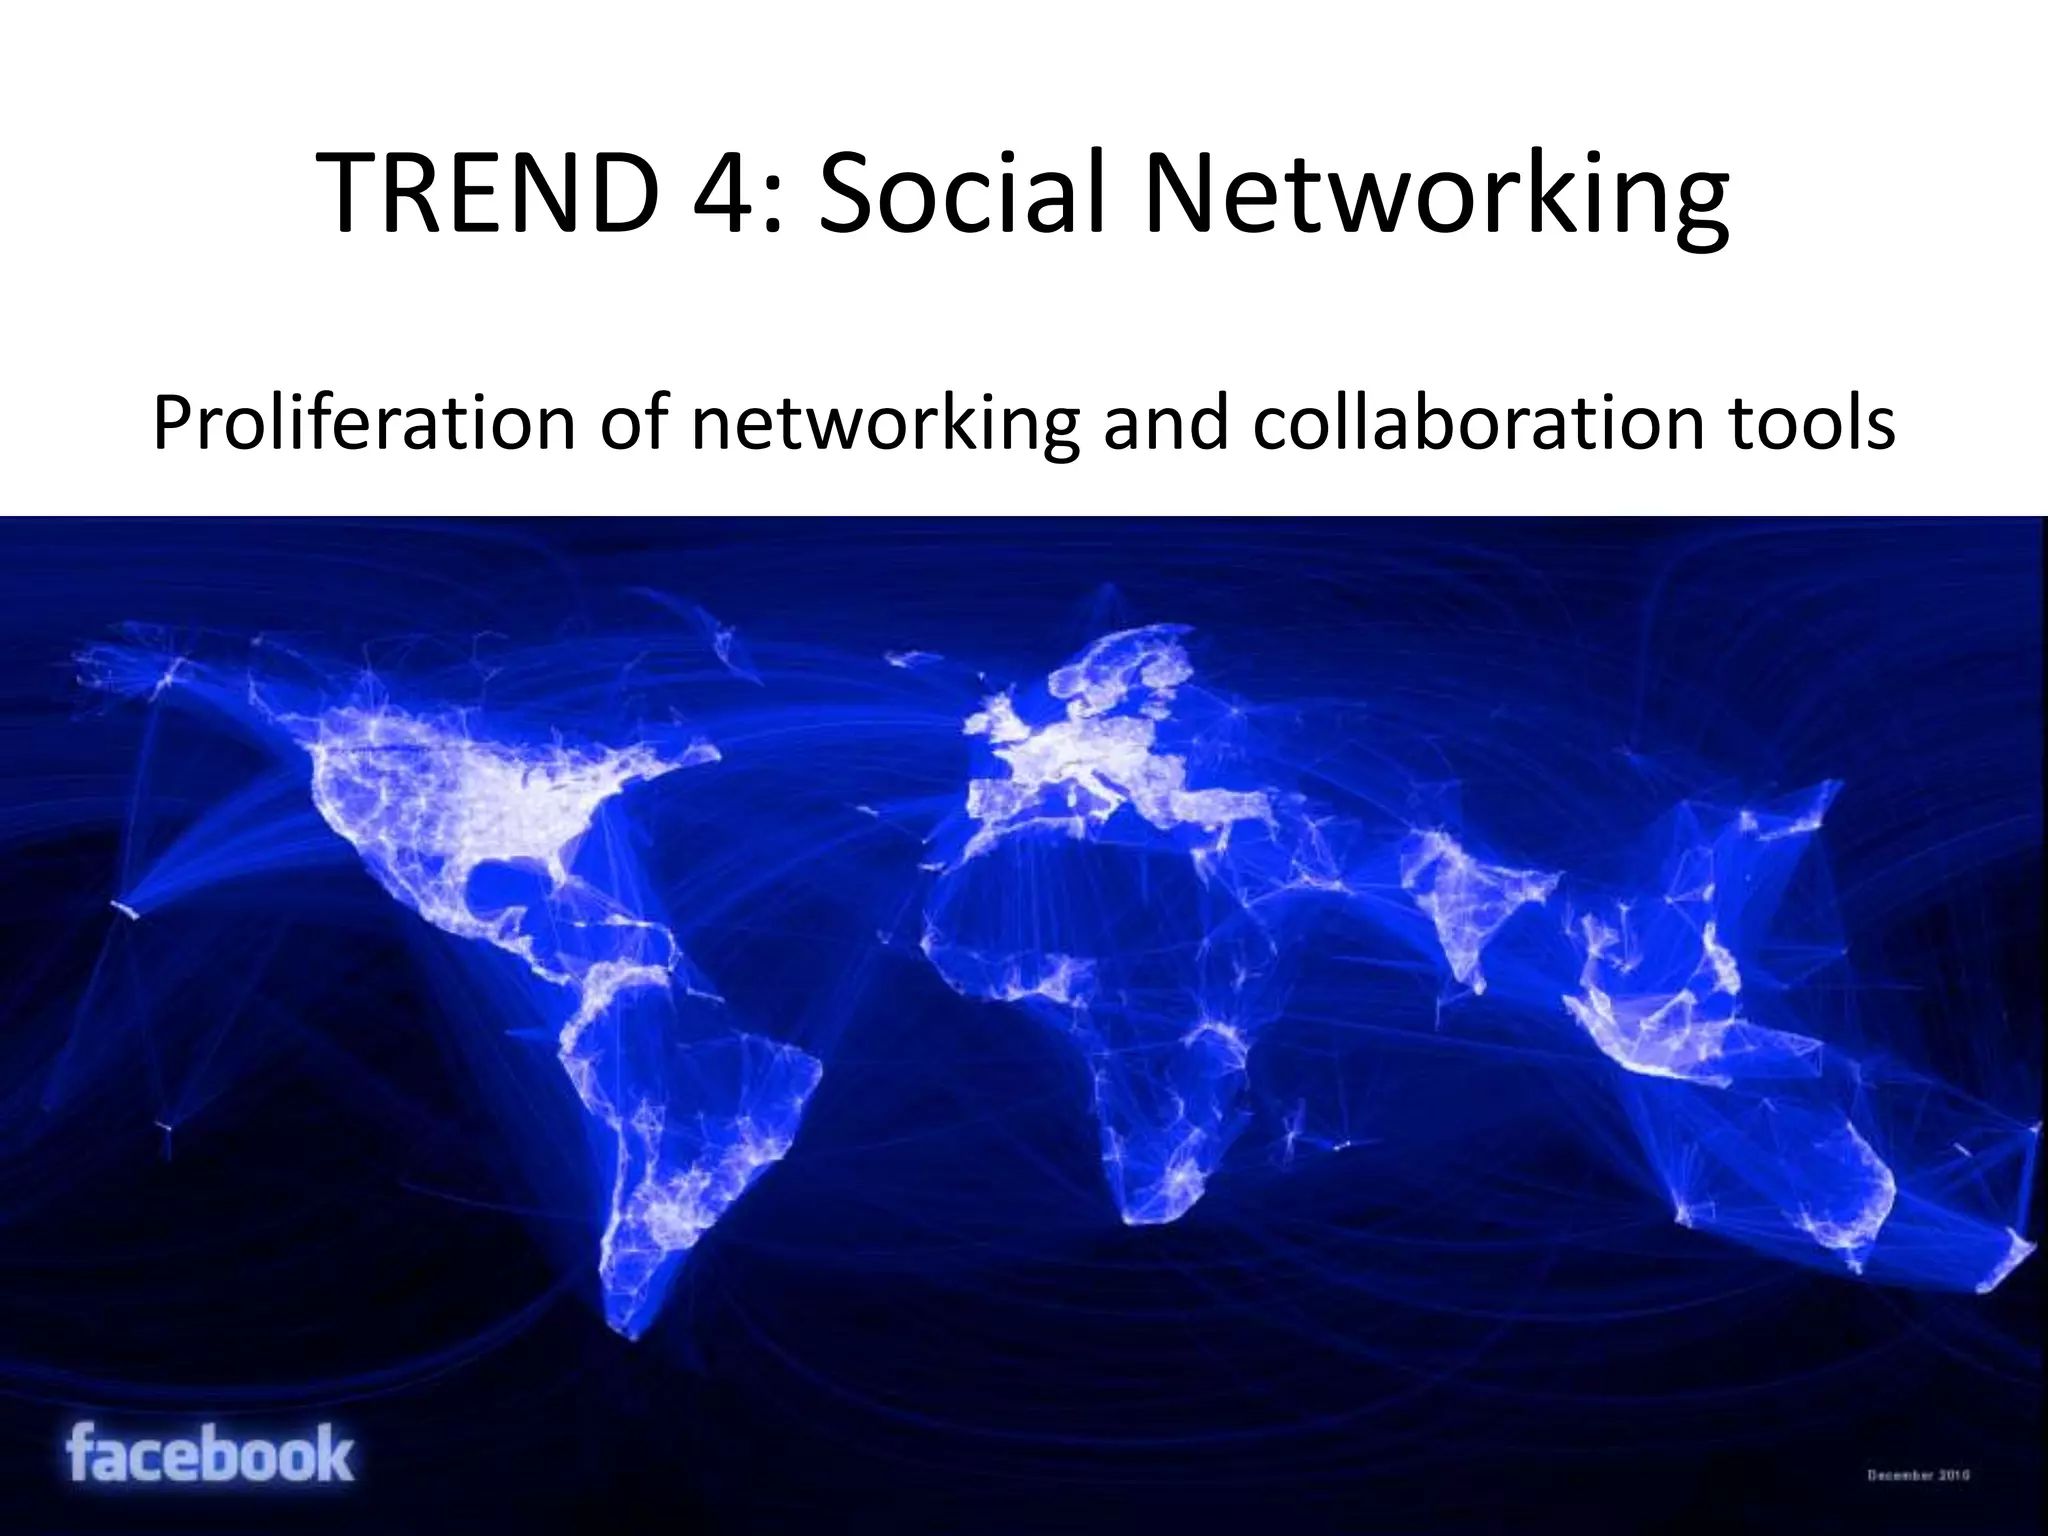
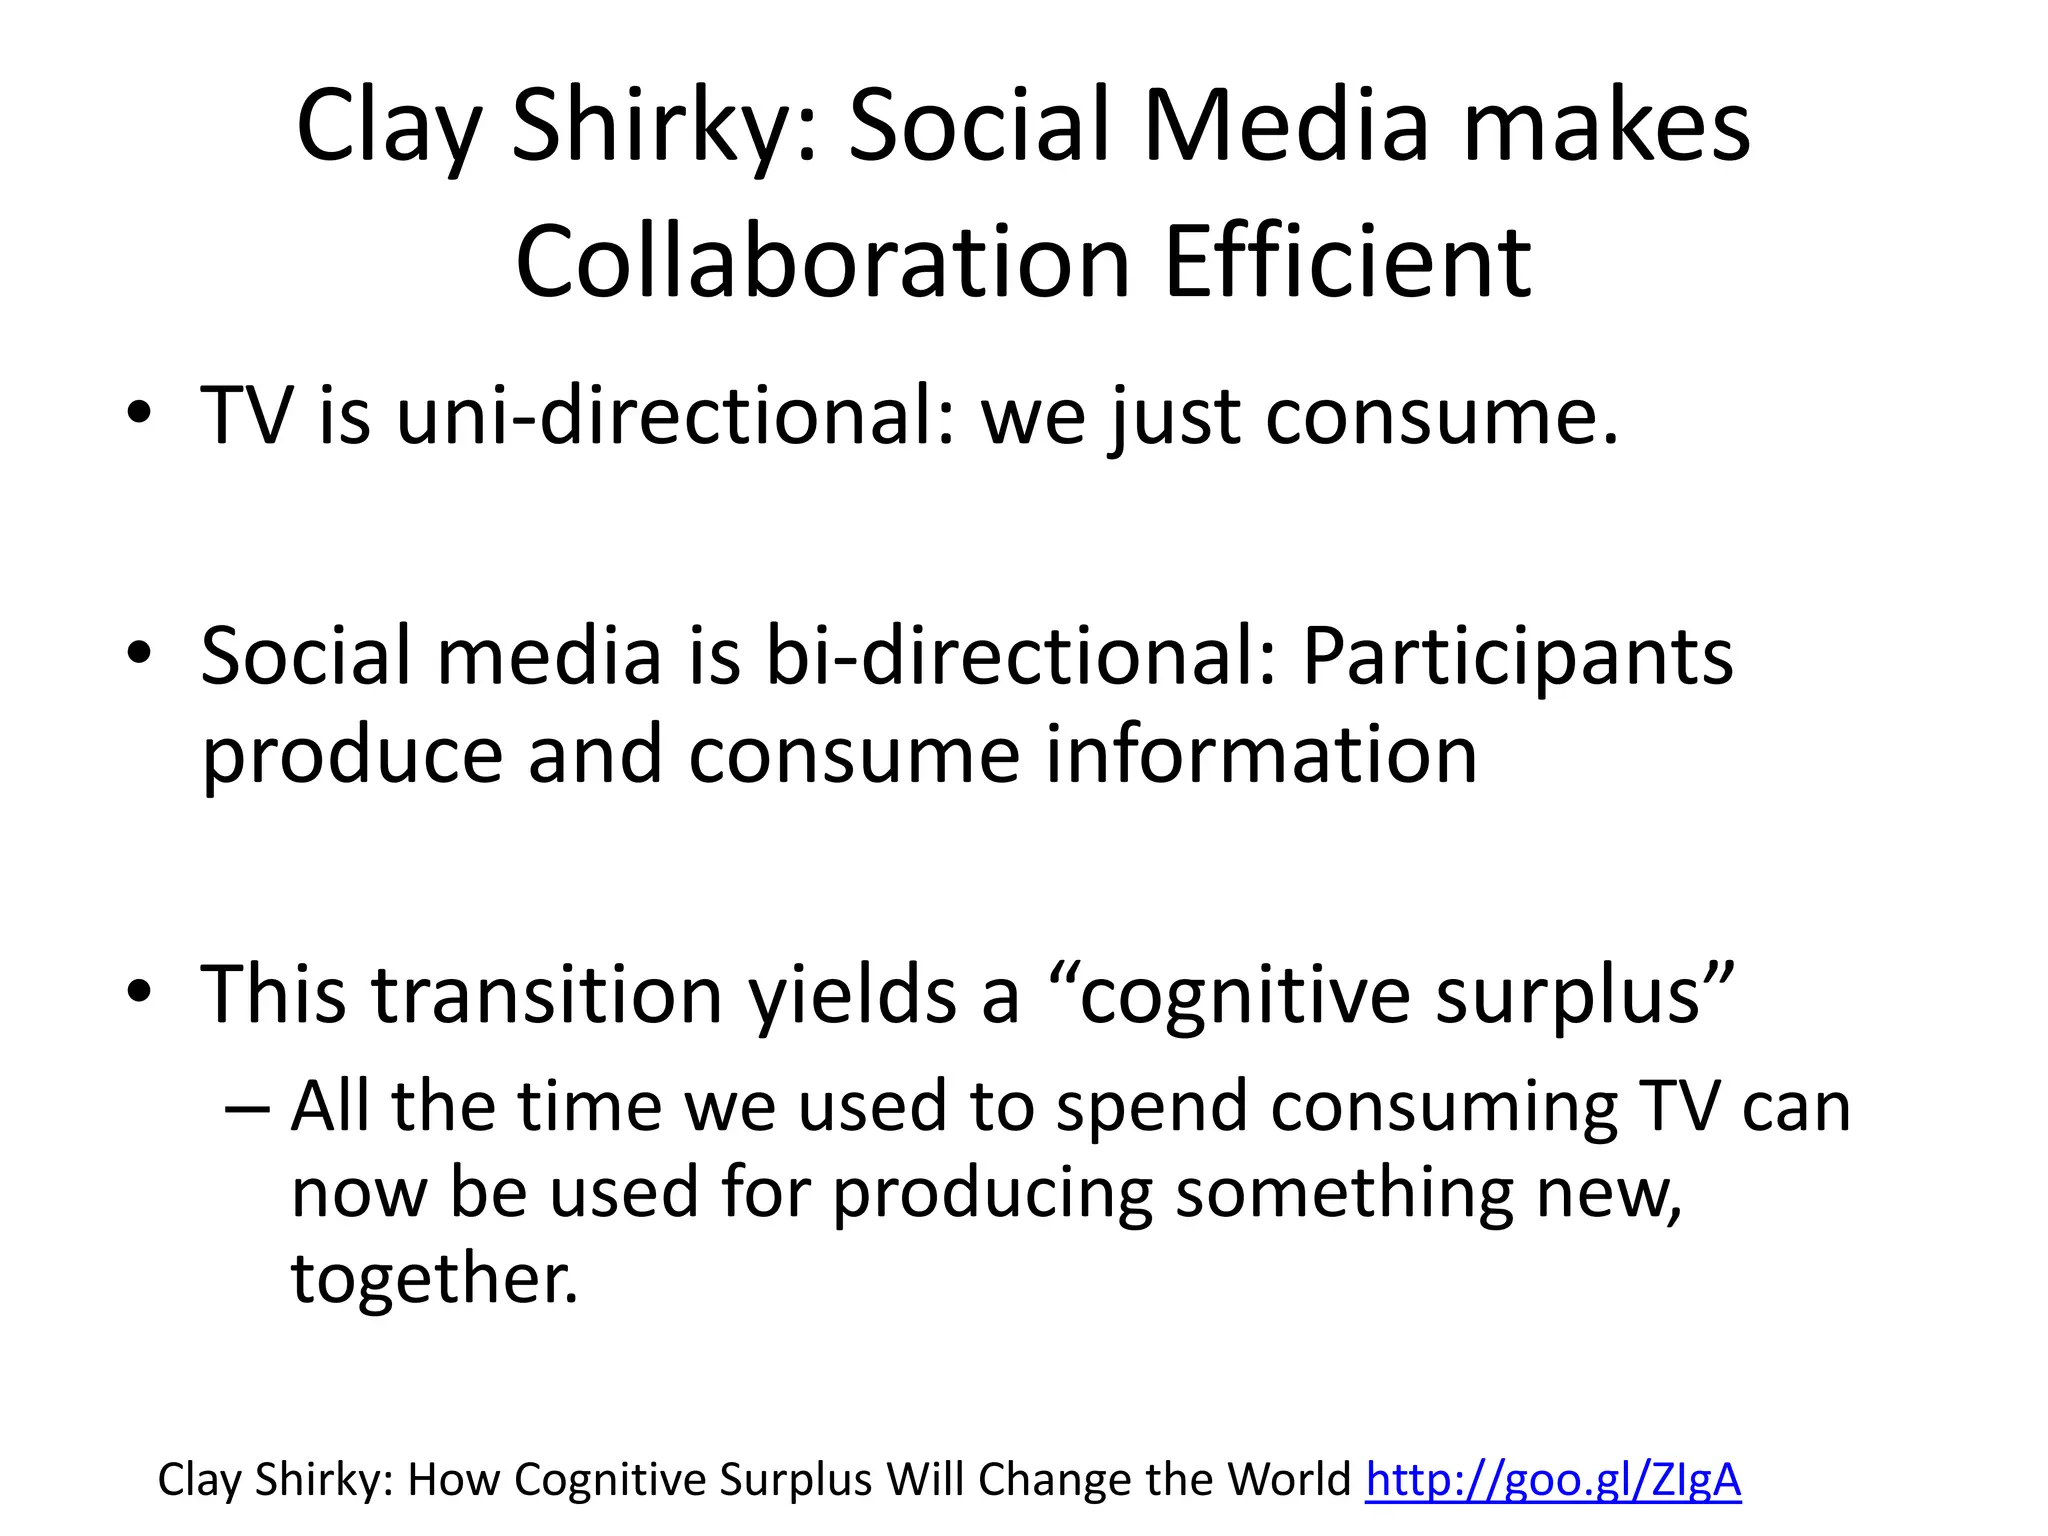


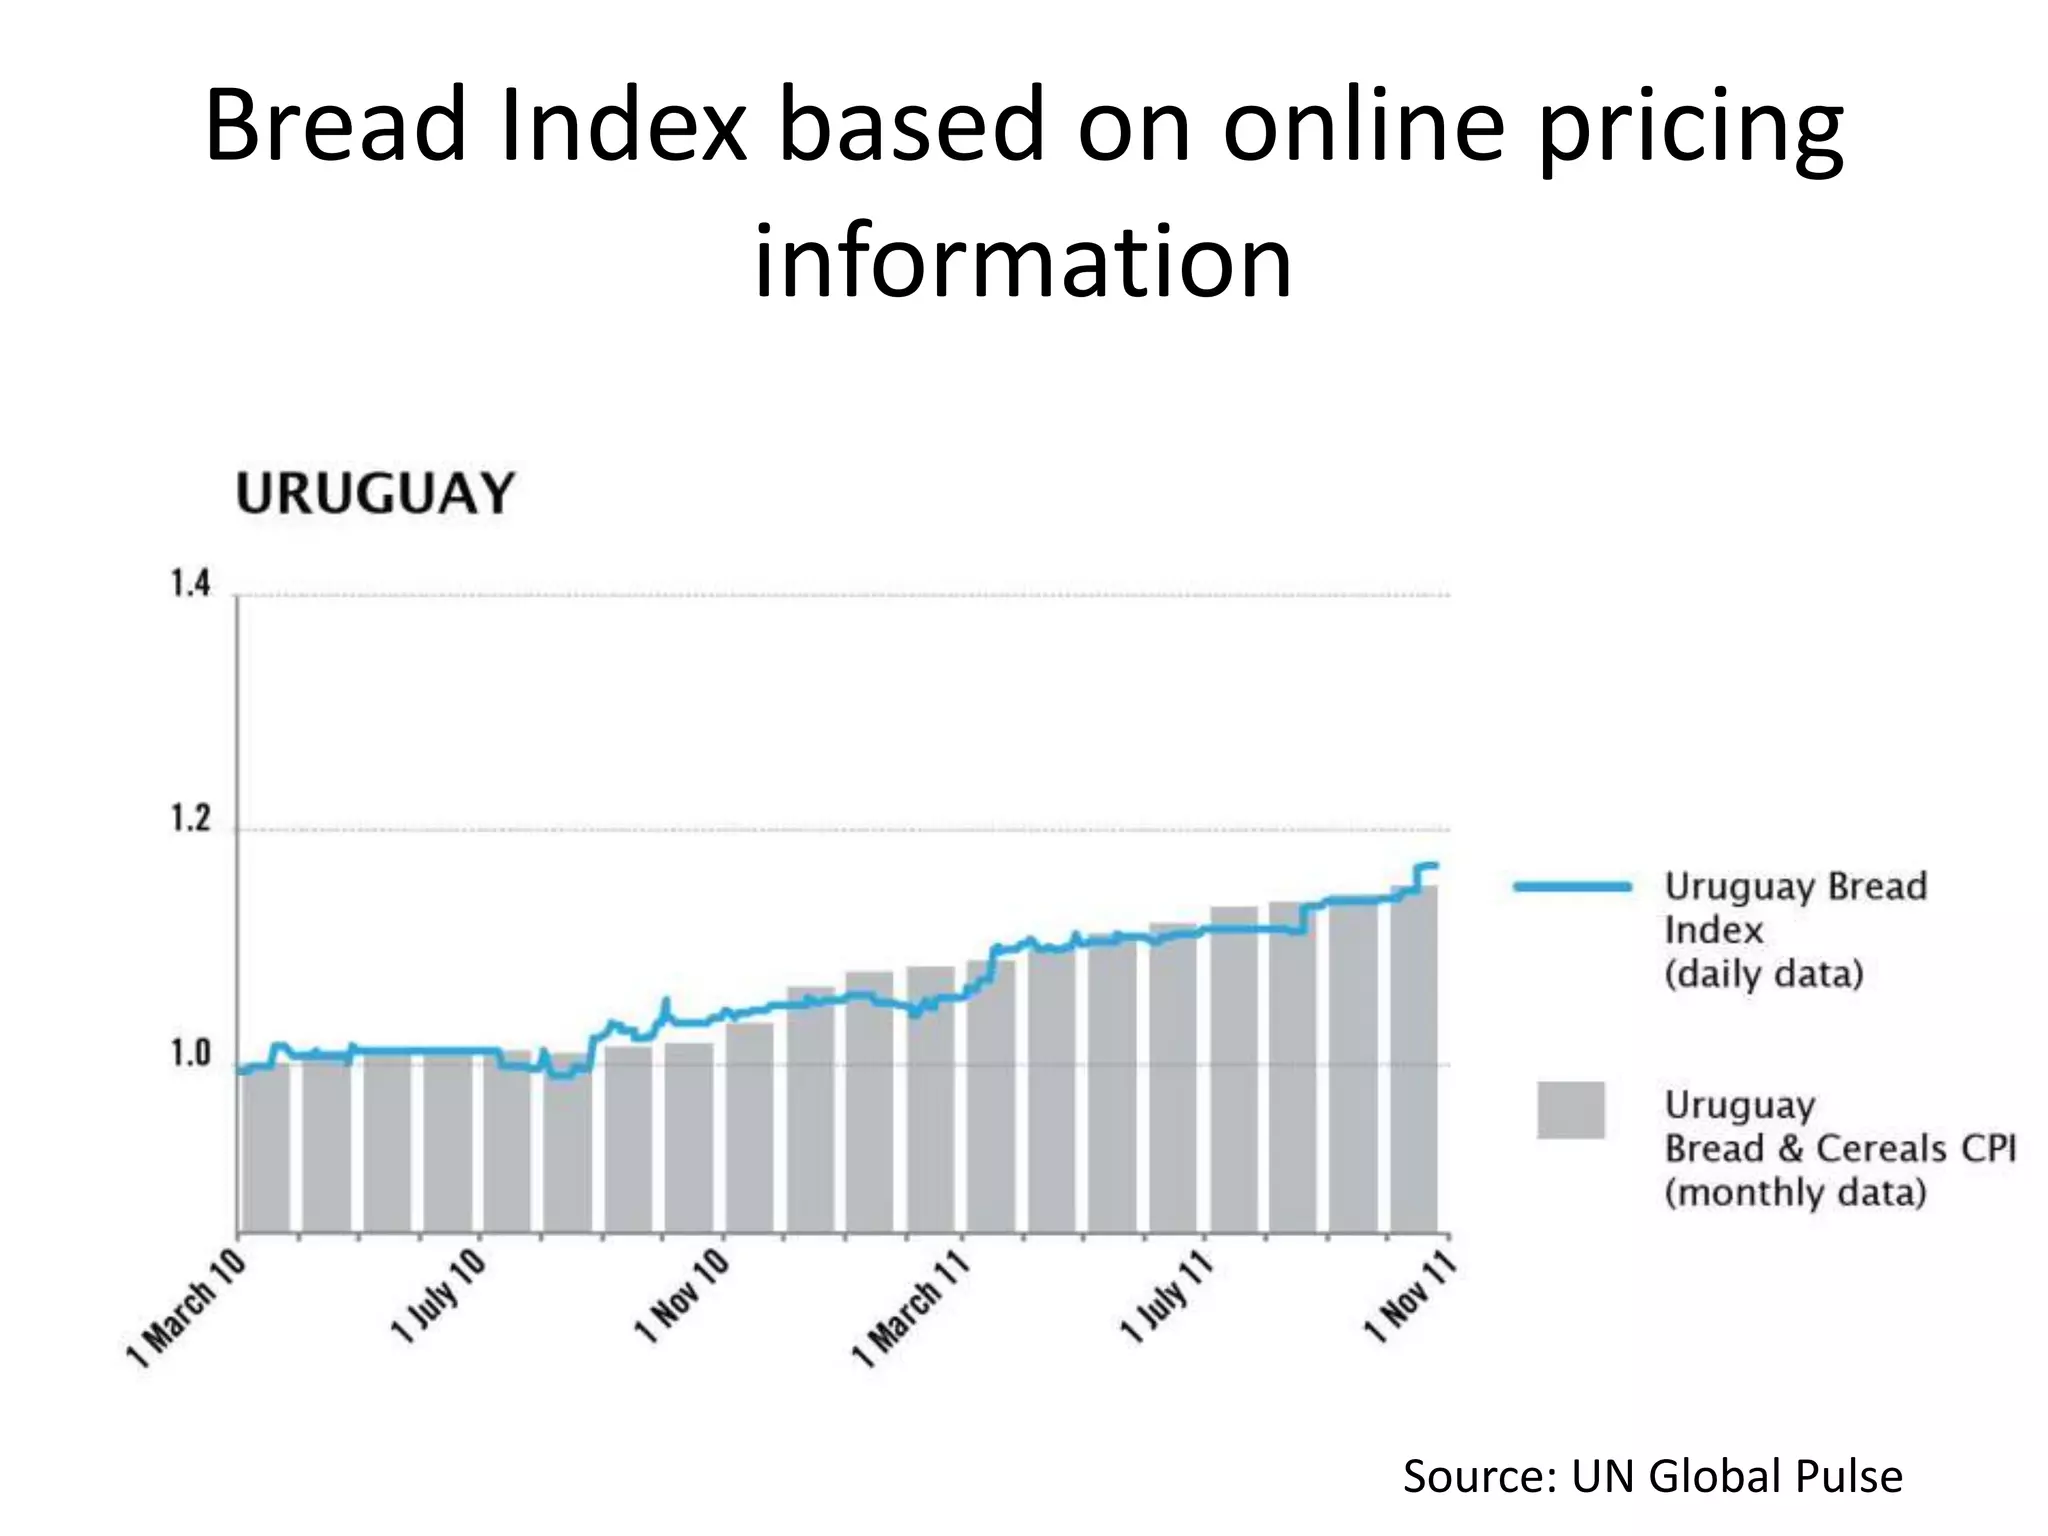
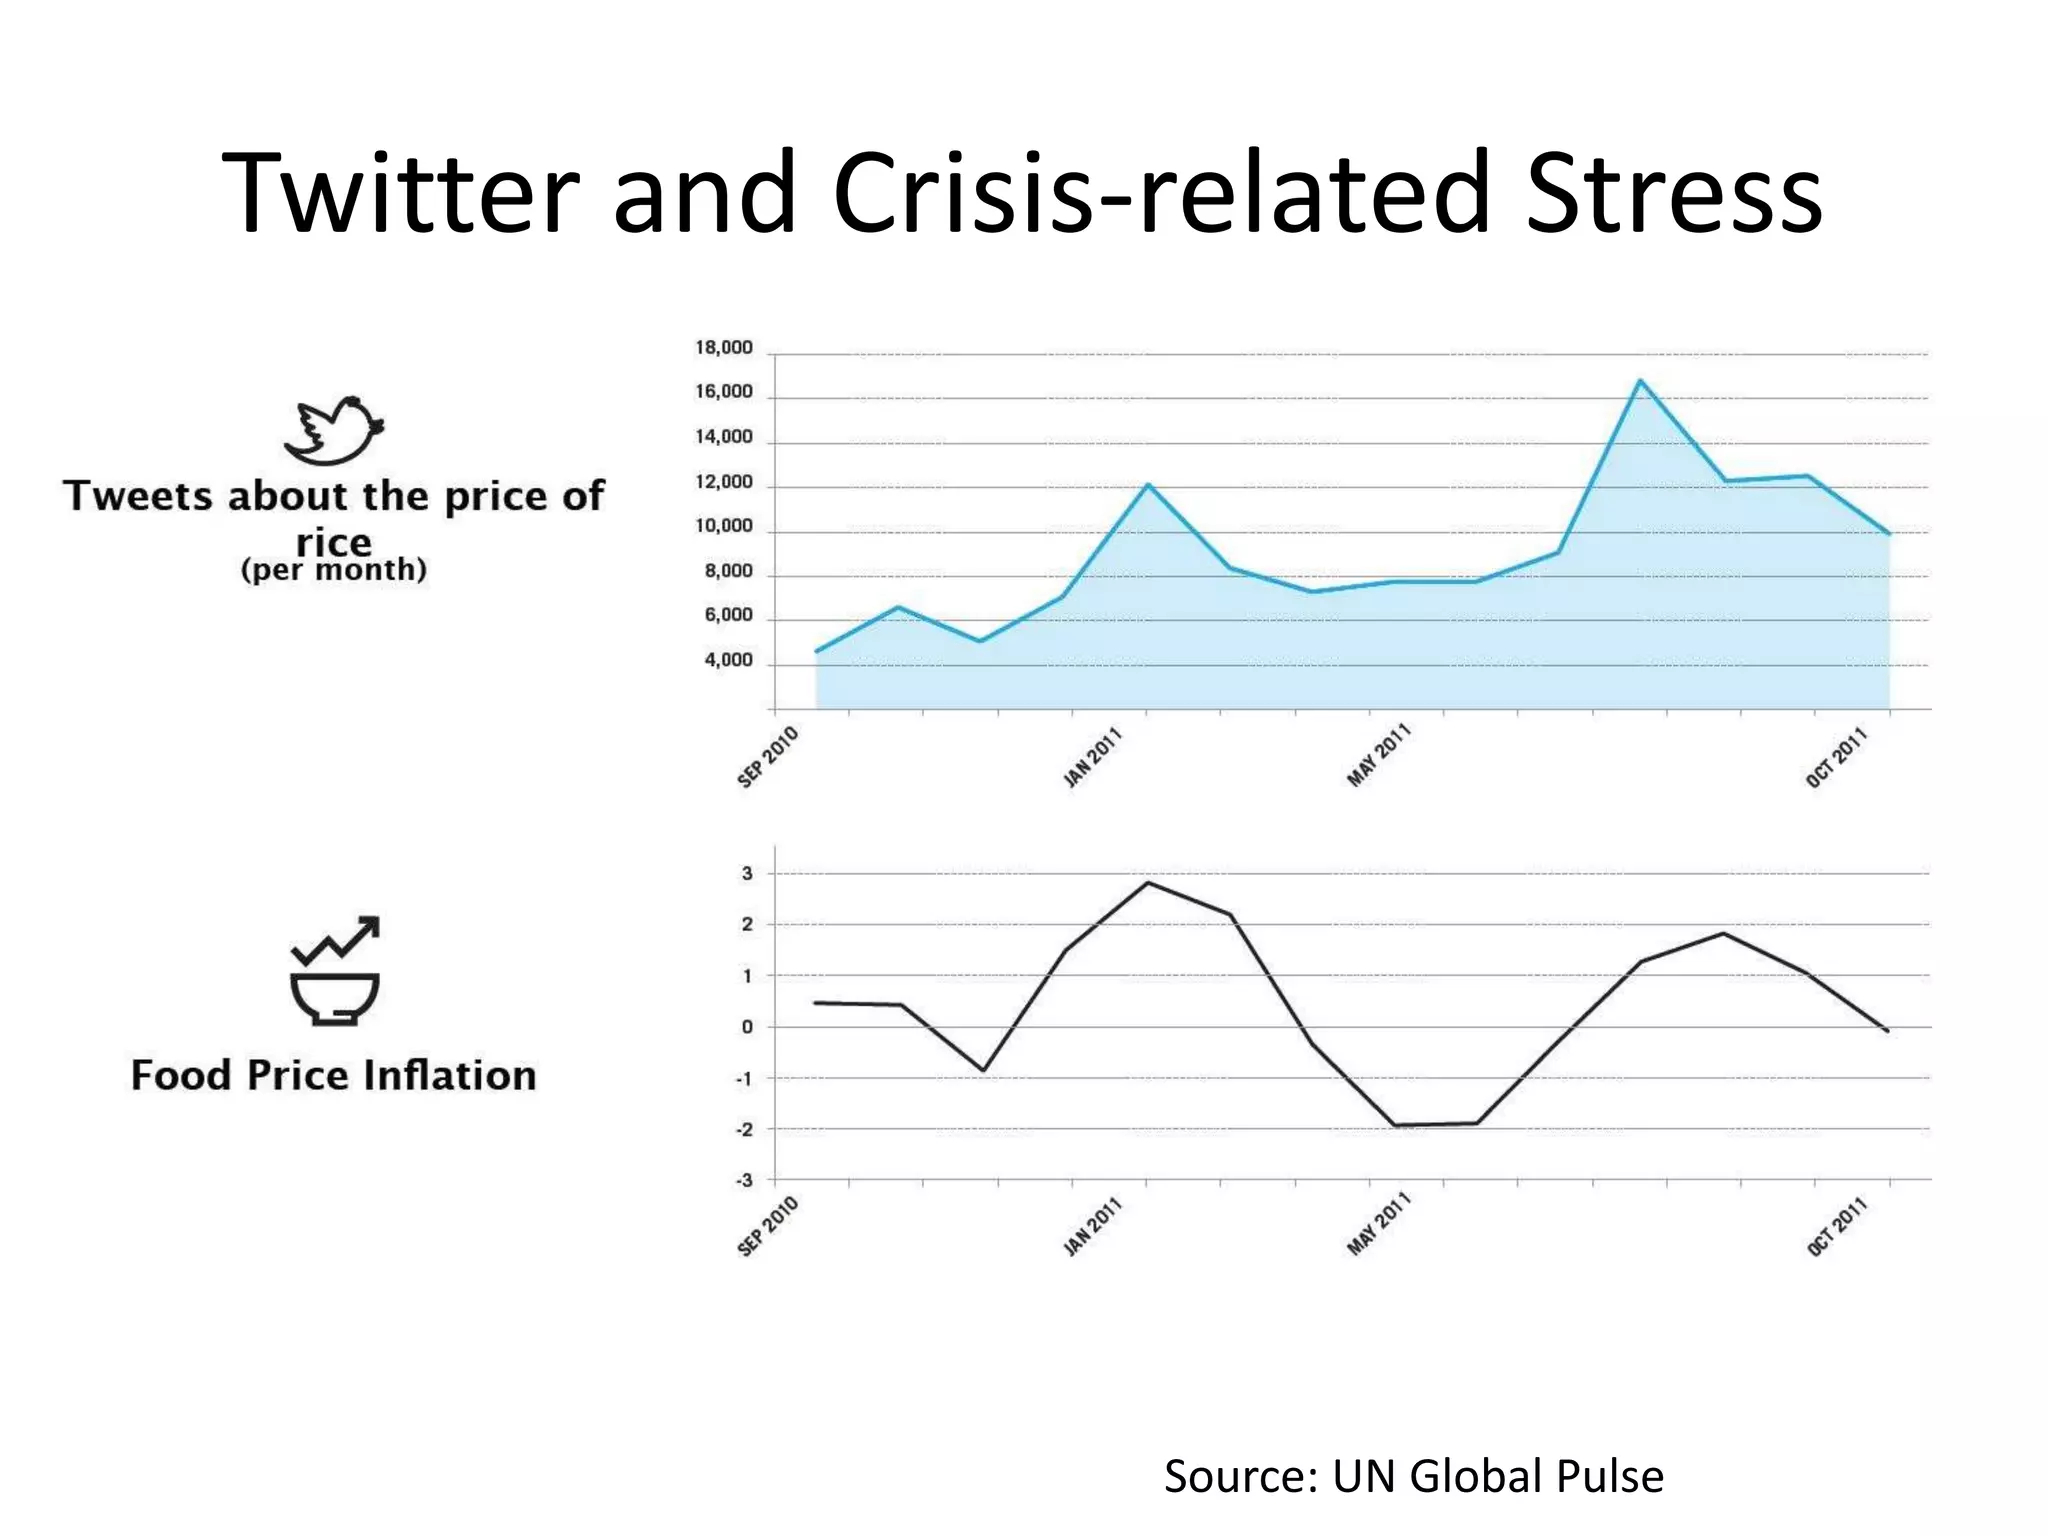
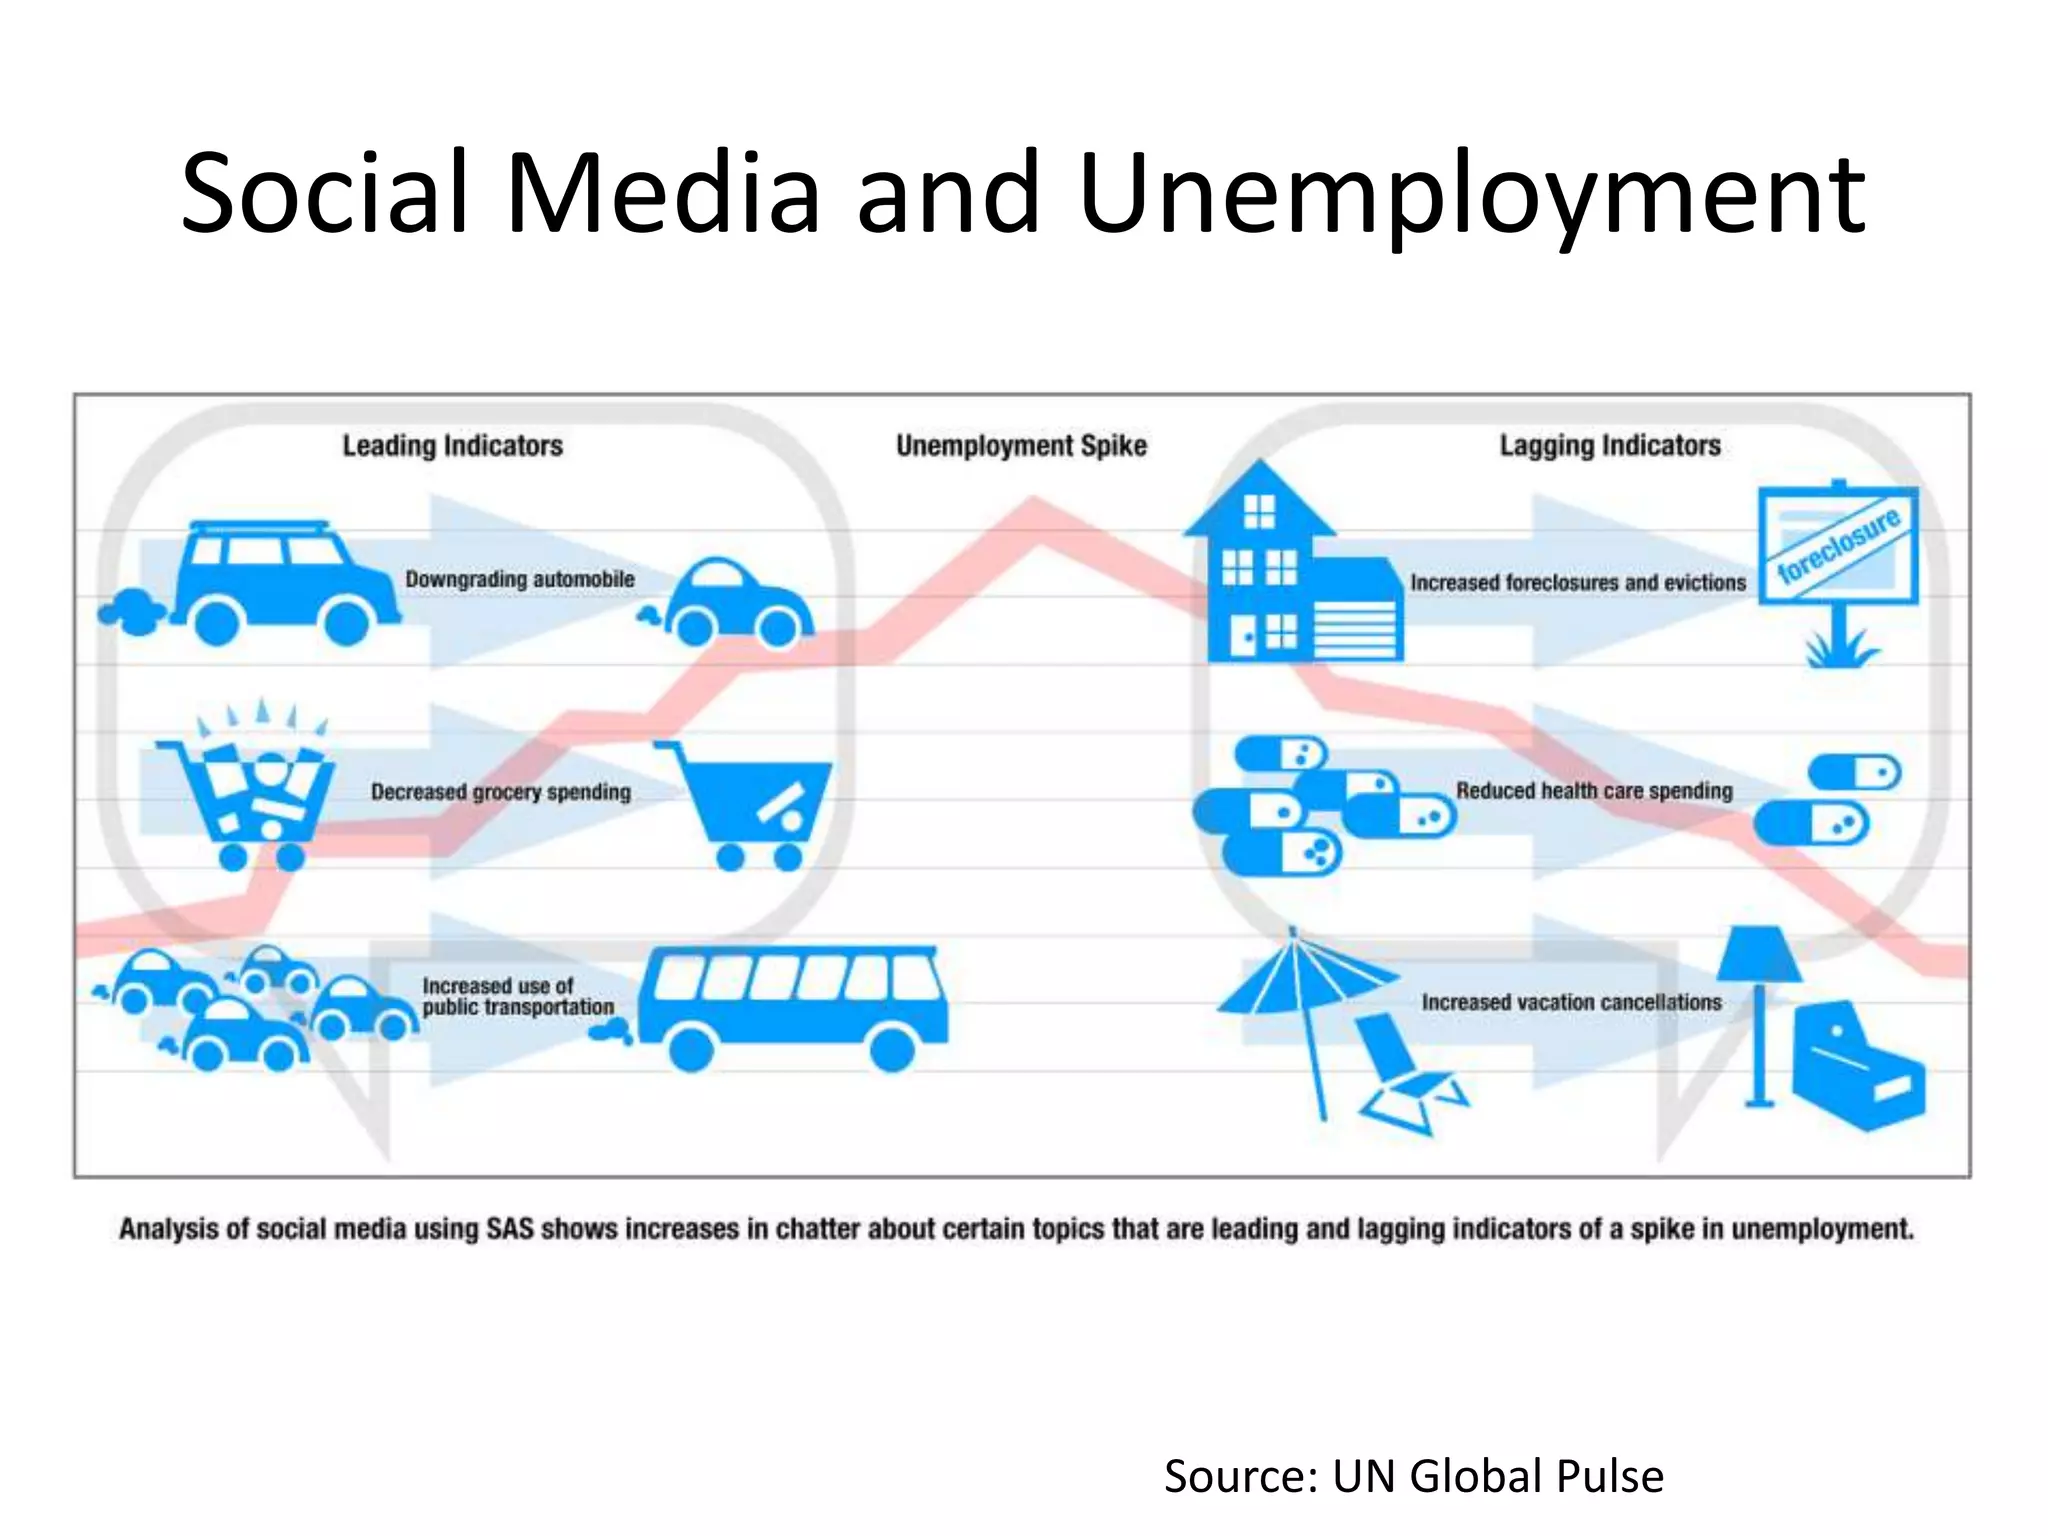
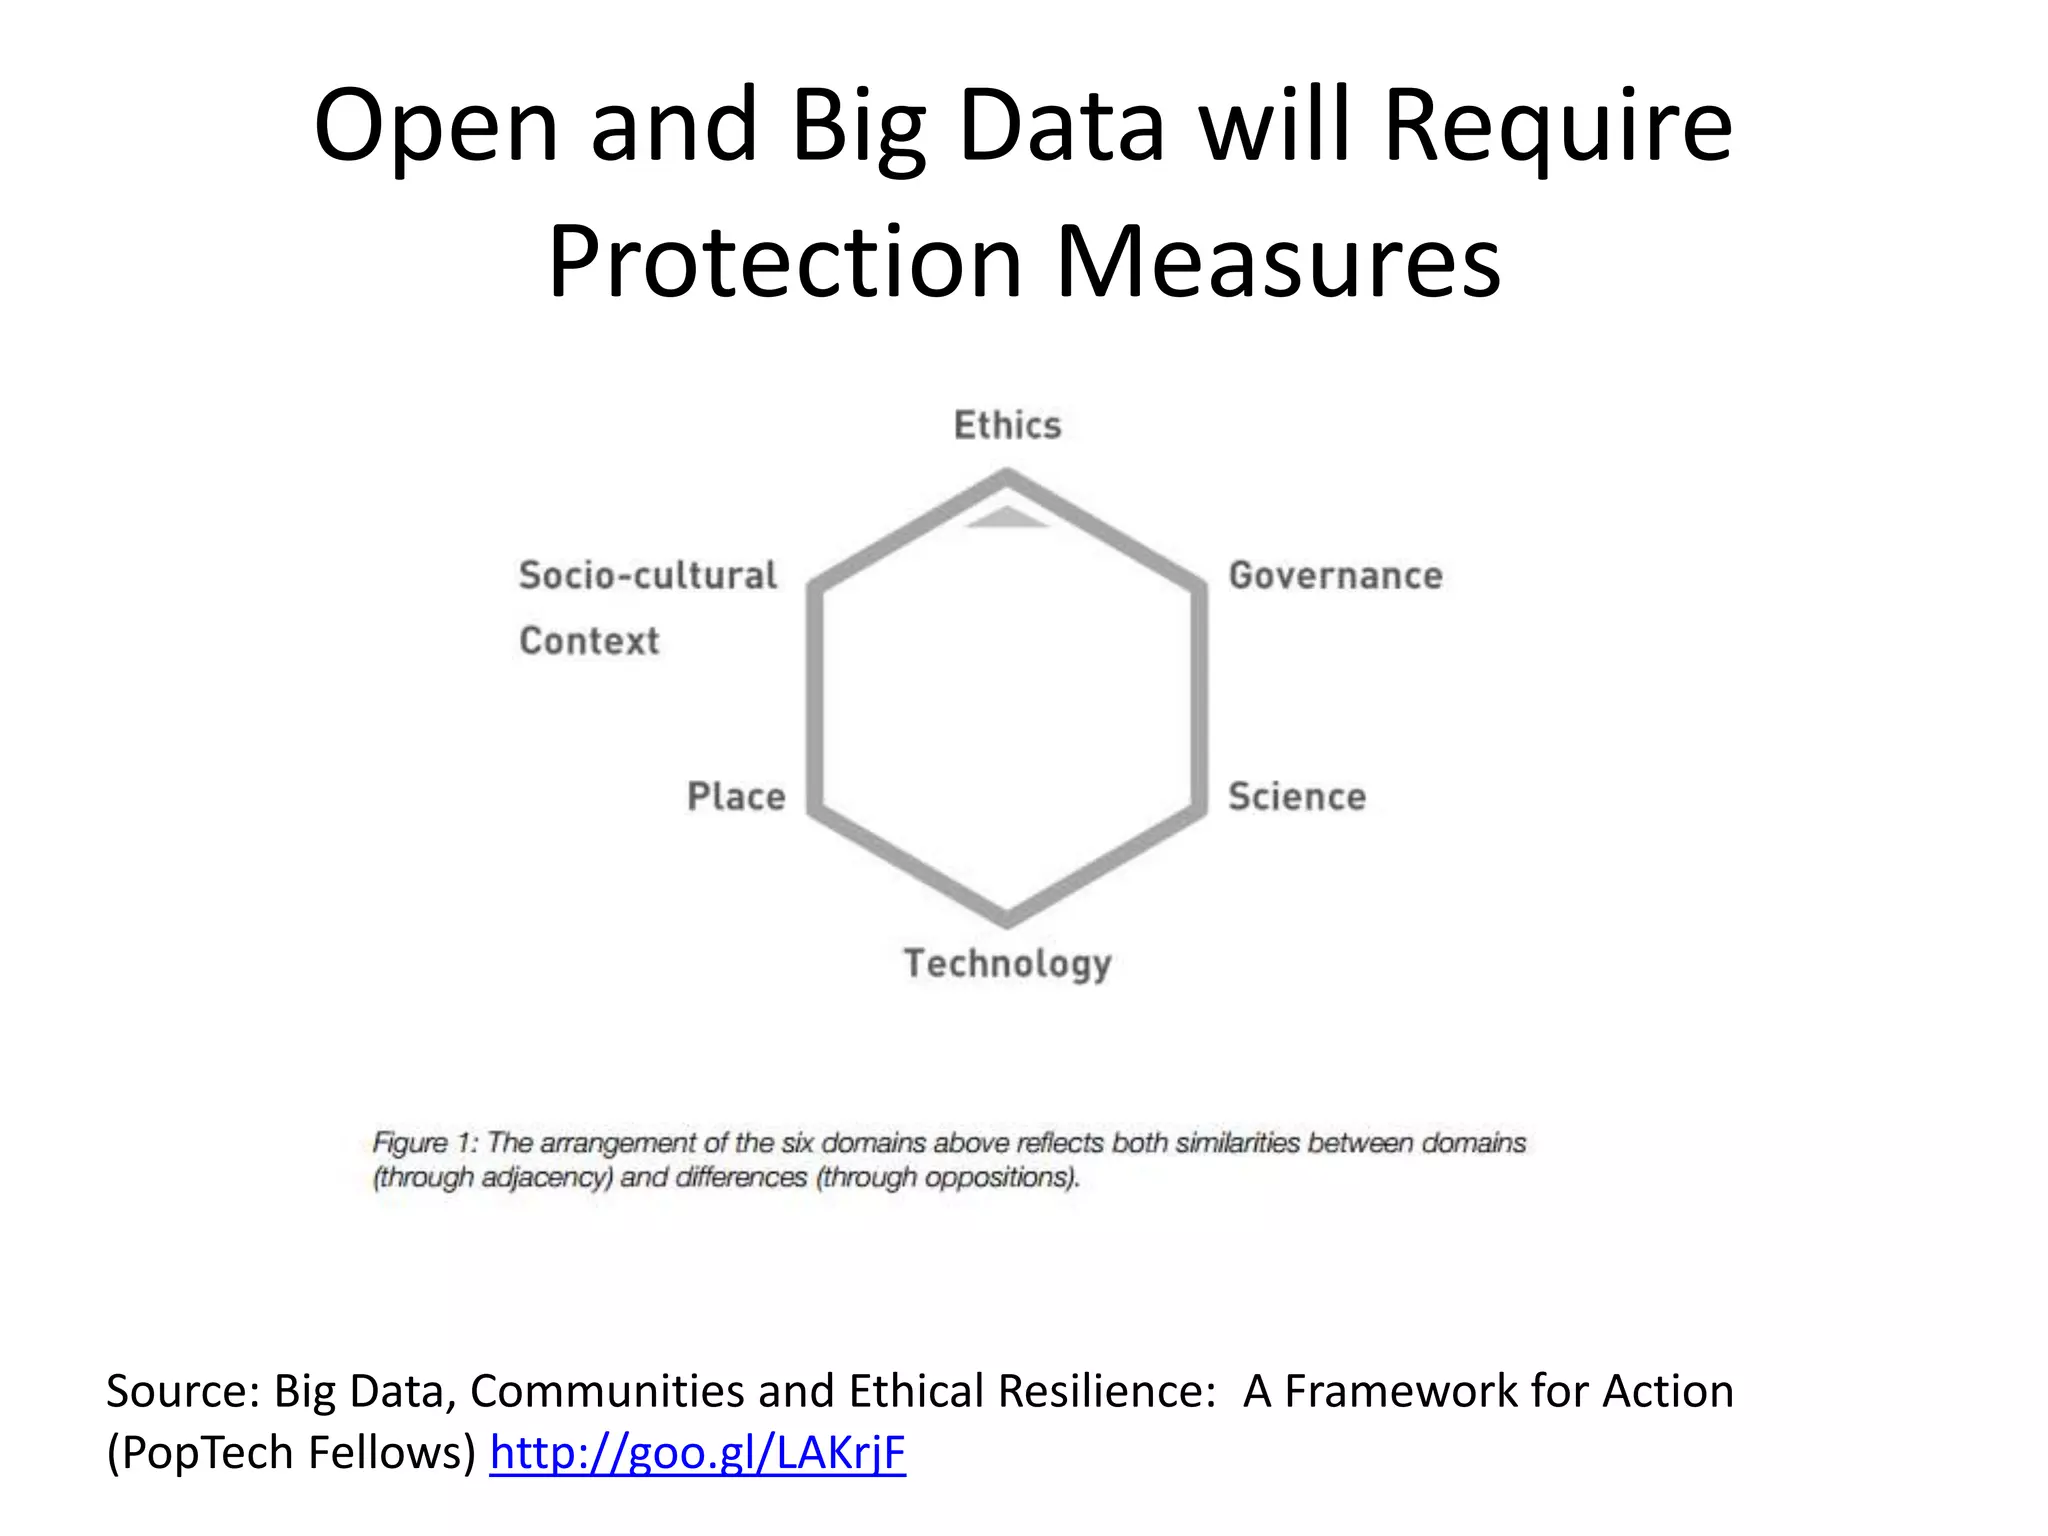


The document discusses emergent trends in crisis informatics, focusing on how innovations in information and communication technology (ICT) are transforming disaster response and information ecosystems. Key trends include improved global connectivity, the rise of cloud computing, semantic web advancements, and the importance of mobile and social networking in facilitating real-time collaboration and data utilization. It emphasizes the shift from traditional rigid institutions to adaptive, collaborative networks that leverage big data, open data, and visualization tools for better disaster management.


![Coded Agents – with UiPath SDK + LangGraph [Virtual Hands-on Workshop]](https://cdn.slidesharecdn.com/ss_thumbnails/codedagentsdeck-251215155422-5497c599-thumbnail.jpg?width=640&height=640&fit=bounds)


