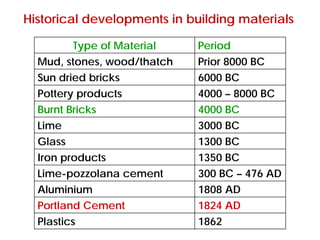
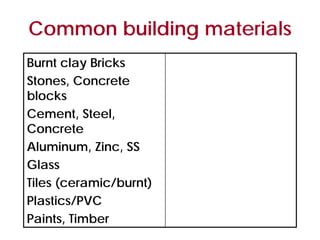
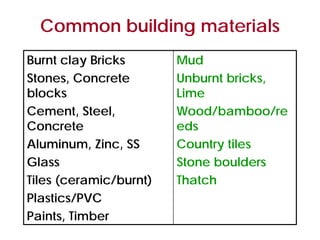
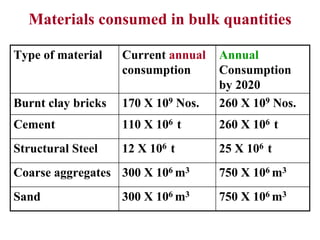
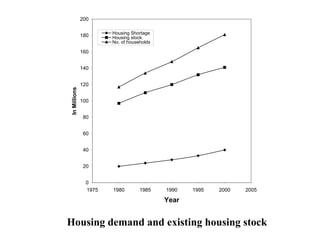
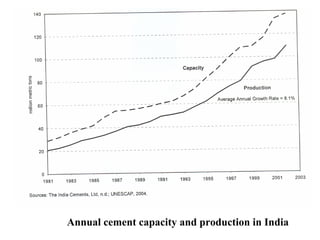
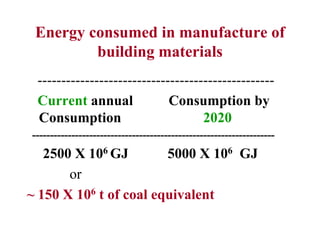
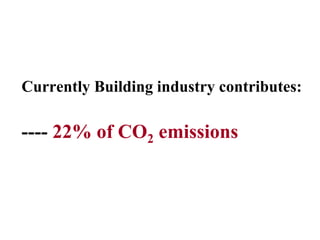
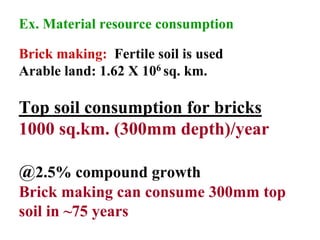
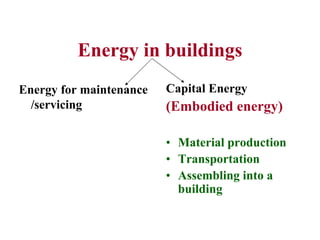
1) The document discusses embodied energy in building materials and construction. It notes that building materials like bricks, cement, steel consumption is increasing rapidly in India and will continue to do so.
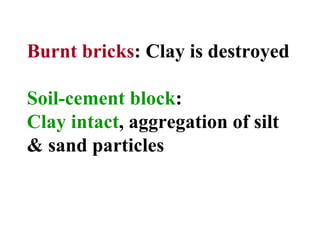
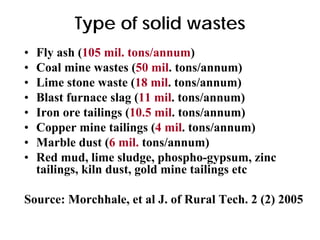
2) It emphasizes the need to use materials and construction techniques that reduce embodied energy and promote conservation of resources. Approaches suggested include using energy efficient building materials like stabilized mud blocks, adopting renewable energy sources, and recycling of solid wastes.
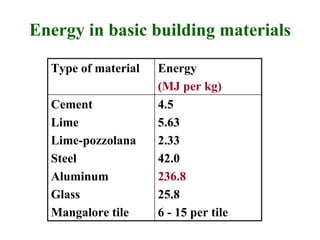
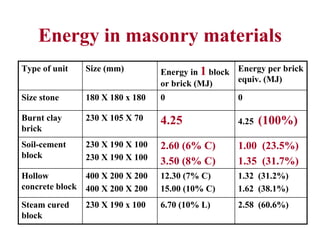
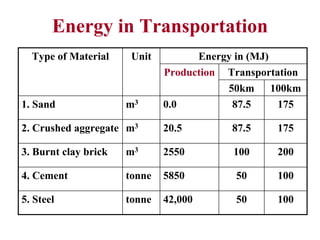
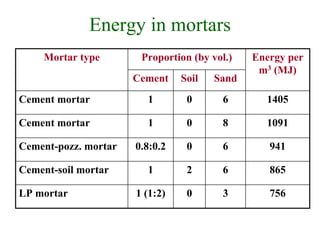
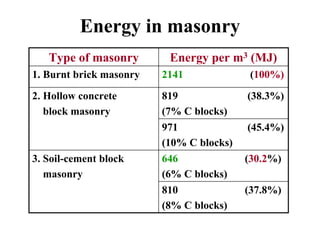
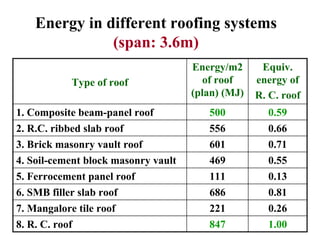
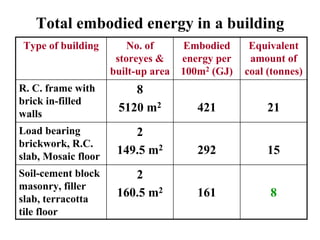
3) Embodied energy calculations are provided for common building materials as well as for different building typologies. Using local and efficient materials like stabilized mud blocks can significantly reduce the embodied energy of buildings.