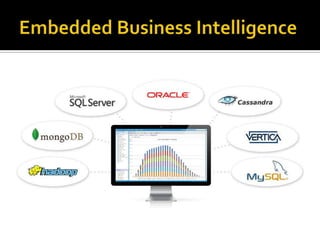
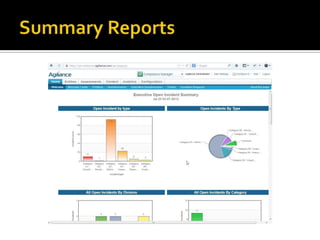


EMBEDDED BI is the integration of reports,
dashboards, and analytic views inside an
application. The information is typically
displayed and managed by a BI platform and
is placed directly within the application user
interface to improve the context and usability
of the data. Use of an embedded BI platform
delivers state-of-the-art reporting and
analytics without the time and expense of
having to build it.
1.
2.

3.

4.

Make your users smarter with insight powered
by embedded reports, dashboards & analytics
Improve your brand and customer relationships
with customer facing analytics in your external
portal or application
Free up your engineering team from building
custom reports by integrating self-service
Business Intelligence
Accelerate time-to-production using a pre-built,
easy to integrate BI solution for your onpremises, cloud, or Big Data application
1.
2.

3.

4.
5.

Beat the competition with more robust and
comprehensive reports, graphs, and dashboards
Make your application users smarter with
insight from your application data through
interactive dashboards & analytics
Free up your engineering team from building
custom reports by integrating self-service
Business Intelligence
Drive new revenue with value added reporting
and analytics services inside your application
Increase your time-to-market by integrating BI
rather than building it yourself






Interactive Reports Interact with report charts
and tables including on-the-fly sorting, filtering,
and formatting of column values and headers.
Embedded Dashboards and Mashboards
Provide a collection of interactive reports,
charts, and external web content onto a single
screen
Data Exploration Create and explore summary
and detail data from relational, OLAP, or Big
Data sources using a highly interactive browserbased solution






OLAP Analysis Analyze large relational data sets
using powerful analytic queries and an intuitive
interactive user interface, providing pivoting,
filtering, and drilling of data
Data Virtualization Integrate multiple data
sources into a single metadata view to enable
analysis and reporting across disparate sources
without requiring ETL or a Data Warehouse
Data Integration Build a central data repository
by extracting data from various relational and
non-relational sources and load into a data
warehouse or data mart






Mobile Ready Reports & Dashboards Create and view
reports, dashboards and analysis on iPhone or
Android devices
Multi-Tenant BI Using a single Jaspersoft
environment, quickly isolate users, roles, reports, and
related permissions to securely separate one tenant
from another for SaaS-based applications
Web Service Accessible Platform Access powerful BI
services using programmatic interfaces to control the
look and feel of your application and drive closed loop
data to action within your application
Level 1: Static reporting using an embedded
reporting library.
 Level 2: Managed reporting with simple
interactivity, scheduling, security, and
distribution using a reporting server.
 Level 3: Highly interactive reports and
dashboards using a reporting server.
 Level 4: Self-service ad hoc driven reports and
data analysis using a BI server
 Level 5: Advanced analytics against a data mart
using a BI server.

Nithinsai
Skype: nithinsaai




Business Intelligence

  • 5.
     EMBEDDED BI isthe integration of reports, dashboards, and analytic views inside an application. The information is typically displayed and managed by a BI platform and is placed directly within the application user interface to improve the context and usability of the data. Use of an embedded BI platform delivers state-of-the-art reporting and analytics without the time and expense of having to build it.
  • 6.
    1. 2. 3. 4. Make your userssmarter with insight powered by embedded reports, dashboards & analytics Improve your brand and customer relationships with customer facing analytics in your external portal or application Free up your engineering team from building custom reports by integrating self-service Business Intelligence Accelerate time-to-production using a pre-built, easy to integrate BI solution for your onpremises, cloud, or Big Data application
  • 7.
    1. 2. 3. 4. 5. Beat the competitionwith more robust and comprehensive reports, graphs, and dashboards Make your application users smarter with insight from your application data through interactive dashboards & analytics Free up your engineering team from building custom reports by integrating self-service Business Intelligence Drive new revenue with value added reporting and analytics services inside your application Increase your time-to-market by integrating BI rather than building it yourself
  • 8.
       Interactive Reports Interactwith report charts and tables including on-the-fly sorting, filtering, and formatting of column values and headers. Embedded Dashboards and Mashboards Provide a collection of interactive reports, charts, and external web content onto a single screen Data Exploration Create and explore summary and detail data from relational, OLAP, or Big Data sources using a highly interactive browserbased solution
  • 9.
       OLAP Analysis Analyzelarge relational data sets using powerful analytic queries and an intuitive interactive user interface, providing pivoting, filtering, and drilling of data Data Virtualization Integrate multiple data sources into a single metadata view to enable analysis and reporting across disparate sources without requiring ETL or a Data Warehouse Data Integration Build a central data repository by extracting data from various relational and non-relational sources and load into a data warehouse or data mart
  • 10.
       Mobile Ready Reports& Dashboards Create and view reports, dashboards and analysis on iPhone or Android devices Multi-Tenant BI Using a single Jaspersoft environment, quickly isolate users, roles, reports, and related permissions to securely separate one tenant from another for SaaS-based applications Web Service Accessible Platform Access powerful BI services using programmatic interfaces to control the look and feel of your application and drive closed loop data to action within your application
  • 11.
    Level 1: Staticreporting using an embedded reporting library.  Level 2: Managed reporting with simple interactivity, scheduling, security, and distribution using a reporting server.  Level 3: Highly interactive reports and dashboards using a reporting server.  Level 4: Self-service ad hoc driven reports and data analysis using a BI server  Level 5: Advanced analytics against a data mart using a BI server. 
  • 16.