The document provides instructions for calculating magnification and size measurements from electron microscope images using scale bars. It describes measuring the scale bar length, converting units, calculating magnification by dividing the measured scale bar length by its labeled length. It also explains measuring a specimen, dividing by the scale bar length to find how many bars long it is, and multiplying that by the scale bar size label to determine the specimen's actual size.
PR173 : Automatic Chemical Design Using a Data-Driven Continuous Representati...Sunghoon Joo
Paper review slide.
Title : Automatic Chemical Design Using a Data-Driven Continuous Representation of Molecules
Paper url : https://pubs.acs.org/doi/full/10.1021/acscentsci.7b00572
video url : https://youtu.be/hk4e8ZCkNWg
Biomedical Signal Processing / Biomedical Signals/ Bio-signals/ Bio-signals C...Mehak Azeem
These amazing and highly informative slides presented to the IEEE Signal Processing Society of IEEE MESCE Student Branch. These slides aim to provide basic knowledge about biosignals, their classification, examples and their working.
For more information, please contact:
[mehakazeem@ieee.org]
Analysis of Image Fusion Techniques for fingerprint Palmprint Multimodal Biom...IJERA Editor
The multimodal Biometric System using multiple sources of information has been widely recognized. However computational models for multimodal biometrics recognition have only recently received attention. In this paper the fingerprint and palmprint images are chosen and fused together using image fusion methods. The biometric features are subjected to modality extraction. Different fusion methods like average fusion, minimum fusion, maximum fusion, discrete wavelet transform fusion and stationary wavelet transformfusion are implemented for the fusion of extracting modalities. The best fused template is analyzed by applying various fusion metrics. Here the DWT fused image provided better results.
Scanning electron microscopy (SEM) Likhith KLIKHITHK1
Scanning Electron Microscope functions exactly as their optical counterparts except that they use a focused beam of electrons instead of light to “image” the specimen and gain information as to its structure and composition. Given sufficient light, the unaided human eye can distinguish two points 0.2 mm apart. If the points are closer together, they will appear as a single point. This distance is called the resolving power or resolution of the eye. Similarly, light microscopes use visible light (400- 700nm) and transparent lenses to see objects as small as about one micrometer (one millionth of a meter), such as a red blood cell (7 μm) or a human hair (100 μm). Light microscope has a magnification of about 1000x and enables the eye to resolve objects separated by 200 nm. Electron Microscopes were developed due to the limitations of light microscopes, which are limited by the physics of light. Electron Microscopes are capable of much higher magnifications and have a greater resolving power than a light microscope, allowing it to see much smaller objects at sub cellular, molecular and atomic level. The smallest the wavelength of the illuminating sources is the best resolution of the microscope. De Broglie defined the wavelength of moving particles (electron) λ = h/mv, Where λ= wavelength of particles, h= Planck, s constant, m= mass of the particle (electron), v= velocity of the particles; after substituting the known values, λ = 12.3 Ao/V. The resolution of an optical microscope is defined as the shortest distance between two points on a specimen that can still be distinguished by the observer or camera system as separate entities. Resolution (r) = λ/ (2NA), Where λ is the imaging wavelength, NA is objective numerical aperture. Magnification is the process of enlarging the appearance, not physical size, of something. Magnification is defined as the ratio of image distance versus object distance. M= v/u, Where M= magnification, u= object distance, v= image distance. Magnification is also defined as the ratio of the resolving power of the eye to resolving power (δ) of the microscope M= δ eye/ δ microscope.
Performance comparison of noise reduction in mammogram imageseSAT Journals
Abstract
Noise level present in mammogram images highly affects the image analysis and accuracy of classification. Hence removing noise
present in mammogram images is an important task. Noise present in the medical images depends on imaging modalities. The
dominant noise present in mammogram images are quantum noise. The objective of this work is to study the various filters such as
mean, median and wiener filter with different window size using standard benchmark (Digital Database for Screening
Mammography) DDSM dataset. Higher the value of the (Peak Signal to Noise Ratio) PSNR, better the image quality of the
restored image. The restored image quality of various filters was evaluated with PSNR value. We obtained, the wiener filter with
window size 3x3 gives better result for noise reduction in mammogram images.
Key Words: Mammogram, Quantum Noise, Mean Filter, Median Filter, Wiener Filter, DDSM and PSNR
We all have good and bad thoughts from time to time and situation to situation. We are bombarded daily with spiraling thoughts(both negative and positive) creating all-consuming feel , making us difficult to manage with associated suffering. Good thoughts are like our Mob Signal (Positive thought) amidst noise(negative thought) in the atmosphere. Negative thoughts like noise outweigh positive thoughts. These thoughts often create unwanted confusion, trouble, stress and frustration in our mind as well as chaos in our physical world. Negative thoughts are also known as “distorted thinking”.
Students, digital devices and success - Andreas Schleicher - 27 May 2024..pptxEduSkills OECD
Andreas Schleicher presents at the OECD webinar ‘Digital devices in schools: detrimental distraction or secret to success?’ on 27 May 2024. The presentation was based on findings from PISA 2022 results and the webinar helped launch the PISA in Focus ‘Managing screen time: How to protect and equip students against distraction’ https://www.oecd-ilibrary.org/education/managing-screen-time_7c225af4-en and the OECD Education Policy Perspective ‘Students, digital devices and success’ can be found here - https://oe.cd/il/5yV
Ethnobotany and Ethnopharmacology:
Ethnobotany in herbal drug evaluation,
Impact of Ethnobotany in traditional medicine,
New development in herbals,
Bio-prospecting tools for drug discovery,
Role of Ethnopharmacology in drug evaluation,
Reverse Pharmacology.
Read| The latest issue of The Challenger is here! We are thrilled to announce that our school paper has qualified for the NATIONAL SCHOOLS PRESS CONFERENCE (NSPC) 2024. Thank you for your unwavering support and trust. Dive into the stories that made us stand out!
How to Make a Field invisible in Odoo 17Celine George
It is possible to hide or invisible some fields in odoo. Commonly using “invisible” attribute in the field definition to invisible the fields. This slide will show how to make a field invisible in odoo 17.
The Roman Empire A Historical Colossus.pdfkaushalkr1407
The Roman Empire, a vast and enduring power, stands as one of history's most remarkable civilizations, leaving an indelible imprint on the world. It emerged from the Roman Republic, transitioning into an imperial powerhouse under the leadership of Augustus Caesar in 27 BCE. This transformation marked the beginning of an era defined by unprecedented territorial expansion, architectural marvels, and profound cultural influence.
The empire's roots lie in the city of Rome, founded, according to legend, by Romulus in 753 BCE. Over centuries, Rome evolved from a small settlement to a formidable republic, characterized by a complex political system with elected officials and checks on power. However, internal strife, class conflicts, and military ambitions paved the way for the end of the Republic. Julius Caesar’s dictatorship and subsequent assassination in 44 BCE created a power vacuum, leading to a civil war. Octavian, later Augustus, emerged victorious, heralding the Roman Empire’s birth.
Under Augustus, the empire experienced the Pax Romana, a 200-year period of relative peace and stability. Augustus reformed the military, established efficient administrative systems, and initiated grand construction projects. The empire's borders expanded, encompassing territories from Britain to Egypt and from Spain to the Euphrates. Roman legions, renowned for their discipline and engineering prowess, secured and maintained these vast territories, building roads, fortifications, and cities that facilitated control and integration.
The Roman Empire’s society was hierarchical, with a rigid class system. At the top were the patricians, wealthy elites who held significant political power. Below them were the plebeians, free citizens with limited political influence, and the vast numbers of slaves who formed the backbone of the economy. The family unit was central, governed by the paterfamilias, the male head who held absolute authority.
Culturally, the Romans were eclectic, absorbing and adapting elements from the civilizations they encountered, particularly the Greeks. Roman art, literature, and philosophy reflected this synthesis, creating a rich cultural tapestry. Latin, the Roman language, became the lingua franca of the Western world, influencing numerous modern languages.
Roman architecture and engineering achievements were monumental. They perfected the arch, vault, and dome, constructing enduring structures like the Colosseum, Pantheon, and aqueducts. These engineering marvels not only showcased Roman ingenuity but also served practical purposes, from public entertainment to water supply.
2024.06.01 Introducing a competency framework for languag learning materials ...Sandy Millin
http://sandymillin.wordpress.com/iateflwebinar2024
Published classroom materials form the basis of syllabuses, drive teacher professional development, and have a potentially huge influence on learners, teachers and education systems. All teachers also create their own materials, whether a few sentences on a blackboard, a highly-structured fully-realised online course, or anything in between. Despite this, the knowledge and skills needed to create effective language learning materials are rarely part of teacher training, and are mostly learnt by trial and error.
Knowledge and skills frameworks, generally called competency frameworks, for ELT teachers, trainers and managers have existed for a few years now. However, until I created one for my MA dissertation, there wasn’t one drawing together what we need to know and do to be able to effectively produce language learning materials.
This webinar will introduce you to my framework, highlighting the key competencies I identified from my research. It will also show how anybody involved in language teaching (any language, not just English!), teacher training, managing schools or developing language learning materials can benefit from using the framework.
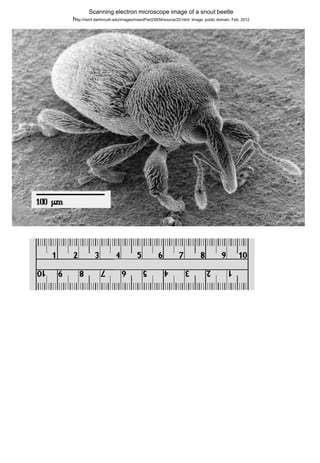
1. Scanning electron microscope image of a snout beetle
http://remf.dartmouth.edu/images/insectPart2SEM/source/20.html Image: public domain. Feb. 2012
2. Calculating Linear Magnification
of an Electron-Micrograph using it's scale bar
There are three steps:
Measure the length of the scale bar - in mm.
Convert your measurement into µm.
32mm
Calculate the magnification.
(Magnification = measured length /the number written.
As long as you have the SAME UNITS)
32 x 1000 = 32000µm
Magnifiation = the number of times bigger the scale bar actually is, compared to the
measurement written on it?
32000µm / 100 µm = 320x magnification
3. Scanning electron microscope image of a snout beetle
http://remf.dartmouth.edu/images/insectPart2SEM/source/20.html Image: public domain. Feb. 2012
4. Calculating Specimen Size
using a scale bar
There are four steps:
Measure the length of the Specimen in mm.
(show working)
Measure the length of the scale bar in mm.
Calculate how many scale bar lengths make the specimen.
(Divide length of specimen by length of scale bar)
Calculate the size. Multiply the scale bar label by the last answer.
(UNITS are the same as the scale bar)
2.6 x 100 µm = 260µm
5. Scanning electron microscope image of a snout beetle
http://remf.dartmouth.edu/images/insectPart2SEM/source/20.html Image: public domain. Feb. 2012
Magnifiation = x 320
6. Calculating Specimen Size
using magnification
There are three steps:
Measure the length of the Image of the Specimen in mm.
(show working)
Convert the length of the Specimen image to µm.
(x 1000)
Calculate the actual size.
Divide the length of the specimen image by the magnification
(UNITS are µm)
7. Electron microscope image of pollen grains from oriental lily.
http://remf.dartmouth.edu/images/botanicalPollenSEM/source/3.html Image: public domain. Feb. 2012
8. Calculating Linear Magnification
of an Electron-Micrograph using it's scale bar
There are three steps:
Measure the length of the scale bar - in mm.
Convert your measurement into µm.
Calculate the magnification.
(Magnification = measured length /the number written.
As long as you have the SAME UNITS)
Magnifiation = the number of times bigger the scale bar actually is, compared to the
measurement written on it?
magnification
9. Electron microscope image of pollen grains from oriental lily.
http://remf.dartmouth.edu/images/botanicalPollenSEM/source/3.html Image: public domain. Feb. 2012
10. Calculating Specimen Size
using a scale bar
There are four steps:
Measure the length of the Specimen in mm.
(show working)
Measure the length of the scale bar in mm.
Calculate how many scale bar lengths make the specimen.
(Divide length of specimen by length of scale bar)
Calculate the size. Multiply the scale bar label by the last answer.
(UNITS are the same as the scale bar)
11. Electron microscope image of pollen grains from oriental lily.
http://remf.dartmouth.edu/images/botanicalPollenSEM/source/3.html Image: public domain. Feb. 2012
Magnification = x 2500
12. Calculating Specimen Size
using magnification
There are three steps:
Measure the length of the Image of the Specimen in mm.
(show working)
Convert the length of the Specimen image to µm.
(x 1000)
Calculate the actual size.
Divide the length of the specimen image by the magnification
(UNITS are µm)
13. Human leukocyte - showing golgi apparatus
http://remf.dartmouth.edu/images/humanBloodCellsTEM/source/3.html Image: public domain. Feb. 2012
14. Calculating Linear Magnification
of an Electron-Micrograph using it's scale bar
There are three steps:
Measure the length of the scale bar - in mm.
Convert your measurement into nm this time.
Calculate the magnification.
(Magnification = measured length /the number written.
As long as you have the SAME UNITS)
Magnifiation = the number of times bigger the scale bar actually is, compared to the
measurement written on it?
magnification
15. Calculating Specimen Size
using a scale bar
There are four steps:
Measure the length of the Specimen in mm.
(show working)
Measure the length of the scale bar in mm.
Calculate how many scale bar lengths make the specimen.
(Divide length of specimen by length of scale bar)
Calculate the size. Multiply the scale bar label by the last answer.
(UNITS are the same as the scale bar)