Download to read offline
![Author's personal copy
Sensors and Actuators A 167 (2011) 327–331
Contents lists available at ScienceDirect
Sensors and Actuators A: Physical
journal homepage: www.elsevier.com/locate/sna
A comparison of mass parameters determination using capacitive and optical
sensors
V. Carvalhoa,∗
, M. Belsleyb
, R. Vasconcelosc
, F. Soaresa
a
Dept. Indus. Electronics, Minho University, 4800 058 Guimarães, Portugal
b
Dept. Physics, Minho University, 4710 057, Braga, Portugal
c
Dept. Textile Engineering. Minho University, 4800 058 Guimarães, Portugal
a r t i c l e i n f o
Article history:
Received 13 October 2010
Received in revised form 28 February 2011
Accepted 1 March 2011
Available online 8 March 2011
Keywords:
Yarn mass parameterization
Diameter and mass correlation
Optical sensors
Capacitive sensors
Optical signal processing
a b s t r a c t
This paper presents a comparison study between the use of 1 mm resolution capacitive and optical sensors
for the determination of yarn mass parameters. A parallel plate capacitive sensor to determine yarn
mass variations and a yarn diameter and hairiness determination solution using optical sensors and
integrating optical signal processing based on Fourier analysis are described. As there is a high correlation
between yarn diameter and yarn mass, it is possible to determine yarn mass and infer variations in yarn
diameter and vice versa. Moreover, by optically detecting the degree of yarn hairiness, one can quantify its
influence on the capacitive sensor mass variation measurements. Here we present the results of a signal
processing analysis and statistical description of measurements carried out in two 100% cotton yarns
with a linear mass of 59 and 295 g/km performed in yarn system quality (YSQ) machine. We conclude
that an accurate yarn characterization can be carried out using optical sensors alone, reducing system’s
cost and complexity and increasing efficiency.
© 2011 Elsevier B.V. All rights reserved.
1. Introduction
Mass parameters are important elements of yarn quality assess-
ment. These include yarn diameter, mass and hairiness. To measure
yarn mass, electronic capacitance testers are usually applied as a
convenient and reliable method (determination of linear mass).
The most commonly used industrial systems, such as ZT5 (Zwei-
gle) and Tester 5 (Uster) use capacitors with 8 mm length, allowing
measurements with 8 mm resolution. However, as most of the
irregularities (Fig. 1) have a shorter length, an assessment evalu-
ated in 1 mm range is of utmost importance for a correct and direct
characterization [1].
There are three kinds of yarn faults, classified as shown in Fig. 1:
thin places – a decrease in the mass during a short length (4 mm);
thick places – an increase in the mass, usually lower than 100%
of sensitivity, and lasting more than 4 mm; neps – huge amount of
yarn mass (equal or superior to 100% of sensitivity) in a short length
(typically from 1 mm to 4 mm) [2–5]. Sensitivity is defined as the
yarn mass value used to detect a particular fault and is expressed in
terms of the average yarn mass [2]. As an example, 60% of sensitivity
to classify thick places means that mass measurements above 0.4
of the mass average are considered a fault; for thin places, below
0.6 of the mass average.
∗ Corresponding author.
E-mail address: vcarvalho@dei.uminho.pt (V. Carvalho).
Optical sensors are also used to measure yarn diameter and
hairiness directly (Fig. 2). Hairiness is the result of released fibres
over the strand. Fig. 2 presents an example of hairiness [5,6]. In
addition, optical sensors also allow an indirect measurement of
yarn mass due to the relationship between linear mass and yarn
diameter, as can be observed in Fig. 3.
The most commonly used commercial system based on this
methodology is the Oasys from Zweigle, which employs a sample
measurement field of 2 mm. Also, in this system, yarn hairiness can
have a significant and undesired influence by reducing the signal
received by the optical sensor, consequently leading to diameter
measurement with an error by excess [7]. To measure hairiness,
the traditional equipment ZT5 (Zweigle) and Tester 5 (Uster) use a
dark field optics based technique. However, this method has several
drawbacks that can cause a significant measurement error, namely
the inexistence of a 0% of hairiness reference, the consideration of
the yarn contours, the dependence on the yarn shape and align-
ment and without a proportional signal output to the quantity of
hairiness [8,9].
The present work is aimed at carrying out tests with 1 mm sam-
ples using capacitive and optical sensors to compare yarn mass
parameters results obtained in the YSQ equipment.
2. The measurement hardware
This section describes the yarn mass, diameter and hairiness
measurement hardware implemented in YSQ machine (Fig. 4).
0924-4247/$ – see front matter © 2011 Elsevier B.V. All rights reserved.
doi:10.1016/j.sna.2011.03.006](https://image.slidesharecdn.com/sna7275-160608190509/85/Sna7275-2-320.jpg)
![Author's personal copy
328 V. Carvalho et al. / Sensors and Actuators A 167 (2011) 327–331
Thin Places
Thick Places
Neps
Fig. 1. Types of yarn irregularities.
Fig. 2. Identification of yarn hairiness in an electron microscope photograph.
These characteristics of the measurement hardware allow a supe-
rior yarn parameterization, high resolution and precision [1].
2.1. Yarn mass variation system
The yarn mass variation system employed uses a 1 mm paral-
lel plate capacitive sensor based on the integrated circuit MS3110
from Irvine Sensors, allowing direct yarn mass measurements over
sample lengths of 1 mm. The sensor adopts a differential configura-
tion to assure a higher robustness to variations in temperature, air
humidity and pressure. It integrates transducer amplification and
signal conditioning, as shown in Fig. 5 [1].
As shown in Fig. 5 the sensor capacitance variation is converted
into a voltage signal and amplified. A second order low-pass fil-
ter attenuates the high frequency interferences that come from
an internal oscillator and other external noise sources. The filtered
signal is then once more amplified.
Mean Value
Diameter
Length
Fig. 3. Yarn configuration example.
Fig. 4. YSQ prototype.
2.2. Yarn diameter and hairiness quantification
The yarn diameter and hairiness quantification, based on two
single photodiodes (S1227-1010BR from Hamamatsu) configured
for a 1 mm sample length analysis, uses an optical setup with
a low-pass spatial filter, to perform the diameter measurement
(eliminating the influence of hairiness, Fig. 6a), as well as with
a high-pass spatial filter, to perform the hairiness measurement
(eliminating the influence of the light which is not blocked by the
yarn, Fig. 6b) [1,7–9].
Fig. 7 presents the optical hardware employed to determine yarn
diameter and hairiness. A coherent optical imaging technique is
employed to obtain an optical signal proportional to the amount of
hairiness present on the yarn being sampled.
Adiode laser (Eudyna FLD6A2TK) was used as an illumination
source. This laser emits light at 685 ± 10 nm in both a single trans-
verse and single longitudinal mode, with an especially low aspect
ratio of 1.3. Emitting in a single longitudinal mode, the coherence
length of the laser light is expected to be greater than several
metres. The light from this laser was collimated using a single
plano-convex lens of 40 mm focal length (L1). After illuminating
the sample under study (O), the light passes through a 60 mm focal
length, 50 mm diameter plano-convex lens (L2) used to obtain the
spatial Fourier transform of the object in its principal focal plane.
A roughly 1 mm diameter opaque target (F) placed in the Fourier
plane, blocks all spatial frequencies below 10 mm−1,corresponding
to a characteristic size of 100 m or larger in the object plane. The
filter is chosen to pass all of the relevant information regarding the
small fibres, while almost entirely eliminating the nearly constant
background light due to laser light that is not incident on the sam-
ple. However, the amount of light transmitted by the spatial filter
is relatively small, roughly 3 to 4 orders of magnitude less than the
full power emitted by the laser. A third plano-convex lens of 60 mm
focal length (L3) is used to form a final filtered image (position of
the photo detector in Fig. 4) (I/PD), which then highlights the sharp
transitions in the object, basically the core boundary of the fibre
and any small protruding hairs from the yarn core, allowing the
measurement of hairiness. All lenses are 1 inch in diameter, except](https://image.slidesharecdn.com/sna7275-160608190509/85/Sna7275-3-320.jpg)
![Author's personal copy
V. Carvalho et al. / Sensors and Actuators A 167 (2011) 327–331 329
Fig. 5. Capacitive sensor configuration [C1, C2 – adjustable capacitors to calibrate the sensors, AMP – capacity to voltage converter and amplifier, S/H – sample and hold, LPF
– two pole low pass filter, and BUFF – output buffer].
Fig. 6. Example of an image resulting from the application of a (a) low-pass spatial filter, (b) high-pass spatial filter.
for the Fourier lens, L2, which is 2 inches in diameter. The lenses
are carefully aligned to have a common optical axis.
For the diameter measurements, basically the same optical
hardware is used, with the exception that the high-pass spatial
filter is replaced by a low-pass spatial filter, corresponding to a
roughly 1 mm diameter circular aperture, i.e. the complement of
the high pass spatial filter. This filter blocks all spatial frequencies
above 10 mm−1,resultant to a characteristic size of 100 m or less
in the object plane.
Afterwards, in order to obtain a voltage proportional to the
brightness of the final image, a conditioning circuit was developed
for yarn hairiness/diameter quantification. A high precision current
to voltage converter based on a Burr–Brown operational amplifier
OPA277P was used between the output of the photodiode and the
sampling board.
Considering the hairiness measurement, the presented optical
configuration overcomes the referred drawbacks of most available
commercial methods. In particular it has been previously shown
possible to deduce from the acquired signals a signal reference for
0% of yarn hairiness [6], permitting one to exclude to the signal due
to the yarn contours. Furthermore the optical configuration is not
dependent on the hairiness orientation nor on the yarn diameter,
while the shape and alignment of the yarn are irrelevant as there is
Fig. 7. Custom developed optical yarn measurement hardware for a single direction.
a considerable safe area of detection in the implemented hairiness
system sensor [9]. Moreover, the obtained signal is proportional to
the length of hairs [6]. These characteristics are fundamental for
a reliable and precise characterization of yarn hairiness. Although
one might think that a full hairiness classification should require
several different and simultaneous projections, the fact that the
protruding hairs tend to be randomly distributed over the yarn sur-
face, allows one to obtain a reliable estimate of the average yarn
hairiness, provided a sufficient length of yarn is characterized. In a
previous study [9] it was verified that the results obtained using two
different simultaneous orthogonal projections give nearly identical
statistical results. As a consequence, a single projection is sufficient
for the correct determination of yarn hairiness [9]. The individual
sample length can be adjusted to values between a few microns
and 1 cm. However, a 1 mm reference sample length is considered
sufficient as the hairiness coefficient is determined in a centimetre
range, which is ten times superior to the standard sample length
used (1 cm). This enables the representation of the hairiness spec-
trogram starting at a 2 mm range and not on the 2 cm range, as in
the standard sample length based equipments.
For the diameter measurement, as in the hairiness determina-
tion module, a coherent optical signal processing technique based
on Fourier analysis was used to characterize yarn diameter using
a singular projection [10]. This method overcomes the referred
drawback of the commercial systems because the yarn hairiness
is filtered by a low-pass spatial filter, increasing the measure-
ment precision. A signal proportional to the yarn diameter is also
obtained [10]. Moreover, as in hairiness measurement, it was veri-
fied that irregularities are randomly distributed over the yarn and
so there is a high probability, considering the yarn length analyzed
in a test, that on average, the amount of irregularities is uniformly
distributed over a full rotation of the yarn [11]. A study undertaken
shows that the results obtained using two orthogonal projections
give nearly identical statistical results and as a consequence, a sin-
gle projection is sufficient for the correct determination of diameter
variation [11]. As in the hairiness module, the sample length can be
easily adjusted from some microns up to 1 cm. However, a 1 mm ref-
erence sample length is considered sufficient as the lowest length
irregularity (nep), generally has an extension of between 1 mm and](https://image.slidesharecdn.com/sna7275-160608190509/85/Sna7275-4-320.jpg)
![Author's personal copy
330 V. Carvalho et al. / Sensors and Actuators A 167 (2011) 327–331
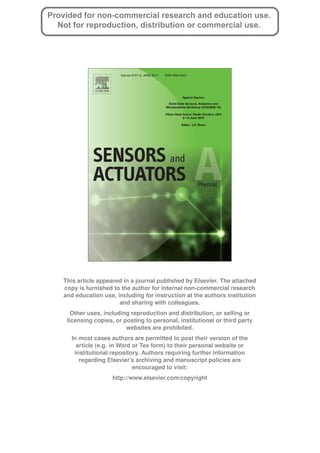
Fig. 8. Electron microscope pictures of the 59 g/km (a) and 295 g/km (b) yarns analyzed.
Table 1
Statistical results parameterization.
Statistical parameters (yarns) 59 g/km 295 g/km
Capacitive sensor Optical sensors Capacitive sensor Optical sensors
Mean deviation (U) (%) 14.0 15.4 13.9 16.0
Coefficient of variation (CV) (%) 19.6 18.3 17.5 20.6
40% Sensitivity thin places (/km) 25 20 12,800 12,600
40% Sensitivity thick places (/km) 56 152 11,400 37,800
200% Sensitivity neps (/km) 0 0 0 0
Hairiness index (H) (m/m) – 0.3 – 2.2
Standard deviation (H) (sH) (m/m) – 0.1 – 0.6
4 mm (Fig. 1), which can be measured directly by the standard sam-
ple length used. In this case, as in the hairiness measurement, a laser
source was used, permitting the definition of a linear saturation
zone with high directionally which enables a superior system sen-
sibility. The use of an incoherent light source would compromise
all these assumptions [10].
3. Experimental results
Considering the optical resolution of the yarn diameter and
hairiness measurements and the known relationship between yarn
linear mass (tex(g/km)) and diameter (m) (diameter = 0.060
√
tex)
[12]), it is possible to correctly determine the traditional yarn
parameters using only optical sensors[5,12]. In order to compare
these two systems, two 100% cotton yarns with a linear mass of 59
and 295 g/km linear mass yarn (Fig. 8) were evaluated.
The influence of hairiness on the capacitive sensor was on aver-
age, about 3E−11% in the 59 g/km yarn and 4E−11% in the 295 g/km
yarn, and so essentially negligible. Table 1 presents the statisti-
cal parameters obtained and Fig. 9, the signal processing results of
mass variation determined directly with the capacitive sensor and
inferred with the optical sensors.
As the data in Table 1 shows, regarding the main statisti-
cal parameters of mass (U%, CV% and irregularities) comparable
results are obtained from the capacitive and optical sensors, as
expected and in accordance to the previously presented relation-
ship between yarn linear mass and diameter except for the thick
places values. This can be explained by the higher resolution of the
optical method. As the optical sensor only considers the yarn core in
the measurements, it is more sensitive to deviations from the core
mean values in more than 40% thick places. On the other hand, the
fact that the capacitive sensors sample all of the yarn (core plus
protruding fibres) results in these sensors being less sensitive to
small deviations in the width of the core. A hairiness index (H) of
0.3 m/m with a standard deviation (sH) of 0.1 m/m is obtained for
the 59 g/km yarn and a hairiness index of 2.2 m/m with a standard
deviation of 0.6 m/m is obtained for the 295 g/km yarn. Further-
more, as can be seen in Fig. 8a and b, a high number of similar
protruding peaks (indicated with arrows) where obtained over the
same wavelengths of mass variation and diameter variation char-
acterization indicating that equal pattern distributions are present
in both signals.
Fig. 9. Mass variation signal processing results based on the FFT (a). Arrows indicate
the presence of similar protruding peaks in both spectrograms.](https://image.slidesharecdn.com/sna7275-160608190509/85/Sna7275-5-320.jpg)
![Author's personal copy
V. Carvalho et al. / Sensors and Actuators A 167 (2011) 327–331 331
4. Conclusions and further work
Considering the data obtained it is possible to state that there
is a strong similarity in the parameterization data acquired using
optical and capacitive sensors, implying a strong linear relation-
ship between mass and diameter variation. These results indicate
that a valid characterization of yarn mass parameters (U%, CV% and
irregularities, between others) can be obtained using optical sen-
sors. However, it must be noted that, the methods employed for
mass measurement and diameter measurement are not absolutely
equal, and that a fully accurate parameterization of mass requires a
capacitive sensor, considering the different geometries and mate-
rial density used in yarns. Also, in fairness, it should be remarked
that optical sensors based on coherent optical techniques are inher-
ently more sensitive to dust that might be present under industrial
conditions. However, the technique presented above is based on
a common path interference process and is rather insensitive to
vibrations. In addition, using optical sensors it is possible to obtain
very short sample lengths (less than 1 mm, if desired), allowing one
to characterize yarn with a much higher spatial resolution than can
be obtained with capacitive sensor measurements.
In summary, it is possible to conclude that using only optical
sensors is sufficient for an accurate yarn characterization of mass
parameters, reducing systems cost, complexity and increasing effi-
ciency of textile industry.
As already mentioned, YSQ equipment correctly characterizes
yarn mass parameters and hairiness values by using capacitive
and optical sensors. Moreover, although the YSQ has proven to be
economically competitive in the commercial market, we want to
reduce the costs using only the optical measurement. Future work
will then include the development of a prototype of yarn char-
acterization, with reduced dimension, using only optical sensors
as well as the definition of quality standards for high resolution
measurements (less or equal to 1 mm).
Acknowledgement
The authors are grateful to the Portuguese Foundation (FCT)
for providing the financial support through the scholarship
(BD/19028/2004) for this project.
References
[1] V. Carvalho, M. Belsley, R. Vasconcelos, F. Soares, Automatic yarn characteri-
zation system, in: IEEE Sensors 2008, 7th IEEE Conference on Sensors, 26–29
October 2008, Lecce, Italy, 2008.
[2] V. Carvalho, Parametrizac¸ ão de Fio Têxtil Baseada na Análise de Massa, Msc.
Thesis, Minho University, Guimarães, 2004.
[3] R. Furter, Evenness Testing in Yarn Production: Part I, The Textile Institute and
Zellweger Uster AG, Manchester, 1982.
[4] J. Neves, A Irregularidade dos Fios Têxteis Sua Origem, Medic¸ ão e Análise,
Oporto, 1968.
[5] B. Goswami, J. Martindale, F. Scardino, Textile Yarns: Technology Structure and
Applications, 2nd edition, John Wiley & Sons, New York, 1977.
[6] V. Carvalho, P. Cardoso, M. Belsley, R. Vasconcelos, F. Soares, Yarn hairiness
parameterization using a coherent signal processing technique, Sensors and
Actuators A: Physical 145 (1) (2008) 217–224.
[7] V. Carvalho, P. Cardoso, M. Belsley, R. Vasconcelos, F.O. Soares, Yarn diameter
measurements using coherent optical signal processing, IEEE Sensors Journal
8 (11) (2008) 1785–1793.
[8] Barella, Yarn hairiness, Textile Progress 13 (1981) 1.
[9] V. Carvalho, P. Cardoso, M. Belsley, R. Vasconcelos, F.O. Soares, Yarn Hairi-
ness characterization using two orthogonal directions, IEEE Transactions on
Instrumentation and Measurement 58 (3) (2009) 594–601.
[10] V. Carvalho, P. Cardoso, M. Belsley, R. Vasconcelos, F. Soares, Yarn diameter
measurements using coherent optical signal processing, IEEE Sensors Journal
8 (11) (2008) 1785–1793.
[11] V. Carvalho, P. Cardoso, M. Belsley, R. Vasconcelos, F. Soares, Yarn diame-
ter characterization using two orthogonal directions, Journal Experimental
Techniques (2010), doi:10.1111/j.1747-1567.2010.00632.x (published online
in 12th, April).
[12] V Carvalho, M. Belsley, R. Vasconcelos, F.O. Soares, Yarn diameter and linear
mass correlation, Journal of Non-Destructive Evaluation 28 (2) (2009) 49–54.
Biographies
V. Carvalho received his degree in industrial electronics engineering in the option
of telecommunications and industrial informatics, in 2002 and MSc in indus-
trial electronics, in the option of automation and robotics in 2004, both from
Minho University, Portugal. He concluded his PhD in industrial electronics in
2008, covering the subject presented here. Actually he is working as assistant
professor at the Polytechnic Institute of Cávado and Ave (IPCA) and Portuguese
Catholics University (UCP). His main fields of interest are data acquisition and signal
processing.
M. Belsley obtained his PhD degree in physics from the University of Colorado
at Boulder in 1986. He then worked at the California State University in Long
Beach, Oxford University and the University of Oregon before coming to Minho
University in Braga Portugal where he has lectured as an associate professor of
physics since 1992. His main fields of interest are laser spectroscopy and nonlinear
optics.
R. Vasconcelos received her degree in textile engineering, in 1984 at Minho Univer-
sity, Portugal. In 1993 she obtained her PhD in engineering-textile technology and
chemistry on the speciality of textile technology, in Minho University. Since 2005 she
is working as associate professor, in the Textile Engineering Department of Minho
University. Her fields of interest are textile processes and industrial automation.
F. Soares received her degree in chemical engineering, in 1986 at Porto University,
Portugal. In 1997 she obtained her PhD in chemical engineering in Porto Univer-
sity. Since 2007 she is working as associate professor, in the Industrial Electronics
Department of Minho University. Her fields of interest are process modelling and
control and process automation.](https://image.slidesharecdn.com/sna7275-160608190509/85/Sna7275-6-320.jpg)

This document summarizes a study comparing the use of 1 mm resolution capacitive and optical sensors for determining yarn mass parameters. Capacitive sensors were used to measure yarn mass variations directly, while optical sensors measured yarn diameter and hairiness, from which mass could be inferred since diameter is highly correlated with mass. Results from signals processed from both sensor types on two cotton yarns showed that optical sensors alone can accurately characterize yarn properties like mass, reducing system costs and complexity.