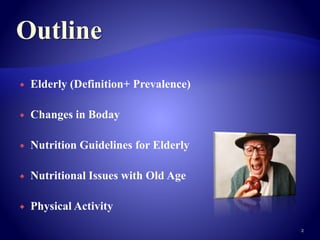
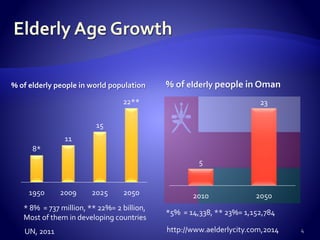
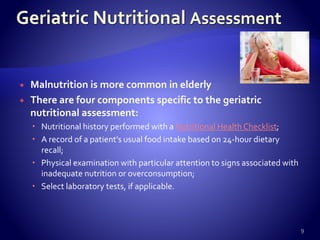
Jokha Al-Jassasi
Dietitian
1
 Elderly (Definition+ Prevalence)
 Changes in Boday
 Nutrition Guidelines for Elderly
 Nutritional Issues with Old Age
 Physical Activity
2
 +after 60 year
 A complex process for living organisms. During
the process of aging, the human body
accumulates damage at the molecular, cellular,
and organ levels, which results in diminished or
dysregulated function and increased risk of
disease and death. (Pae, M . 2012)
3
% of elderly people in world population % of elderly people in Oman
8*
11
15
22**
1950 2009 2025 2050
4
* 8% = 737 million, ** 22%= 2 billion,
Most of them in developing countries
UN, 2011
5
23
2010 2050
*5% = 14,338, ** 23%= 1,152,784
http://www.aelderlycity.com,2014
1. Sensory Changes
2. Physical changes
3. Oral Health
4. Gastrointestinal
5. Renal function
6. Neurologic Function
7. Pressure Ulcers
8. Hearing and Eyesight
9. Immune Function
5
senses of taste, smell and touch poor
appetite, inappropriate food choices
poor nutrient intake.
Change body composition ( protein and
fat), bone (women loss 40% during the first
5 year after menopause.
Tooth loss use of dentures and dry mouth
Reduce : taste, salive, gastric mucosa 
delayed gastric empting and infections
affect bioavailability of nutrients. e,.g :
vitamin B12.
- Constipation ?
fat
muscle
0%
10%
20%
30%
40%
50%
60%
70%
80%
90%
100%
20-29 40-49 60-69 70-79
%ofbodyweight
Age coteogery
Increase in fat tissue and reduction in muscle with aging
6
Findings:
 45% of elderly people in Nizwa were overweight or obese,
 Poor knowledge of nutrition
 12.3% aware of the value of milk in protecting against osteoporosis while only
1.7% knew it as a rich source of calcium.
 Only 7.3% of the total had heard about dietary fibrer.
 Significantly fewer women than men (29.4%versus 31.5%) (P = 0.004) were
aware that changes in dietary habits could help in prevention and control of
health problems.
 inadequate vegetables intake for 88.6% of the total sample (n=2041)
 Low levels of physical activity (only 17.8% do exercise >30 min/day)
Recommendations :
 Incorporated into the awareness and education programme of the
national strategy for “Active ageing and self care” proposed by the
Ministry of Health and the Ministry of SocialWelfare.
7
 To monitor signs of malnutrition as prevalence increases with
age.
 Provide nutrition for weight control, healthy appetite and
prevention of acute illness or complications of chronic diseases.
 Correct existing nutritional deficiencies
 Provide nutrition of proper consistency by status of dentition.
 Recommend intervention to combat digestive problems (e.g.
constipation)
 Ensure proper hydration
 Encourage physical activity and design plans for the elderly
patient
8
Objectives:
 Malnutrition is more common in elderly
 There are four components specific to the geriatric
nutritional assessment:
 Nutritional history performed with a Nutritional Health Checklist;
 A record of a patient's usual food intake based on 24-hour dietary
recall;
 Physical examination with particular attention to signs associated with
inadequate nutrition or overconsumption;
 Select laboratory tests, if applicable.
9
1. Anthropometric Measurements
Weight:
(body composition analyzers., measuring skin-fold thickness) ……not accurate
A better alternative is the mid-arm muscle circumference
which was found more sensitive to weight change.
Height :
Accurate measuring of height may be difficult for those who
cannot stand up straight, the bed bound, those with
osteoporosis and those with spinal deformations : ) Measuring
arm span or knee height may give more accurate results.
10
11
 (BMI) classifications were developed based on associations
between BMI and chronic disease and mortality risk in healthy
populations.
 According to Queensland Government:
in practice, it may be appropriate to adjust BMI classifications for
people aged ≥ 65 years to:
 Underweight <23 kg/m2,
 Healthy weight 24-30 kg/m2
 Overweight >30 kg/m
12
Ref: http://www.health.qld.gov.au/masters/copyright.asp
2. Diet History
Information can be inaccurate due to:
 limited recall,
 hearing and vision decline,
 change in attention span
 variation in dietary intake from day to day.
There are many methods that can be used to obtain
information:
food recall, diet records (can be kept by the caregiver) &
food frequency questionnaire.
13
14
Type Requirements Remarks
Energy Decrease about 3% per
decade.
should be calculated at
25-35 kcal/kg (ADA)
Depend on PA, health
condition
Protein 0.8-1g/kg Depend on health status
(mainly the renal)
Carbohydrates 45 – 65% of total calories A good sources for
energy, fiber vitamins
and minerals
Fats 30% of total calories 7% of them saturated
fat
Protein
 Recommended intake: 0.8-1g/kg to ensure adequate intake of
protein
 Excess protein could stress the kidneys.
 In cases of liver and renal impairments evaluate the case and
decrease as needed.
 In pressure ulcers, cancers and other cases that require extra
protein, increase as necessary
15
 The consistency of foods should be altered only if needed.
Maintenance of whole texture is important to enhance the
food appeal and increase chewing with saliva.
 adding herbs, spices and other condiments to enhance
flavor.
 Prevent excessive use of caffeine, three (6-9 oz size) cups
of coffee offer no health risk. However monitor for
anxiety, medications…etc
 Investigate alcohol use; excessive intake may result in
deficiencies of thiamin, vitamin B12, and zinc.
 Support intake of antioxidants to
protect the aging brain.
16
17
Older adults are at risk of vitamin
B12 deficiency because of :
1. low oral intake,
2. decrease in gastric acid which
aid the absorption of this
vitamin.
Recommendation:
Older adults should either consume
foods which are fortified with the
vitamins in its crystalline form or
given supplementation.
The recommended amount is 2.5
µ/daily.
18
Deficiency because of:
1. the skin of older adults does not synthesize
vitamin D as efficiently
2. the kidneys ability to convert vitamin D to its
active hormone form starts to decline.
Recommended intake: 10-20 µ/daily (400-800
IU/day)
19
 May play a part in lowering homoccysteine levels
which is a possible risk marker for
atherothromobosis, alzheimer's diseases and
parkinson's diseases.
 Therefore supplementation is necessary,
 But it should be noted that its important to monitor
B12 levels when doing so.
 An amount of 400 µ/day has showed to achieve a
healthy homocysteine levels.
20
 Zinc: low zinc intake is associated with impaired
immune function, anorexia, loss of sense of
taste, delayed wound healing and pressure ulcer
development.
 Selenium: based on the available data it appears
that 50-70 µ/day of selenium is more than
enough to meet the needs of older adults.
21
22
Nutrient Food source
Vitamin D Fortified breakfast cereals, Sardines, Tuna, Eggs, Liver,
Margarine
Vitamin A Liver, Carrots, Spinach, Sweet potatoes, Red, peppers,
Mango, Dried apricots, Apricots (fresh), Tomatoes, Cabbage,
Broccoli, Margarine, Butter, Cheese, Kidney, Eggs,
Honeydew melon, Prunes, Orange, Sweetcorn, Peas, Whole
milk
Vitamin C Orange , Guava, Green and red peppers (raw), Broccoli,
Cabbage, Cauliflower, Spinach, Tomato Kiwi, Mango,
Grapefruit, Potatoes, Green beans, Peas, Apples, Peaches,
papaya, strawberries, parsley, citrus fruits
Vitamin K Safflower oil, eggs, yogurt, oatmeal, beef liver, green leafy
vegetables, cauliflower, fish, soy oil, alfalfa, tomatoes
Folate Fortified breakfast cereal, spinach, yeast extract, cabbage,
broccoli, peas, melon, kidney, wholemeal flour, beef,
tomatoes, potatoes, peanuts
23
Iron Kidney, Liver, Beef, Lamb, Sardines, Chick peas, Lentils, Spinach,
Broccoli, Dried, apricots, Raisins, Fortified breakfast cereals, Whole
meal flour/bread
Potassium Roast potatoes, dried fruits cereal, milk, banana, tomatoes juice, melon, orange
juice, coffee, tomatoes, meat, fish, fruits and vegetables, bread
Calcium Milk and its products, Spinach, Okra, Soy beans, sardines, salmon, Foods that
are calcium fortified, such as some orange juice, oatmeal, and breakfast cereal
Copper Liver, oysters, calamari, sesame seeds, cocoa powder, nuts, sunflower seeds,
pumpkin seeds, mushrooms, asparagus
Zinc Liver, kidney, lean meat, poultry, canned sardines, shrimp and prawns, whole
grain breakfast cereal, nuts, tuna, eggs, milk, cheese, beans, lentils, brown
bread, sesame seeds
Selenium Fish, eggs, mustard seeds, mushrooms, chicken, sunflower seeds, oysters,
shrimps, wheat germ, barley, onions
Fiber Whole grains, whole breakfast cereals, wholemeal bread, baked beans, kidney
beans, lentils, dried apricots, dried figs, dried prunes, sweet corn, green leafy
vegetables, okra, dried dates, brown rice, cabbage
Iron Potassium
Zinc Calcium
Selenium Fiber
Elderly are at increased risk of dehydration
due to:
 Change in kidney function
 blunt thirst sensation
 delirium and dementia
 medication adverse reaction and mobility disorders
Adequate water intake is 1ml/kcal energy consumed
or 25-30 ml/kg weight for most individuals 24
25
 Offer small amounts of food often , every 2-3 hours
 Make use of snacks between meals, crackers , cheese,
biscuits, milk drinks
 If patient is not diagnosed with chronic diseases, you
can use the following techniques: sugar in beverages,
full cream dairy products, add to cream to soups and
porridges
 provide mainly high-energy and/or high protein foods
26
 Consuming 5-6 small meals could be more tolerated,
than eating the same amount in three meals. Make
sure that meals/snacks are nutrients dense
 Poor appetite could be induced by depression, consult
the psychiatric to assess the patient
 Avoid giving the patient non-nutritive beverages such
as coffee
 Offer drinks after food rather than along with it
 Make food look attractive
27
 Avoid food that cause heartburn such as, highly
seasoned, greasy or fried foods
 Distribute meals throughout the day 5-6 meals
 Stress to the patient that he should remain seated or
standing for at least two hours after a meal
 If the patient is bed ridden , then make sure his upper
body is raised at 45 degrees angle
 Make the last meal several hours before going to bed.
28
 Try to increase fiber intake and encourage the patient to consume more
fluids.
 Introduce fiber containing food gradually to avoid bowel discomfort
and distention.
 Advise the patient to drink something hot as the first beverage in the
morning, such as hot water, coffee, tea as hot liquids might stimulate a
bowel movement
 Activity such as walking helps normalize bowel function.
29
Constipation happen in older adults due to:
 Reduced mobility,
 low intake of fluids,
 poor diet and inadequate intake of fiber.
Regular exercise
has been shown to
provide many
health benefits to
the older adults.
 Includes weight
management,
 Improvement in
BP, BG levels,
lipid profile,
 Osteoarthritis
 Mental health.
30
31
Your diet today…
your health tomorrow
SCORING
 0 to 2 =You have good nutrition. Recheck your nutritional score in six months.
 3 to 5 =You are at moderate nutritional risk, and you should see what you can do to improve your
eating
 habits and lifestyle. Recheck your nutritional score in three months.
32

Elderly nutrition 2016

  • 1.
  • 2.
     Elderly (Definition+Prevalence)  Changes in Boday  Nutrition Guidelines for Elderly  Nutritional Issues with Old Age  Physical Activity 2
  • 3.
     +after 60year  A complex process for living organisms. During the process of aging, the human body accumulates damage at the molecular, cellular, and organ levels, which results in diminished or dysregulated function and increased risk of disease and death. (Pae, M . 2012) 3
  • 4.
    % of elderlypeople in world population % of elderly people in Oman 8* 11 15 22** 1950 2009 2025 2050 4 * 8% = 737 million, ** 22%= 2 billion, Most of them in developing countries UN, 2011 5 23 2010 2050 *5% = 14,338, ** 23%= 1,152,784 http://www.aelderlycity.com,2014
  • 5.
    1. Sensory Changes 2.Physical changes 3. Oral Health 4. Gastrointestinal 5. Renal function 6. Neurologic Function 7. Pressure Ulcers 8. Hearing and Eyesight 9. Immune Function 5 senses of taste, smell and touch poor appetite, inappropriate food choices poor nutrient intake. Change body composition ( protein and fat), bone (women loss 40% during the first 5 year after menopause. Tooth loss use of dentures and dry mouth Reduce : taste, salive, gastric mucosa  delayed gastric empting and infections affect bioavailability of nutrients. e,.g : vitamin B12. - Constipation ?
  • 6.
    fat muscle 0% 10% 20% 30% 40% 50% 60% 70% 80% 90% 100% 20-29 40-49 60-6970-79 %ofbodyweight Age coteogery Increase in fat tissue and reduction in muscle with aging 6
  • 7.
    Findings:  45% ofelderly people in Nizwa were overweight or obese,  Poor knowledge of nutrition  12.3% aware of the value of milk in protecting against osteoporosis while only 1.7% knew it as a rich source of calcium.  Only 7.3% of the total had heard about dietary fibrer.  Significantly fewer women than men (29.4%versus 31.5%) (P = 0.004) were aware that changes in dietary habits could help in prevention and control of health problems.  inadequate vegetables intake for 88.6% of the total sample (n=2041)  Low levels of physical activity (only 17.8% do exercise >30 min/day) Recommendations :  Incorporated into the awareness and education programme of the national strategy for “Active ageing and self care” proposed by the Ministry of Health and the Ministry of SocialWelfare. 7
  • 8.
     To monitorsigns of malnutrition as prevalence increases with age.  Provide nutrition for weight control, healthy appetite and prevention of acute illness or complications of chronic diseases.  Correct existing nutritional deficiencies  Provide nutrition of proper consistency by status of dentition.  Recommend intervention to combat digestive problems (e.g. constipation)  Ensure proper hydration  Encourage physical activity and design plans for the elderly patient 8 Objectives:
  • 9.
     Malnutrition ismore common in elderly  There are four components specific to the geriatric nutritional assessment:  Nutritional history performed with a Nutritional Health Checklist;  A record of a patient's usual food intake based on 24-hour dietary recall;  Physical examination with particular attention to signs associated with inadequate nutrition or overconsumption;  Select laboratory tests, if applicable. 9
  • 10.
    1. Anthropometric Measurements Weight: (bodycomposition analyzers., measuring skin-fold thickness) ……not accurate A better alternative is the mid-arm muscle circumference which was found more sensitive to weight change. Height : Accurate measuring of height may be difficult for those who cannot stand up straight, the bed bound, those with osteoporosis and those with spinal deformations : ) Measuring arm span or knee height may give more accurate results. 10
  • 11.
  • 12.
     (BMI) classificationswere developed based on associations between BMI and chronic disease and mortality risk in healthy populations.  According to Queensland Government: in practice, it may be appropriate to adjust BMI classifications for people aged ≥ 65 years to:  Underweight <23 kg/m2,  Healthy weight 24-30 kg/m2  Overweight >30 kg/m 12 Ref: http://www.health.qld.gov.au/masters/copyright.asp
  • 13.
    2. Diet History Informationcan be inaccurate due to:  limited recall,  hearing and vision decline,  change in attention span  variation in dietary intake from day to day. There are many methods that can be used to obtain information: food recall, diet records (can be kept by the caregiver) & food frequency questionnaire. 13
  • 14.
    14 Type Requirements Remarks EnergyDecrease about 3% per decade. should be calculated at 25-35 kcal/kg (ADA) Depend on PA, health condition Protein 0.8-1g/kg Depend on health status (mainly the renal) Carbohydrates 45 – 65% of total calories A good sources for energy, fiber vitamins and minerals Fats 30% of total calories 7% of them saturated fat
  • 15.
    Protein  Recommended intake:0.8-1g/kg to ensure adequate intake of protein  Excess protein could stress the kidneys.  In cases of liver and renal impairments evaluate the case and decrease as needed.  In pressure ulcers, cancers and other cases that require extra protein, increase as necessary 15
  • 16.
     The consistencyof foods should be altered only if needed. Maintenance of whole texture is important to enhance the food appeal and increase chewing with saliva.  adding herbs, spices and other condiments to enhance flavor.  Prevent excessive use of caffeine, three (6-9 oz size) cups of coffee offer no health risk. However monitor for anxiety, medications…etc  Investigate alcohol use; excessive intake may result in deficiencies of thiamin, vitamin B12, and zinc.  Support intake of antioxidants to protect the aging brain. 16
  • 17.
  • 18.
    Older adults areat risk of vitamin B12 deficiency because of : 1. low oral intake, 2. decrease in gastric acid which aid the absorption of this vitamin. Recommendation: Older adults should either consume foods which are fortified with the vitamins in its crystalline form or given supplementation. The recommended amount is 2.5 µ/daily. 18
  • 19.
    Deficiency because of: 1.the skin of older adults does not synthesize vitamin D as efficiently 2. the kidneys ability to convert vitamin D to its active hormone form starts to decline. Recommended intake: 10-20 µ/daily (400-800 IU/day) 19
  • 20.
     May playa part in lowering homoccysteine levels which is a possible risk marker for atherothromobosis, alzheimer's diseases and parkinson's diseases.  Therefore supplementation is necessary,  But it should be noted that its important to monitor B12 levels when doing so.  An amount of 400 µ/day has showed to achieve a healthy homocysteine levels. 20
  • 21.
     Zinc: lowzinc intake is associated with impaired immune function, anorexia, loss of sense of taste, delayed wound healing and pressure ulcer development.  Selenium: based on the available data it appears that 50-70 µ/day of selenium is more than enough to meet the needs of older adults. 21
  • 22.
    22 Nutrient Food source VitaminD Fortified breakfast cereals, Sardines, Tuna, Eggs, Liver, Margarine Vitamin A Liver, Carrots, Spinach, Sweet potatoes, Red, peppers, Mango, Dried apricots, Apricots (fresh), Tomatoes, Cabbage, Broccoli, Margarine, Butter, Cheese, Kidney, Eggs, Honeydew melon, Prunes, Orange, Sweetcorn, Peas, Whole milk Vitamin C Orange , Guava, Green and red peppers (raw), Broccoli, Cabbage, Cauliflower, Spinach, Tomato Kiwi, Mango, Grapefruit, Potatoes, Green beans, Peas, Apples, Peaches, papaya, strawberries, parsley, citrus fruits Vitamin K Safflower oil, eggs, yogurt, oatmeal, beef liver, green leafy vegetables, cauliflower, fish, soy oil, alfalfa, tomatoes Folate Fortified breakfast cereal, spinach, yeast extract, cabbage, broccoli, peas, melon, kidney, wholemeal flour, beef, tomatoes, potatoes, peanuts
  • 23.
    23 Iron Kidney, Liver,Beef, Lamb, Sardines, Chick peas, Lentils, Spinach, Broccoli, Dried, apricots, Raisins, Fortified breakfast cereals, Whole meal flour/bread Potassium Roast potatoes, dried fruits cereal, milk, banana, tomatoes juice, melon, orange juice, coffee, tomatoes, meat, fish, fruits and vegetables, bread Calcium Milk and its products, Spinach, Okra, Soy beans, sardines, salmon, Foods that are calcium fortified, such as some orange juice, oatmeal, and breakfast cereal Copper Liver, oysters, calamari, sesame seeds, cocoa powder, nuts, sunflower seeds, pumpkin seeds, mushrooms, asparagus Zinc Liver, kidney, lean meat, poultry, canned sardines, shrimp and prawns, whole grain breakfast cereal, nuts, tuna, eggs, milk, cheese, beans, lentils, brown bread, sesame seeds Selenium Fish, eggs, mustard seeds, mushrooms, chicken, sunflower seeds, oysters, shrimps, wheat germ, barley, onions Fiber Whole grains, whole breakfast cereals, wholemeal bread, baked beans, kidney beans, lentils, dried apricots, dried figs, dried prunes, sweet corn, green leafy vegetables, okra, dried dates, brown rice, cabbage Iron Potassium Zinc Calcium Selenium Fiber
  • 24.
    Elderly are atincreased risk of dehydration due to:  Change in kidney function  blunt thirst sensation  delirium and dementia  medication adverse reaction and mobility disorders Adequate water intake is 1ml/kcal energy consumed or 25-30 ml/kg weight for most individuals 24
  • 25.
  • 26.
     Offer smallamounts of food often , every 2-3 hours  Make use of snacks between meals, crackers , cheese, biscuits, milk drinks  If patient is not diagnosed with chronic diseases, you can use the following techniques: sugar in beverages, full cream dairy products, add to cream to soups and porridges  provide mainly high-energy and/or high protein foods 26
  • 27.
     Consuming 5-6small meals could be more tolerated, than eating the same amount in three meals. Make sure that meals/snacks are nutrients dense  Poor appetite could be induced by depression, consult the psychiatric to assess the patient  Avoid giving the patient non-nutritive beverages such as coffee  Offer drinks after food rather than along with it  Make food look attractive 27
  • 28.
     Avoid foodthat cause heartburn such as, highly seasoned, greasy or fried foods  Distribute meals throughout the day 5-6 meals  Stress to the patient that he should remain seated or standing for at least two hours after a meal  If the patient is bed ridden , then make sure his upper body is raised at 45 degrees angle  Make the last meal several hours before going to bed. 28
  • 29.
     Try toincrease fiber intake and encourage the patient to consume more fluids.  Introduce fiber containing food gradually to avoid bowel discomfort and distention.  Advise the patient to drink something hot as the first beverage in the morning, such as hot water, coffee, tea as hot liquids might stimulate a bowel movement  Activity such as walking helps normalize bowel function. 29 Constipation happen in older adults due to:  Reduced mobility,  low intake of fluids,  poor diet and inadequate intake of fiber.
  • 30.
    Regular exercise has beenshown to provide many health benefits to the older adults.  Includes weight management,  Improvement in BP, BG levels, lipid profile,  Osteoarthritis  Mental health. 30
  • 31.
  • 32.
    SCORING  0 to2 =You have good nutrition. Recheck your nutritional score in six months.  3 to 5 =You are at moderate nutritional risk, and you should see what you can do to improve your eating  habits and lifestyle. Recheck your nutritional score in three months. 32

Editor's Notes

  • #6 كل هذه التغيرات تؤثر على الاحتياجات الغذائية للمسنين وعلىعمليات الهضم والامتصاص والتمثيل الغذائي وهناك العديد من الدراسات تشير إلى أن الرعاية الغذائية الجيدة للفرد في مرحلة الشيخوخة تؤدي إلى تحسين الحالة النفسية والعقلية والجسدية والصحية لهم. Older adults are more likely to become constipated. Primary reasons include, insufficient fluids intake, lack of physical activity and low intake of fiber. It can be also due to delay in transit time in the gut and medication. Diarrhea is also common in adults, and can be attributed to diverticulosis.
  • #8 Ref: Directorate of Research and Studies, Directorate General of Planning, Ministry of Health, Muscat, Oman (Correspondence to A. Al Riyami: asyariyami@gmail.com). 2 Directorate of Health Services, Al Dakhliya Region, Nizwa, Oman. Received: 28/10/08; accepted: 12/01/09
  • #11 With aging fat mass increases and height decreases as a result of vertebral compression. Accurate measuring of height may be difficult for those who cannot stand up straight, the bed bound, those with osteoporosis and those with spinal deformations. Measuring arm span or knee height may give more accurate results. Using body composition analyzers may also be ineffective. Also measuring skin-fold thickness and mid-arm circumference is limited due to inability to distinguish between fat and muscles, as a result of increased incompressibility and decreased elasticity of older skin. A better alternative is the mid-arm muscle circumference which was found more sensitive to weight change. Dietitian should use more than one indicator to classify overweight or obesity in the older adults. This is due to the potential limitation of each indicator in the older adults.
  • #13 Using BMI in older adults ≥ 65 years There are no existing evidence-based practice guidelines to assist clinicians in classifying BMI for elderly populations. However, there is strong emerging evidence that WHO cut-offs may not be appropriate in increasing age. Recent meta-analysis of 32 cohort studies4 (level II and III, n=197940) of community-dwelling elderly people aged ≥65 years found a U-shaped association between all-cause mortality, with mortality risk lowest at BMI 24 – 31 kg/m2. This relationship remained when adjusting for smoking status, early death, pre-existing disease and geographical location. Therefore, in practice, it may be appropriate to adjust BMI classifications for people aged ≥ 65 years to: • Underweight 23 kg/m, Healthy weight 24-30 kg/m2, Overweight >30 kg/m2. CAUTION: Intentional weight loss should only be considered for elderly people on an individual basis with careful attention to maintenance of lean mass (particularly where co-morbidities are present which may compromise nutritional status and/or muscle mass). The above recommendations are supported by the Australia & New Zealand Society for Geriatric Medicine8 .
  • #15 Protein Because of the general decline in kidneys function, excess protein could stress the kidneys. In cases of liver and renal impairments evaluate the case and decrease as needed. In pressure ulcers, cancers and other cases that require extra protein, increase as necessary. The institute of medicine recommends an intake of 0.8-1g/kg to ensure adequate intake of protein. Other literatures suggest an intake of 0.9-1.1 g/kg per day.
  • #25 Lean mass reduction impact the percentage of water in the body. It can diminish from 60-50% of body weight. Dehydration in older adults can be caused by decreased fluid intake, decreased kidney function or increased losses. Fluid intake of minimum of 1500 ml/day will ensure proper hydration. Elderly are at increased risk if dehydration because of impaired sense of thirst, fear of incontinence and depends on others for oral intake. The risk of dehydration increases due to: kidney inability to concentrate urine blunt thirst sensation decreased rennin activity and aldosterone secretion relative renal resistance to vasopressin changes in functional status delirium and dementia medication adverse reaction and mobility disorders Adequate water intake, 1ml/kcal energy consumed or 25-30 ml/kg weight for most individuals
  • #31 Researches show that resistance training improves strength of muscles. Aerobic exercise: At least 30 minutes of aerobic exercise (such as walking and swimming) on most days if not all Strength training: 2-3 days a week with a day rest between workouts
  • #33 NOTE: The Nutritional Health Checklist was developed for the Nutrition Screening Initiative. Read the statements above, and circle the number in the “yes” column for each statement that applies to you. Add up the circled numbers to get your nutritional score. SCORING 0 to 2 = You have good nutrition. Recheck your nutritional score in six months. 3 to 5 = You are at moderate nutritional risk, and you should see what you can do to improve your eating habits and lifestyle. Recheck your nutritional score in three months. 6 or more = You are at high nutritional risk, and you should bring this checklist with you the next time you see your physician, dietitian, or other qualified health care professional. Talk with any of these professionals about the problems you may have. Ask for help to improve your nutritional status. 5/8/2016 about:blank about:blank 2/2 Adapted with permission from The clinical and costeffectiveness of medical nutrition therapies: evidence and estimates of potential medical savings from the use of selected nutritional intervention. June 1996. Summary report prepared for the Nutrition Screening Initiative, a project of the American Academy of Family Physicians, the American Dietetic Association, and the National Council on the Aging, Inc