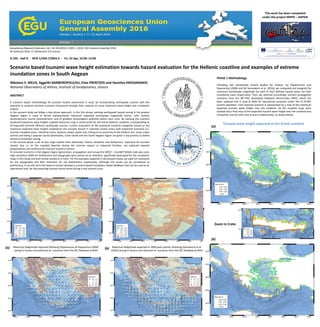
This study evaluates tsunami hazard for the Hellenic coastline through scenario-based modeling of expected maximum wave heights and detailed inundation modeling for four coastal cities. Existing earthquake hazard maps were used to define representative magnitude earthquake scenarios from the region. Modeling of these scenarios produced maximum wave height maps for the coastline. Case studies of the 365 AD earthquake were used to model detailed inundation for Chania, Rethymno, Heraklion, and Kalamata cities, identifying zones at risk. High resolution topographic and bathymetric data were used to produce inundation maps within the MOST/ComMIT modeling framework to inform coastal resilience and preparedness.
Assessment of landslide susceptibility using geospatial analysis and interfer...Pavlos Krassakis
The main purpose of the current study, was to examine the assessment of landslide susceptibility in the mountainous Municipalities of Nafpaktia and Karpenisi (Central Greece) by using geospatial analysis via RES (Rock Engineering System) and interferometry data.
International Journal of Engineering Research and Applications (IJERA) is an open access online peer reviewed international journal that publishes research and review articles in the fields of Computer Science, Neural Networks, Electrical Engineering, Software Engineering, Information Technology, Mechanical Engineering, Chemical Engineering, Plastic Engineering, Food Technology, Textile Engineering, Nano Technology & science, Power Electronics, Electronics & Communication Engineering, Computational mathematics, Image processing, Civil Engineering, Structural Engineering, Environmental Engineering, VLSI Testing & Low Power VLSI Design etc.
Flooding is one of the most devastating natural
disasters in Nigeria. The impact of flooding on human activities
cannot be overemphasized. It can threaten human lives, their
property, environment and the economy. Different techniques
exist to manage and analyze the impact of flooding. Some of these
techniques have not been effective in management of flood
disaster. Remote sensing technique presents itself as an effective
and efficient means of managing flood disaster. In this study,
SPOT-10 image was used to perform land cover/ land use
classification of the study area. Advanced Space borne Thermal
Emission and Reflection Radiometer (ASTER) image of 2010 was
used to generate the Digital Elevation Model (DEM). The image
focal statistics were generated using the Spatial Analyst/
Neighborhood/Focal Statistics Tool in ArcMap. The contour map
was produced using the Spatial Analyst/ Surface/ Contour Tools.
The DEM generated from the focal statistics was reclassified into
different risk levels based on variation of elevation values. The
depression in the DEM was filled and used to create the flow
direction map. The flow accumulation map was produced using
the flow direction data as input image. The stream network and
watershed were equally generated and the stream vectorized. The
reclassified DEM, stream network and vectorized land cover
classes were integrated and used to analyze the impact of flood on
the classes. The result shows that 27.86% of the area studied will
be affected at very high risk flood level, 35.63% at high risk,
17.90% at moderate risk, 10.72% at low risk, and 7.89% at no
risk flood level. Built up area class will be mostly affected at very
high risk flood level while farmland will be affected at high risk
flood level. Oshoro, Imhekpeme, and Weppa communities will be
affected at very high risk flood inundation while Ivighe, Uneme,
Igoide and Iviari communities will be at risk at high risk flood
inundation level. It is recommended among others that buildings
that fall within the “Very High Risk” area should be identified
and occupants possibly relocated to other areas such as the “No
Risk” area.
Ninety percent of major earthquakes of the world directly indicating the sources of subduction and collision zones with shallow, intermediate, and deep focus earthquakes. The state of Sabah not indicating a high seismic risk zone and not directly associated with the Ring of fire. Nevertheless, it is positive towards seismic risk as the state experienced more than 65 earthquakes. However, no attention of researchers on comparative analysis of PGA map recorded in literature. Therefore, this study conducted; 1) to analyze the earthquake hazard and active tectonics of Sabah using PGA map derived from three methods and; 2) to understand the intersection of faults that can create isoseismic elongation. More than 90% of earthquakes are shallow and focused at a hypo-central distance of (0 ~ 100) km as resulted from this research. Therefore, Sabah had been experienced a highest magnitude of ~6.3, which can create the maximum PGA values of ~ (0.075, 0.06 and 0.08) based on three different attenuation equations proposed in this study. These earthquakes can produce a maximum intensity of (MMI~7) that is derived from the resulted PGA values. The study on active tectonics explains about the major 12 active faults and their intersection relationship. Therefore, this whole study has been conducted based on three attenuation relation to find out the best method for preparing the PGA map and the stereo net plotting using an integrated GIS technique.
Greetings to all,
The Global Ocean Data Assimilation Experiment (GODAE) final symposium will be held in Nice in November 12-15 2008. This
project has been a precursor to a world wide experiment to demonstrate the feasibility of global ocean observing systems using
state of the art assimilation techniques. Today, several teams are working on operational ocean systems to provide forecast and
description of the ocean, using increasingly complex assimilation schemes and high resolution models. As we saw in the last
newsletter, these systems have reached the coast and routinely provide real time ocean forecast. But they need input information
for their boundaries and initialisation fields, from regional, basin wide or global configurations.
This month, the Newsletter is dedicated to global ocean systems resulting from the GODAE project.
In the first news feature, a review of the GODAE achievements in ocean observing systems is made by Le Traon et al. In a
second introduction paper, Pierre Bahurel provides a “Global view on MyOcean” where he introduces the special ongoing efforts
to improve products and services to users.
Four systems from three countries (U.S., France and Japan) are then presented, showing a variety of developments, model
resolutions and assimilation schemes that are all facing the same challenges: to describe, understand and forecast the world
ocean. The first contribution is from Chassignet et Hurlburt and is dedicated to the U.S. HYCOM 1/12° global configuration.
Menemenlis et al. will then tell us how useful the ECCO2 system is in understanding and estimating ocean processes.
Legalloudec et al. follow with the 1/12° Mercator g lobal model and its ability to represent the mesoscale activity. Finally, Kamachi
et al. will present the MRI global systems, including two nesting configurations dedicated to several applications from climate
variability to boundary forcing or ocean weather.
The next newsletter will be published in January 2009 and dedicated to the Mediterranean Sea.
We wish you a pleasant reading.
This is a proposal which I have submitted to the USGS Earthquake Hazard Program during my stay in Canada, but it did not work since I have been informed that the research area should be focussed over the San Andreas Fault.
Role of Geologists in Natural Hazard Mapping and Application_Dr Kyi Khin_MGSS...KYI KHIN
Every year, natural hazard events threaten lives and livelihoods, resulting in deaths and billions of dollars in damage. Many geoscientists and various institutions are working with many partners to monitor, assess, and conduct targeted research on a wide range of natural hazards so that policymakers and the public have the understanding to enhance preparedness, response and resilience. For planning and risk assessment to tackle the Natural Hazards for public awareness, alarming and evacuation, Hazard Maps are essentially needed for institutions and governmental working committees of Natural Disaster Prevention, in future.
Remote Sensing Method for Flood Management SystemIJMREMJournal
Flood occurred when heavy and continuous rainfall exceeding the absorptive capacity of soil and the flow
capacity of rivers, streams, and coastal areas. Land areas that are most subjected to floods are areas situated
adjacent to rivers and streams, that are known as floodplain and therefore considered as “flood-prone”. These
areas are hazardous to development activities if the vulnerability of those activities exceeds an acceptable level.
The main objectives of this study are; to identify floodplains and other susceptible areas, and to assess the
extent of disaster impact in the study area which is located at Kota Tinggi, Johor, Malaysia. This area
experienced an unprecedented flood during December of 2006 to January of 2007.Questions such as how often
and how long the floodplain will be covered by water, and at what time of year flooding can be expected need to
be answered. Thus, an understanding of the dynamic nature of floodplains is greatly required. Multi-temporal
Radarsat-1images, Landsat ETM+ image, topographical maps and land use maps were used in this study for
the purpose of delineating the flood extend before, during and after the flood event. DEM acquired from
topographic map is used to derive flood depth. The final outputs of this study are flood extent and flood depth
maps where both of these maps show the impact of the flood to environment, lives and properties. This map is
also important and can be applied to develop a comprehensive relief effort immediately after flooding.
Geomorphology and GIS Analysis for Mapping Gully Erosion Susceptibility in Ta...ijtsrd
This study aim at performing geomorphological and GIS Analysis to map gully erosion susceptibility in Taraba State. GIS and Remote sensing integrated with Erodibility Variables Soil, Landuse and Erosivity Variables Elevation Aspect, plan Curvature, Stream Power index SPI , Topographic Wetness Index TWI , Length Slope Factor LSF were used in mapping gully erosion susceptibility. All Erosive Variables were automatically derived from SRTM DEM http earthexplorer.usgs.gov and were analyzed using 3D Analyst and Spatial Analyst Extensions of ArcGIS 10.1. The result shows that 2 are of very High Susceptibility, 33 High Susceptibility, 37 Moderate Susceptibility and 28 Low no Susceptibility. Idakwo Victor Iko-Ojo | Mark Ma’aku Joshua | Idakwo Francis Akoji "Geomorphology and GIS Analysis for Mapping Gully Erosion Susceptibility in Taraba State, Nigeria" Published in International Journal of Trend in Scientific Research and Development (ijtsrd), ISSN: 2456-6470, Volume-4 | Issue-5 , August 2020, URL: https://www.ijtsrd.com/papers/ijtsrd33136.pdf Paper Url :https://www.ijtsrd.com/humanities-and-the-arts/geography/33136/geomorphology-and-gis-analysis-for-mapping-gully-erosion-susceptibility-in-taraba-state-nigeria/idakwo-victor-ikoojo
Sviluppo ed applicazione del sistema modellistico MINNI dell’ENEA per ricostruire la qualità dell'aria a scala nazionale ed europea - Mihaela Mircea - ENEA
A Land Data Assimilation System Utilizing Low Frequency Passive Microwave Rem...drboon
To address the gap in bridging global and smaller modelling scales, downscaling approaches have been reported as an appropriate solution. Downscaling on its own is not wholly adequate in the quest to produce local phenomena, and in this paper we use a physical downscaling method combined with data assimilation strategies, to obtain physically consistent land surface condition prediction. Using data assimilation strategies, it has been demonstrated that by minimizing a cost function, a solution utilizing imperfect models and observation data including observation errors is feasible. We demonstrate that by assimilating lower frequency passive microwave brightness temperature data using a validated theoretical radiative transfer model, we can obtain very good predictions that agree well with observed conditions.
Hv uav multispectral compared to hyperspectral finalTerraLab srl
Assessing the robustness of Vegetation Indices (VIs) to estimate Durum Wheat grown (precision agriculture).
Comparing satellite remote sensing (multispectral reflectance) and hyperspectral measurements (first year)
Comparing UAV multispectral vs field hyperspectral data collection (second year)
Working in progress for environmental applications
Estimating the Probability of Earthquake Occurrence and Return Period Using G...sajjalp
In this paper, the frequency of an earthquake occurrence and magnitude relationship
has been modeled with generalized linear models for the set of
earthquake data of Nepal. A goodness of fit of a statistical model is applied for
generalized linear models and considering the model selection information
criterion, Akaike information criterion and Bayesian information criterion,
generalized Poisson regression model has been selected as a suitable model
for the study. The objective of this study is to determine the parameters (a
and b values), estimate the probability of an earthquake occurrence and its
return period using a Poisson regression model and compared with the Gutenberg-Richter
model. The study suggests that the probabilities of earthquake
occurrences and return periods estimated by both the models are relatively
close to each other. The return periods from the generalized Poisson
regression model are comparatively smaller than the Gutenberg-Richter
model.
International Journal of Computational Engineering Research(IJCER) is an intentional online Journal in English monthly publishing journal. This Journal publish original research work that contributes significantly to further the scientific knowledge in engineering and Technology
DSD-INT 2018 Input bathymetry as a source of uncertainty of a coastal early w...Deltares
Presentation by Silvia Unguendoli, Arpae SIMC Emilia-Romagna, Italy at the XBeach User Day 2018, during Delft Software Days - Edition 2018. Thursday, 15 November 2018, Delft.
NONLINEAR AUTOREGRESSIVE NETWORK WITH THE USE OF A MOVING AVERAGE METHOD FOR ...ijaia
Forecasting of a typhoon moving path may help to evaluate the potential negative impacts in the neighbourhood areas along the moving path. This study proposed a work of using both static and dynamic neural network models to link a time series of typhoon track parameters including longitude and latitude of the typhoon central location, cyclonic radius, central wind speed, and typhoon moving speed. Based on the historical records of 100 typhoons, the performances of neural network models are evaluated from the
indices of a correlation coefficient and a mean square error. The dynamic model or the so-called nonlinear autoregressive network with the use of a moving average method proved to forecast the ten types of typhoon moving path more effectively in Taiwan region. The new and simply approach developed in this study for solving studied typhoon cases may be applicable to other areas of interest worldwide..
SIMULATION OF TSUNAMI AT EAST COAST OF PENINSULAR MALAYSIA DUE TO THE EARTHQU...IAEME Publication
This study assessed the impact of tsunami waves simulated to propagate towards South China Sea before reaching the coastlines of east coast Peninsular Malaysia with earthquake source from Manila Trench. The latest set of fault parameters developed in year 2014 incorporating the worst-case scenario of Mw=9.3 were used to generate tsunami from Manila Trench using TUNA-M2. With the study domain set at a rectangle bounded by 100˚E to 125˚E longitude, 0˚N to 25˚N latitude, grid dimensions of 1851×1851 (km) and grid size of 1500 meters, findings from this study showed that the state of Kelantan will experience the highest wave height at 1.96 m followed by Terengganu (1.55m), Pahang (0.65m) and Johor (0.56m). Since Pahang and Johor are expected to experience low wave height, it can be concluded that coast line of these states is not subjected to critical wave height whereas coastal areas of Kelantan and Terengganu are identified as hazardous areas during the propagation phase of a tsunami event. These waves are expected to reach coastal areas of Pahang at 10hr after the earthquake triggered at Manila Trench. This will then be followed by Johor, Terengganu, and Kelantan at 2 hours later.
SIMULATION OF TSUNAMI AT EAST COAST OF PENINSULAR MALAYSIA DUE TO THE EARTHQU...IAEME Publication
This study assessed the impact of tsunami waves simulated to propagate towards
South China Sea before reaching the coastlines of east coast Peninsular Malaysia
with earthquake source from Manila Trench. The latest set of fault parameters
developed in year 2014 incorporating the worst-case scenario of Mw=9.3 were used
to generate tsunami from Manila Trench using TUNA-M2. With the study domain set
at a rectangle bounded by 100˚E to 125˚E longitude, 0˚N to 25˚N latitude, grid
dimensions of 1851×1851 (km) and grid size of 1500 meters, findings from this study
showed that the state of Kelantan will experience the highest wave height at 1.96 m
followed by Terengganu (1.55m), Pahang (0.65m) and Johor (0.56m). Since Pahang
and Johor are expected to experience low wave height, it can be concluded that coast
Hurricanes and Global Warming- Dr. Kerry EmanuelJohn Atkeison
Dr. Kerry Emanuel explains how Global Warming increased the power of hurricanes. Hurricane Katrina is discussed, with the conclusion that Katrina probably would not have had the power to break the New Orleans levees in a pre-Global Warming world. April 2009 webinar presented by the Southern Allicance for Clean Energy (http://www.cleanenergy.org/) and the Gulf Restoration Network (http://healthygulf.org/) SlideCast by John Atkeison of the Alliance for Affordable Energy. There is a very small amount of phone noise.
Comparison of machine learning performance for earthquake prediction in Indon...TELKOMNIKA JOURNAL
Indonesia resides on most earthquake region with more than 100 active volcanoes,
and high number of seismic activities per year. In order to reduce the casualty, some
method to predict earthquake have been developed to estimate the seismic movement.
However, most prediction use only short term of historical data to predict the incoming
earthquake, which has limitation on model performance. This work uses medium
to long term earthquake historical data that were collected from 2 local government
bodies and 8 legitimate international sources. We make an estimation of a mediumto-
long term prediction via machine learning algorithms, which are multinomial
logistic regression, support vector machine and Na¨ıve Bayes, and compares their
performance. This work shows that the support vector machine outperforms other
method. We compare the root mean square error computation results that lead us into
how concentrated data is around the line of best fit, where the multinomial logistic
regression is 0.777, Na¨ıve Bayes is 0.922 and support vector machine is 0.751.
In predicting future earthquake, support vector machine outperforms other two
methods that produce significant distance and magnitude to current earthquake report.
2. PHASE 2 Methodology
The MOST/ComMIT NOAA code and GUI interface
is used to simulate tsunami propagation and
estimate inundation zones, for the four largest
cities in the South Aegean region (Chania,
Rethimnon, Heraklion, Kalamata).
The largest known, reported and studied
earthquake event in the Eastern Mediterranean
was selected (365AD west of Crete with
considered magnitude Mw=8.5), as a key example
for our study.
High resolution DEMS were joined with 5m
resolution in topography and 30m in bathymetry,
respectively.
The results were further processed via a GIS tool
interface and inundation maps were produced for
the four selected cities.
For the Heraklion city inundation maps focused on
areas with public and tourist interest were
produced. They were used in a workshop-exercise
with local civil protection agencies, under the
leading coordination of the Department of Civil
Protection of the Decentralized Administration of
Crete.
For further information and queries please contact: nmelis@noa.gr
This work has been completed
under the project KRIPIS – ASPIDA
In Phase 2 of our study, we considered the 365AD earthquake event that devastated the East Mediterranean Basin (Shaw et al., 2008) as the example to apply the
methodology (seismic/tsunami source, tsunami propagation, coastal impact). This most extensively studied event regarding modelling, synthetics and field data justification
investigations was selected. We prepared using MOST (Initial Conditions (left) and Maximum Wave Height Propagation for the selected source (right)). The latter is the input
for the MOST/ComMIT platform with the GUI interface as a user friendly tool.
REFERENCES
Annunziato, A. (2007). The Tsunami Assessment Modelling System by the Joint Research Centre. Science of Tsunami Hazards, 26:2, 70–92.
Gica, E., Spillane, M., Titov, V.V., Chamberlin, C.D., and Newman, J.C. (2008), Development of the forecast propagation database for NOAA’s Short-term Inundation Forecast for
Tsunamis (SIFT), NOAA Tech. Memo. OAR PMEL-139, NTIS: PB2008-109391, 89 pp.
Mitsoudis, D. A., E. T. Flouri, N. Chrysoulakis, Y. Kamarianakis, E. A. Okal, C. E. Synolakis, (2012). Tsunami hazard in the southeast Aegean Sea, Coastal Engineering, 60, 136–148.
Necmioglu, O. and Ozel, N. M. (2015). Earthquake Scenario-Based Tsunami Wave Heights in the Eastern Mediterranean and Connected Seas, Pure Appl. Geophys., DOI
10.1007/s00024-015-1069-y.
Okada, Y. (1985) Surface deformation due to shear and tensile faults in a half-space, Bull. Seism. Soc. Am., 75, 1435-1154.
Papaioannou, Ch. A. and B. C. Papazachos, (2000). Time-Independent and Time-Dependent Seismic Hazard in Greece Based on Seismogenic Sources, Bulletin of the
Seismological Society of America, 90, 1, 22–33.
Shaw, B., Ambraseys, N. N., England, P. C., Floyd, M. A., Gorman, G. J, Higham, T. F. G., Jackson, J. A., Nocquet, J.-M., Pain, C. C., and Piggot, M. D. (2008). Eastern Mediterranean
tectonics and tsunami hazard inferred from the AD 365 earthquake; Nature Geoscience Vol. 1 April 2008.
Synolakis, C.E., E.N. Bernard, V.V. Titov, U. Kânoğlu, and F.I. González (2007): Standards, criteria, and procedures for NOAA evaluation of tsunami numerical models. NOAA Tech.
Memo. OAR PMEL-135, NOAA/Pacific Marine Environmental Laboratory, SeaUle, WA, 55 pp.
Titov, V.V. and Gonzalez, F.I. (1997). Implementation and testing of the method of splitting tsunami (MOST), NOAA Technical Memorandum ERL-PMEL-112, PB98-122773, Pacific
Marine Environmental Laboratory, Seattle, Washington, 11 pp.
Titov, V.V. and Synolakis, C.E. (1998). Numerical modeling of tidal wave runup, J. Waterw. Port Ocean Coast. Eng. 124(4), 157–171.
Titov, V., Moore, C., Greenslade, D., Pattiaratchi, C., Badal, R., Synolakis, C., and Kanoglu, U. (2011). A New Tool for Inundation Modeling: Community Modeling Interface for
Tsunamis (ComMIT), Pure Appl. Geophys., doi:10.1007/s00024-011-0292-4.
Vamvakaris, D.A., C. B., Papazachos, C., Papaioannou, E. M. Scordilis, and G. F. Karakaisis, (2016). A detailed seismic zonation model for shallow earthquakes in the broader
Aegean area, Nat. Hazards Earth Syst. Sci., 16, 55-84, www.nat-hazards-earth-syst-sci.net/16/55/2016/, doi:10.5194/nhess-16-55-2016.
Defined Inundation Zones
at Heraklion:
west end of the city (right),
hotel / beach coastal zone
west of the city (below)
Rethimnon Kalamata
Zoom at the city of Kalamata
Heraklion
Chania
location map of selected sites and the 365AD epicenter
[ the case as it has been processed with ComMIT GUI interface in Windows (some representative screen dumps) ]
[ for these cases, the results with ComMIT (inundation zones)
are presented after some basic GIS reprocessing ]