Download as PDF, PPTX


![1313
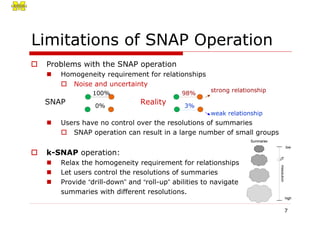
Effectiveness: DB Coauthorship
DBLP Database Coauthorship Graph
(7,445 nodes, 19,971 edges)
Node Attributes:
name (string), numPub (int), prolific (LP, P, HP)
LP:[1, 5], P:[6, 20], HP:[21, -]
Relationship: coauthorship
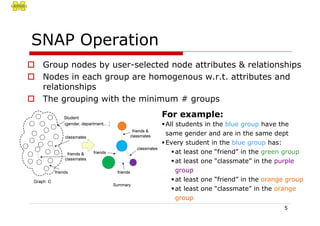
SNAP
Attribute: prolific
Relationship: coauthorship
3,569 groups,
11,293 group relationships](https://image.slidesharecdn.com/efficientaggregationforgraphsummarization-researcher-170826065507/85/Efficient-aggregation-for-graph-summarization-13-320.jpg)


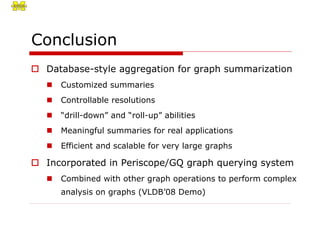


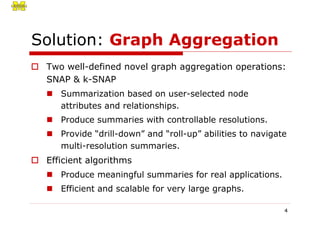
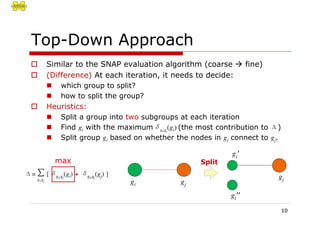
The document proposes two novel graph aggregation operations, SNAP and k-SNAP, to efficiently summarize large graphs. SNAP groups nodes that are homogeneous in attributes and relationships, while k-SNAP allows users to specify the number of groups k and relaxes relationship homogeneity. Experimental results on real and synthetic graphs demonstrate that k-SNAP produces meaningful multi-resolution summaries and the top-down evaluation approach is more efficient than the bottom-up approach, especially for smaller k values.


![[Paper Review] GAIN: Missing Data Imputation using Generative Adversarial Net...](https://cdn.slidesharecdn.com/ss_thumbnails/gainpaperreviewbyjihoo-200414070017-thumbnail.jpg?width=640&height=640&fit=bounds)


![Wasserstein 1031 thesis [Chung il kim]](https://cdn.slidesharecdn.com/ss_thumbnails/chungilkim1031thesis-171027082513-thumbnail.jpg?width=640&height=640&fit=bounds)