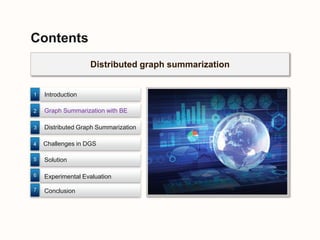
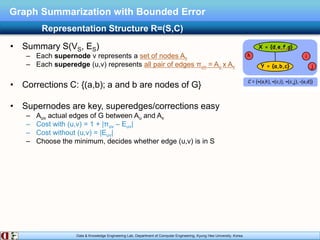
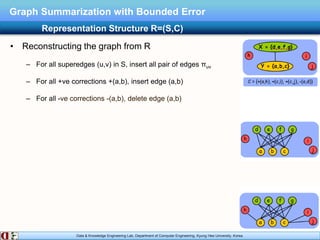
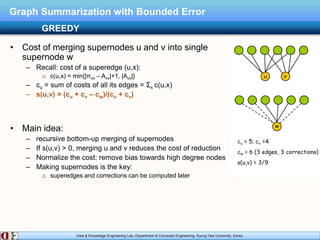
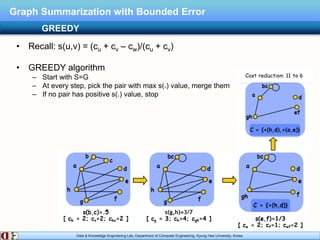
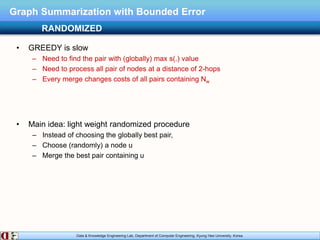
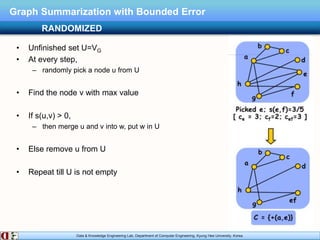
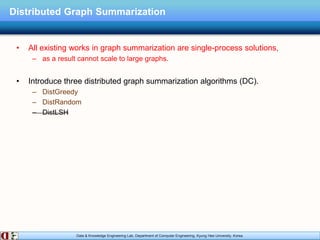
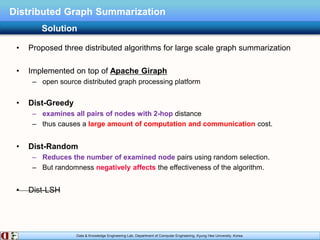
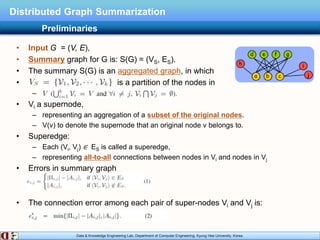
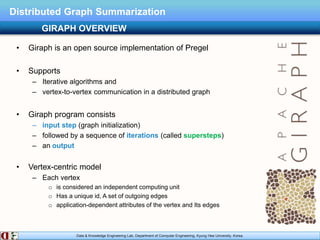
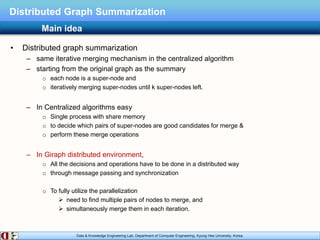
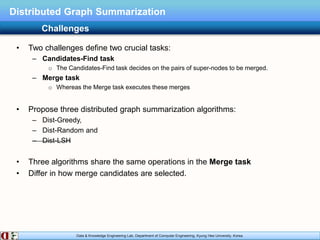
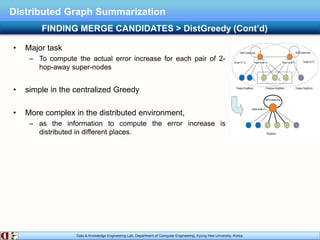
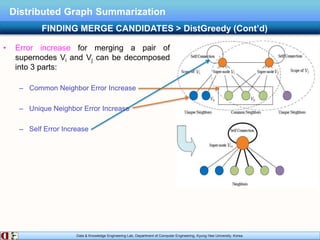
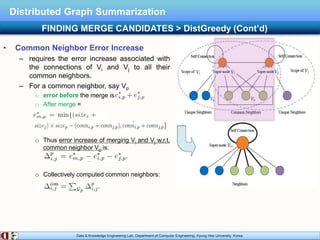
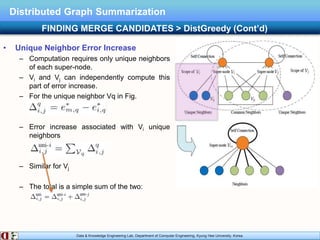
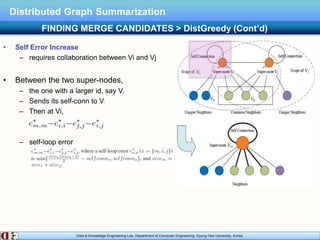
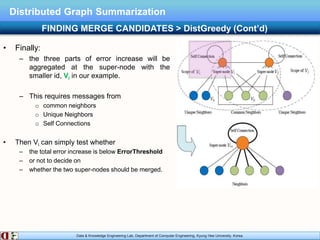
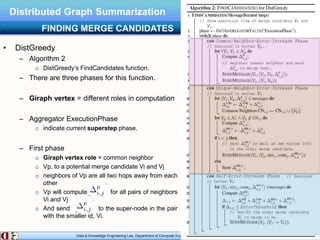
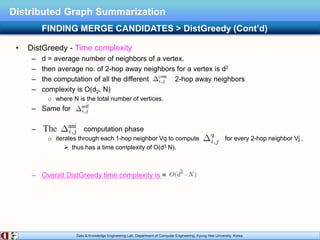
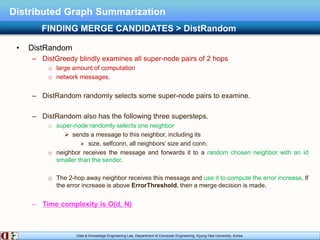
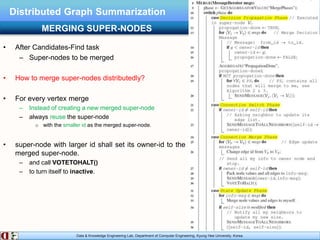
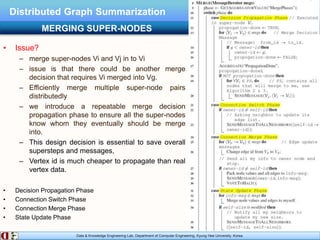
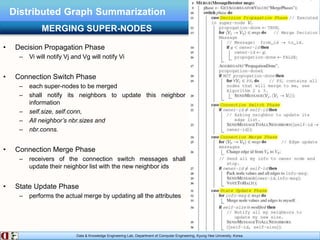
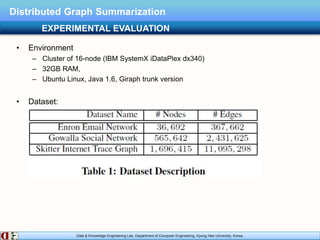
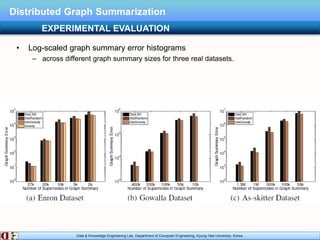
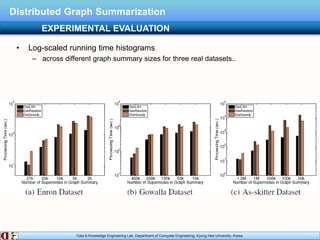
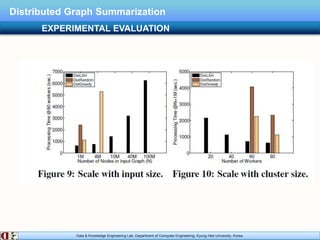
The document describes research on distributed graph summarization algorithms. It introduces three distributed graph summarization algorithms (DistGreedy, DistRandom, DistLSH) that can scale to large graphs by distributing computation across machines. The algorithms share a common framework of iteratively merging super-nodes representing aggregated subsets of nodes, but differ in how they select candidate pairs of super-nodes to merge. Experimental evaluation on real-world graphs demonstrates the ability of the proposed distributed algorithms to summarize large graphs in a parallelized manner.
Digital image processing the statistical and structural approaches and the graph based approach for image recognition with algorithms and examples and applications where graph matching is used in pattern recognition.
MONOGENIC SCALE SPACE BASED REGION COVARIANCE MATRIX DESCRIPTOR FOR FACE RECO...cscpconf
In this paper, we have presented a new face recognition algorithm based on region covariance
matrix (RCM) descriptor computed in monogenic scale space. In the proposed model, energy
information obtained using monogenic filter is used to represent a pixel at different scales to
form region covariance matrix descriptor for each face image during training phase. An eigenvalue
based distance measure is used to compute the similarity between face images. Extensive
experimentation on AT&T and YALE face database has been conducted to reveal the
performance of the monogenic scale space based region covariance matrix method and
comparative analysis is made with the basic RCM method and Gabor based region covariance matrix method to exhibit the superiority of the proposed technique.
Contour Line Tracing Algorithm for Digital Topographic MapsCSCJournals
Topographic maps contain information related to roads, contours, landmarks land covers and rivers etc. For any Remote sensing and GIS based project, creating a database using digitization techniques is a tedious and time consuming process especially for contour tracing. Contour line is very important information that these maps provide. They are mainly used for determining slope of the landforms or rivers. These contour lines are also used for generating Digital Elevation Model (DEM) for 3D surface generation from any satellite imagery or aerial photographs. This paper suggests an algorithm that can be used for tracing contour lines automatically from contour maps extracted from the topographical sheets and creating a database. In our approach, we have proposed a modified Moore's Neighbor contour tracing algorithm to trace all contours in the given topographic maps. The proposed approach is tested on several topographic maps and provides satisfactory results and takes less time to trace the contour lines compared with other existing algorithms.
A study and implementation of the transit route network design problem for a ...csandit
The design of public transportation networks presup
poses solving optimization problems,
involving various parameters such as the proper mat
hematical description of networks, the
algorithmic approach to apply, and also the conside
ration of real-world, practical
characteristics such as the types of vehicles in th
e network, the frequencies of routes, demand,
possible limitations of route capacities, travel de
cisions made by passengers, the environmental
footprint of the system, the available bus technolo
gies, besides others. The current paper
presents the progress of the work that aims to stud
y the design of a municipal public
transportation system that employs middleware techn
ologies and geographic information
services in order to produce practical, realistic r
esults. The system employs novel optimization
approaches such as the particle swarm algorithms an
d also considers various environmental
parameters such as the use of electric vehicles and
the emissions of conventional ones.
Brief introduction to graph based pattern recognition. It shows advantages and disantavantages of using graphs and how existing pattern recognition techniques are adapted to graph space.
Design and Implementation of Mobile Map Application for Finding Shortest Dire...Eswar Publications
The shortest path problem is an approach towards finding the shortest and quickest path or route from a starting point to a final destination, four major algorithms are peculiar to solving the shortest path problem. The algorithms include Dijkstra’s Algorithm, Floyd-Warshall Algorithm, Bellman-Ford Algorithm and Alternative Path Algorithm. This research work is focused on the design of mobile map application for finding the shortest
route from one location to another within Yaba College of Technology and its environ. The design was focused on
Dijkstra’s algorithm that source node as a first permanent node, and assign it 0 cost and check all neighbor nodes
from the previous permanent node and calculate the cumulative cost of each neighbor nodes and make them
temporary, then chooses the node with the smallest cumulative cost, and make it as a permanent node. The different nodes that lead to a particular destination were identified, the distance and time from a source to a destination is calculated using the Google map. The application then recommends the shortest and quickest route to the destination.
AN IMPLEMENTATION OF ADAPTIVE PROPAGATION-BASED COLOR SAMPLING FOR IMAGE MATT...ijiert bestjournal
Natural image matting refers to the problem of an e xtracting the region of interest such as foreground object from an image based on the user i nputs like scribbles or trimap. The proposed algorithm combines propagation and color s ampling methods. Unlike previous propagation-based approaches that used either local or non local propagation method,the proposed framework adaptively uses both local and n on local processes according to the detection result of the different region in the ima ge. The proposed color sampling strategy,which is based on the characteristic of super pixel uses a simple sample selection criterion and requires significantly less computational cost. Proposed method used another method to convert original image to trimap image,which is ba sed on selection process. That use roipoly tool to select a polygonal region of interest withi n the image,it can use as a mask for masked filtering. In which used the Chan-Vese algorithm fo r image segmentation
ESWC2015 - Tutorial on Publishing and Interlinking Linked Geospatial DataKostis Kyzirakos
In this tutorial we present the life cycle of linked geospatial data and we focus on two important steps: the publication of geospatial data as RDF graphs and interlinking them with each other. Given the proliferation of geospatial information on the Web many kinds of geospatial data are now becoming available as linked datasets (e.g., Google and Bing maps, user-generated geospatial content, public sector information published as open data etc.). The topic of the tutorial is related to all core research areas of the Semantic Web (e.g., semantic information extraction, transformation of data into RDF graphs, interlinking linked data etc.) since there is often a need to re-consider existing core techniques when we deal with geospatial information. Thus, it is timely to train Semantic Web researchers, especially the ones that are in the early stages of their careers, on the state of the art of this area and invite them to contribute to it.
In this tutorial we give a comprehensive background on data models, query languages, implemented systems for linked geospatial data, and we discuss recent approaches on publishing and interlinking geospatial data. The tutorial is complemented with a hands-on session that will familiarize the audience with the state-of-the-art tools in publishing and interlinking geospatial information.
http://event.cwi.nl/eswc2015-geo/
Improved algorithm for road region segmentation based on sequential monte car...csandit
In recent years, many researchers and car makers put a lot of intensive effort into development
of autonomous driving systems. Since visual information is the main modality used by human
driver, a camera mounted on moving platform is very important kind of sensor, and various
computer vision algorithms to handle vehicle surrounding situation are under intensive
research. Our final goal is to develop a vision based lane detection system with ability to
handle various types of road shapes, working on both structured and unstructured roads, ideally
under presence of shadows. This paper presents a modified road region segmentation algorithm
based on sequential Monte-Carlo estimation. Detailed description of the algorithm is given,
and evaluation results show that the proposed algorithm outperforms the segmentation
algorithm developed as a part of our previous work, as well as an conventional algorithm based
on colour histogram.
Geoid height determination is one of the major problems of geodesy because usage of satellite
techniques in geodesy isgetting increasing. Geoid heights can be determined using different methods according
to the available data. Soft computing methods such as Fuzzy logic and neural networks became so popular that
they are used to solve many engineering problems. Fuzzy logic theory and later developments in uncertainty
assessment have enabled us to develop more precise models for our requirements. In this study, How to
construct the best fuzzy model is examined. For this purpose, three different data sets were taken and two
different kinds (two inpust one output and three inputs one output) fuzzy model were formed for the calculation
of geoid heights in Istanbul (Turkey). The Fuzzy models results of these were compared with geoid heights
obtained by GPS/levelling methods. The fuzzy approximation models were tested on the test points.
TEXT EXTRACTION FROM RASTER MAPS USING COLOR SPACE QUANTIZATIONcsandit
Maps convey valuable information by relating names to their positions. In this paper we present
a new method for text extraction from raster maps using color space quantization. Previously,
most researches in this field were focused on Latin texts and the results for Persian or Arabic
texts were poor. In our proposed method we use a Mean-Shift algorithm with proper parameter
adjustment and consequently, we apply color transformation to make the maps ready for KMeans
algorithm which quantizes the colors in maps to six levels. By comparing to a threshold
the text layer candidates are then limited to three. The best layer can afterwards be chosen by
user. This method is independent of font size, direction and the color of the text and can find
both Latin and Persian/Arabic texts in maps. Experimental results show a significant
improvement in Persian text extraction.
One fundamental problem in large scale image retrieval with the bag-of-features is its lack of spatial information, which affects accuracy of image retrieval. Depending on distribution of local features in an image, we propose a novel adaptive Hilbert-scan strategy which computes weight of each path at increasingly fine resolutions. Owing to merits of this strategy, spatial information of object will be preserved more precisely at Hilbert order. Extensive experiments on Caltech-256 show that our method obtains higher accuracy.
From Data to Knowledge thru Grailog Visualizationgiurca
Visualization of Data & Knowledge: Graphs Remove Entry Barrier to Logic: From 1-dimensional symbol-logic knowledge specification to 2-dimensional graph-logic visualization in a systematic 2D syntax; Supports human in the loop across knowledge elicitation, specification, validation, and reasoning; Combinable with graph transformation, (‘associative’) indexing & parallel processing for efficient implementation of specifications
Image hashing is an efficient way to handle digital data authentication problem. Image hashing represents quality summarization of image features in compact manner. In this paper, the modified center symmetric local binary pattern (CSLBP) image hashing algorithm is proposed. Unlike CSLBP 16 bin histogram, Modified CSLBP generates 8 bin histogram without compromise on quality to generate compact hash. It has been found that, uniform quantization on a histogram with more bin results in more precision loss. To overcome quantization loss, modified CSLBP generates the two histogram of a four bin. Uniform quantization on a 4 bin histogram results in less precision loss than a 16 bin histogram. The first generated histogram represents the nearest neighbours and second one is for the diagonal neighbours. To enhance quality in terms of discrimination power, different weight factor are used during histogram generation. For the nearest and the diagonal neighbours, two local weight factors are used. One is the Standard Deviation (SD) and other is the Laplacian of Gaussian (LoG). Standard deviation represents a spread of data which captures local variation from mean. LoG is a second order derivative edge detection operator which detects edges well in presence of noise. The proposed algorithm is resilient to the various kinds of attacks. The proposed method is tested on database having malicious and non-malicious images using benchmark like NHD and ROC which confirms theoretical analysis. The experimental results shows good performance of the proposed method for various attacks despite the short hash length.
8th TUC Meeting | Lijun Chang (University of New South Wales). Efficient Subg...LDBC council
Lijun Chang, DECRA Fellow at the University of New South Wales talked about how to make subgraph matching more efficient thanks to postponing Cartesian products.
Parallel Batch-Dynamic Graphs: Algorithms and Lower BoundsSubhajit Sahu
Highlighted notes on Parallel Batch-Dynamic Graphs: Algorithms and Lower Bounds.
While doing research work under Prof. Kishore Kothapalli.
Laxman Dhulipala, David Durfee, Janardhan Kulkarni, Richard Peng, Saurabh Sawlani, Xiaorui Sun:
Parallel Batch-Dynamic Graphs: Algorithms and Lower Bounds. SODA 2020: 1300-1319
In this paper we study the problem of dynamically maintaining graph properties under batches of edge insertions and deletions in the massively parallel model of computation. In this setting, the graph is stored on a number of machines, each having space strongly sublinear with respect to the number of vertices, that is, n for some constant 0 < < 1. Our goal is to handle batches of updates and queries where the data for each batch fits onto one machine in constant rounds of parallel computation, as well as to reduce the total communication between the machines. This objective corresponds to the gradual buildup of databases over time, while the goal of obtaining constant rounds of communication for problems in the static setting has been elusive for problems as simple as undirected graph connectivity. We give an algorithm for dynamic graph connectivity in this setting with constant communication rounds and communication cost almost linear in terms of the batch size. Our techniques combine a new graph contraction technique, an independent random sample extractor from correlated samples, as well as distributed data structures supporting parallel updates and queries in batches. We also illustrate the power of dynamic algorithms in the MPC model by showing that the batched version of the adaptive connectivity problem is P-complete in the centralized setting, but sub-linear sized batches can be handled in a constant number of rounds. Due to the wide applicability of our approaches, we believe it represents a practically-motivated workaround to the current difficulties in designing more efficient massively parallel static graph algorithms.
Parallel Batch-Dynamic Graphs: Algorithms and Lower BoundsSubhajit Sahu
In this paper we study the problem of dynamically
maintaining graph properties under batches of edge
insertions and deletions in the massively parallel model
of computation. In this setting, the graph is stored
on a number of machines, each having space strongly
sublinear with respect to the number of vertices, that
is, n
for some constant 0 < < 1. Our goal is to
handle batches of updates and queries where the data
for each batch fits onto one machine in constant rounds
of parallel computation, as well as to reduce the total
communication between the machines. This objective
corresponds to the gradual buildup of databases over
time, while the goal of obtaining constant rounds of
communication for problems in the static setting has
been elusive for problems as simple as undirected graph
connectivity.
We give an algorithm for dynamic graph connectivity
in this setting with constant communication rounds and
communication cost almost linear in terms of the batch
size. Our techniques combine a new graph contraction
technique, an independent random sample extractor from
correlated samples, as well as distributed data structures
supporting parallel updates and queries in batches.
We also illustrate the power of dynamic algorithms in
the MPC model by showing that the batched version
of the adaptive connectivity problem is P-complete in
the centralized setting, but sub-linear sized batches can
be handled in a constant number of rounds. Due to
the wide applicability of our approaches, we believe
it represents a practically-motivated workaround to the
current difficulties in designing more efficient massively
parallel static graph algorithms.
The graph theory, which studies the properties of the graphs, has been widely
accepted as a core subject in the knowledge of computer science. In this paper, we
produced a method for developing an algorithm. The effectiveness of testing is the most
important factor for determining the cost and the duration of the development of the
large software products with a given quality, so the cost of testing for detecting errors
in the software reaches 30-40% of the total cost of its development and largely
determines its quality. The most commonly used of the testing methods are regression,
function, load, module, and optimization test if the graph is sufficiently complex. The
graph accelerates the testing process. We see the ways that we need to test. When they
cover all graph paths, the algorithm of the program is fully tested and does not need
any further development.
Leveraging Multiple GPUs and CPUs for Graphlet Counting in Large Networks Ryan Rossi
Massively parallel architectures such as the GPU are becoming increasingly important due to the recent proliferation of data. In this paper, we propose a key class of hybrid parallel graphlet algorithms that leverages multiple CPUs and GPUs simultaneously for computing k-vertex induced subgraph statistics (called graphlets). In addition to the hybrid multi-core CPU-GPU framework, we also investigate single GPU methods (using multiple cores) and multi-GPU methods that leverage all available GPUs simultaneously for computing induced subgraph statistics. Both methods leverage GPU devices only, whereas the hybrid multi-core CPU-GPU framework leverages all available multi-core CPUs and multiple GPUs for computing graphlets in large networks. Compared to recent approaches, our methods are orders of magnitude faster, while also more cost effective enjoying superior performance per capita and per watt. In particular, the methods are up to 300+ times faster than a recent state-of-the-art method. To the best of our knowledge, this is the first work to leverage multiple CPUs and GPUs simultaneously for computing induced subgraph statistics.
Explore the innovative world of trenchless pipe repair with our comprehensive guide, "The Benefits and Techniques of Trenchless Pipe Repair." This document delves into the modern methods of repairing underground pipes without the need for extensive excavation, highlighting the numerous advantages and the latest techniques used in the industry.
Learn about the cost savings, reduced environmental impact, and minimal disruption associated with trenchless technology. Discover detailed explanations of popular techniques such as pipe bursting, cured-in-place pipe (CIPP) lining, and directional drilling. Understand how these methods can be applied to various types of infrastructure, from residential plumbing to large-scale municipal systems.
Ideal for homeowners, contractors, engineers, and anyone interested in modern plumbing solutions, this guide provides valuable insights into why trenchless pipe repair is becoming the preferred choice for pipe rehabilitation. Stay informed about the latest advancements and best practices in the field.
Water scarcity is the lack of fresh water resources to meet the standard water demand. There are two type of water scarcity. One is physical. The other is economic water scarcity.
Immunizing Image Classifiers Against Localized Adversary Attacksgerogepatton
This paper addresses the vulnerability of deep learning models, particularly convolutional neural networks
(CNN)s, to adversarial attacks and presents a proactive training technique designed to counter them. We
introduce a novel volumization algorithm, which transforms 2D images into 3D volumetric representations.
When combined with 3D convolution and deep curriculum learning optimization (CLO), itsignificantly improves
the immunity of models against localized universal attacks by up to 40%. We evaluate our proposed approach
using contemporary CNN architectures and the modified Canadian Institute for Advanced Research (CIFAR-10
and CIFAR-100) and ImageNet Large Scale Visual Recognition Challenge (ILSVRC12) datasets, showcasing
accuracy improvements over previous techniques. The results indicate that the combination of the volumetric
input and curriculum learning holds significant promise for mitigating adversarial attacks without necessitating
adversary training.
Sachpazis:Terzaghi Bearing Capacity Estimation in simple terms with Calculati...Dr.Costas Sachpazis
Terzaghi's soil bearing capacity theory, developed by Karl Terzaghi, is a fundamental principle in geotechnical engineering used to determine the bearing capacity of shallow foundations. This theory provides a method to calculate the ultimate bearing capacity of soil, which is the maximum load per unit area that the soil can support without undergoing shear failure. The Calculation HTML Code included.
Hierarchical Digital Twin of a Naval Power SystemKerry Sado
A hierarchical digital twin of a Naval DC power system has been developed and experimentally verified. Similar to other state-of-the-art digital twins, this technology creates a digital replica of the physical system executed in real-time or faster, which can modify hardware controls. However, its advantage stems from distributing computational efforts by utilizing a hierarchical structure composed of lower-level digital twin blocks and a higher-level system digital twin. Each digital twin block is associated with a physical subsystem of the hardware and communicates with a singular system digital twin, which creates a system-level response. By extracting information from each level of the hierarchy, power system controls of the hardware were reconfigured autonomously. This hierarchical digital twin development offers several advantages over other digital twins, particularly in the field of naval power systems. The hierarchical structure allows for greater computational efficiency and scalability while the ability to autonomously reconfigure hardware controls offers increased flexibility and responsiveness. The hierarchical decomposition and models utilized were well aligned with the physical twin, as indicated by the maximum deviations between the developed digital twin hierarchy and the hardware.
Industrial Training at Shahjalal Fertilizer Company Limited (SFCL)MdTanvirMahtab2
This presentation is about the working procedure of Shahjalal Fertilizer Company Limited (SFCL). A Govt. owned Company of Bangladesh Chemical Industries Corporation under Ministry of Industries.
Hybrid optimization of pumped hydro system and solar- Engr. Abdul-Azeez.pdffxintegritypublishin
Advancements in technology unveil a myriad of electrical and electronic breakthroughs geared towards efficiently harnessing limited resources to meet human energy demands. The optimization of hybrid solar PV panels and pumped hydro energy supply systems plays a pivotal role in utilizing natural resources effectively. This initiative not only benefits humanity but also fosters environmental sustainability. The study investigated the design optimization of these hybrid systems, focusing on understanding solar radiation patterns, identifying geographical influences on solar radiation, formulating a mathematical model for system optimization, and determining the optimal configuration of PV panels and pumped hydro storage. Through a comparative analysis approach and eight weeks of data collection, the study addressed key research questions related to solar radiation patterns and optimal system design. The findings highlighted regions with heightened solar radiation levels, showcasing substantial potential for power generation and emphasizing the system's efficiency. Optimizing system design significantly boosted power generation, promoted renewable energy utilization, and enhanced energy storage capacity. The study underscored the benefits of optimizing hybrid solar PV panels and pumped hydro energy supply systems for sustainable energy usage. Optimizing the design of solar PV panels and pumped hydro energy supply systems as examined across diverse climatic conditions in a developing country, not only enhances power generation but also improves the integration of renewable energy sources and boosts energy storage capacities, particularly beneficial for less economically prosperous regions. Additionally, the study provides valuable insights for advancing energy research in economically viable areas. Recommendations included conducting site-specific assessments, utilizing advanced modeling tools, implementing regular maintenance protocols, and enhancing communication among system components.
1. Navlakha, et al. (2008, June)
Graph summarization with bounded error.
SIGMOD international conference on Management of data. ACM.
Khan, K. et al. (2015)
Set-based approximate approach for lossless graph summarization
Computing 97.12
Liu, X., et al. (2014, November)
Distributed graph summarization.
23rd International Conference on Conference on Information and KM. ACM.
Aftab Alam
12 Jun 2017
Department of Computer Engineering, Kyung Hee University
3. Data & Knowledge Engineering Lab, Department of Computer Engineering, Kyung Hee University, Korea.
Graph Summarization with Bounded Error
• Many interactions can be represented as graphs
– Webgraphs:
o search engine, etc.
– Social networks:
o mine user communities, viral marketing
– Email exchanges:
o security. virus spread, spam detection
– Market basket data:
o customer profiles, targeted advertising
– Netflow graphs
o (which IPs talk to each other):
o traffic patterns, security, worm attacks
• Need to compress, understand
– Webgraph ~ 50 billion edges;
social networks ~ few million, growing quickly
– Compression reduces size to one-tenth (webgraphs)
• Graph summarization is NP-hard
Large Graphs
SN
4. Data & Knowledge Engineering Lab, Department of Computer Engineering, Kyung Hee University, Korea.
Graph Summarization with Bounded Error
Out Approach
• Graph Compression (reference encoding)
– Not applicable to all graphs: use urls, node labels for compression
– Resulting structure is hard to visualize/interpret
• Graph Clustering
– Nice summary, works for generic graphs
– No compression: needs the same memory to store the graph itself
• MDL-based representation R = (S,C)
– S is a high-level summary graph:
o compact, highlights dominant trends, easy to visualize
– C is a set of edge corrections:
o help in reconstructing the graph
– Compression based on MDL principle:
o minimize cost of S+C
information-theoretic approach; parameter less; applicable to any graph
– Novel Approximate Representation:
o reconstructs graph with bounded error (є);
o results in better compression
5. Data & Knowledge Engineering Lab, Department of Computer Engineering, Kyung Hee University, Korea.
Graph Summarization with Bounded Error
How do we compress?
• Compression possible (S)
– Many nodes with similar neighborhoods
o Communities in social networks
o link-copying in webpages
– Collapse
o such nodes into supernodes
o and the edges into superedges
o Bipartite subgraph to two supernodes and a superedge
o Clique to supernode with a “self-edge”
6. Data & Knowledge Engineering Lab, Department of Computer Engineering, Kyung Hee University, Korea.
Graph Summarization with Bounded Error
• Need to correct mistakes (C)
– Most superedges are not complete
o Nodes don’t have exact same neighbors:
friends in social networks
– Remember edge-corrections
o Edges not present in superedges
(-ve corrections)
o Extra edges not counted in superedges
(+ve corrections)
• Minimize overall storage cost = S+C
How do we compress?
7. Data & Knowledge Engineering Lab, Department of Computer Engineering, Kyung Hee University, Korea.
Graph Summarization with Bounded Error
• Summary S(VS, ES)
– Each supernode v represents a set of nodes Av
– Each superedge (u,v) represents all pair of edges πuv = Au x Av
• Corrections C: {(a,b); a and b are nodes of G}
• Supernodes are key, superedges/corrections easy
– Auv actual edges of G between Au and Av
– Cost with (u,v) = 1 + |πuv – Euv|
– Cost without (u,v) = |Euv|
– Choose the minimum, decides whether edge (u,v) is in S
Representation Structure R=(S,C)
8. Data & Knowledge Engineering Lab, Department of Computer Engineering, Kyung Hee University, Korea.
Graph Summarization with Bounded Error
• Reconstructing the graph from R
– For all superedges (u,v) in S, insert all pair of edges πuv
– For all +ve corrections +(a,b), insert edge (a,b)
– For all -ve corrections -(a,b), delete edge (a,b)
Representation Structure R=(S,C)
9. Data & Knowledge Engineering Lab, Department of Computer Engineering, Kyung Hee University, Korea.
Graph Summarization with Bounded Error
• Compressed graph
– MDL representation R=(S,C); є-representation
• Computing R=(S,C)
– GREEDY
– RANDOMIZED
Outline
10. Data & Knowledge Engineering Lab, Department of Computer Engineering, Kyung Hee University, Korea.
Graph Summarization with Bounded Error
• Cost of merging supernodes u and v into single
supernode w
– Recall: cost of a superedge (u,x):
o c(u,x) = min{|πvx – Avx|+1, |Avx|}
– cu = sum of costs of all its edges = Σx c(u,x)
– s(u,v) = (cu + cv – cw)/(cu + cv)
• Main idea:
– recursive bottom-up merging of supernodes
– If s(u,v) > 0, merging u and v reduces the cost of reduction
– Normalize the cost: remove bias towards high degree nodes
– Making supernodes is the key:
o superedges and corrections can be computed later
GREEDY
11. Data & Knowledge Engineering Lab, Department of Computer Engineering, Kyung Hee University, Korea.
Graph Summarization with Bounded Error
• Recall: s(u,v) = (cu + cv – cw)/(cu + cv)
• GREEDY algorithm
– Start with S=G
– At every step, pick the pair with max s(.) value, merge them
– If no pair has positive s(.) value, stop
GREEDY
12. Data & Knowledge Engineering Lab, Department of Computer Engineering, Kyung Hee University, Korea.
Graph Summarization with Bounded Error
• GREEDY is slow
– Need to find the pair with (globally) max s(.) value
– Need to process all pair of nodes at a distance of 2-hops
– Every merge changes costs of all pairs containing Nw
• Main idea: light weight randomized procedure
– Instead of choosing the globally best pair,
– Choose (randomly) a node u
– Merge the best pair containing u
RANDOMIZED
13. Data & Knowledge Engineering Lab, Department of Computer Engineering, Kyung Hee University, Korea.
Graph Summarization with Bounded Error
• Unfinished set U=VG
• At every step,
– randomly pick a node u from U
• Find the node v with max value
• If s(u,v) > 0,
– then merge u and v into w, put w in U
• Else remove u from U
• Repeat till U is not empty
RANDOMIZED
14. Data & Knowledge Engineering Lab, Department of Computer Engineering, Kyung Hee University, Korea.
Graph Summarization with Bounded Error
• CNR:
– web-graph dataset
• Routeview:
– autonomous systems topology of the internet
• Wordnet:
– English words, edges between related words (synonym, similar, etc.)
• Facebook:
– social networking
Experimental set-up
15. Data & Knowledge Engineering Lab, Department of Computer Engineering, Kyung Hee University, Korea.
Graph Summarization with Bounded Error
Cost Reduction (CNR dataset)
16. Data & Knowledge Engineering Lab, Department of Computer Engineering, Kyung Hee University, Korea.
Graph Summarization with Bounded Error
Comparison with other schemes & Cost Breakup
80% cost of representation
is due to corrections
The proposed techniques give much
better compression
17. Data & Knowledge Engineering Lab, Department of Computer Engineering, Kyung Hee University, Korea.
Distributed Graph Summarization
• All existing works in graph summarization are single-process solutions,
– as a result cannot scale to large graphs.
• Introduce three distributed graph summarization algorithms (DC).
– DistGreedy
– DistRandom
– DistLSH
18. Data & Knowledge Engineering Lab, Department of Computer Engineering, Kyung Hee University, Korea.
Distributed Graph Summarization
• Nodes and edges are distributed in different machines
– requires message passing and
– careful coordination across multiple node
• Fully distributed graph summarization to achieve better parallelization
– should fully distribute computation across different machines for efficient
parallelization.
• Minimizing computation and communication costs
– smart techniques are needed to avoid unnecessary communication & computation
Challenges in Distributed Summarization
19. Data & Knowledge Engineering Lab, Department of Computer Engineering, Kyung Hee University, Korea.
Distributed Graph Summarization
• Proposed three distributed algorithms for large scale graph summarization
• Implemented on top of Apache Giraph
– open source distributed graph processing platform
• Dist-Greedy
– examines all pairs of nodes with 2-hop distance
– thus causes a large amount of computation and communication cost.
• Dist-Random
– Reduces the number of examined node pairs using random selection.
– But randomness negatively affects the effectiveness of the algorithm.
• Dist-LSH
Solution
20. Data & Knowledge Engineering Lab, Department of Computer Engineering, Kyung Hee University, Korea.
Distributed Graph Summarization
• Input G = (V, E),
• Summary graph for G is: S(G) = (VS, ES).
• The summary S(G) is an aggregated graph, in which
• is a partition of the nodes in
–
• Vi a supernode,
– representing an aggregation of a subset of the original nodes.
– V(v) to denote the supernode that an original node v belongs to.
• Superedge:
– Each (Vi, Vj) ∈ ES is called a superedge,
– representing all-to-all connections between nodes in Vi and nodes in Vj
• Errors in summary graph
• The connection error among each pair of super-nodes Vi and Vj is:
Preliminaries
21. Data & Knowledge Engineering Lab, Department of Computer Engineering, Kyung Hee University, Korea.
Distributed Graph Summarization
• Given a graph G
– and a desired number of super-nodes k,
– compute a summary graph S(G) with k super-nodes,
– such that the summary error is minimized.
• Graph summarization is NP-hard
– Difficult part is determining the super-nodes VS
– Once the supernodes are decided,
o constructing the super-edges with minimum summary
o error can be achieved in polynomial time.
Preliminaries > Graph Summarization Problem
22. Data & Knowledge Engineering Lab, Department of Computer Engineering, Kyung Hee University, Korea.
Distributed Graph Summarization
• Giraph is an open source implementation of Pregel
• Supports
– Iterative algorithms and
– vertex-to-vertex communication in a distributed graph
• Giraph program consists
– input step (graph initialization)
– followed by a sequence of iterations (called supersteps)
– an output
• Vertex-centric model
– Each vertex
o is considered an independent computing unit
o Has a unique id, A set of outgoing edges
o application-dependent attributes of the vertex and Its edges
GIRAPH OVERVIEW
23. Data & Knowledge Engineering Lab, Department of Computer Engineering, Kyung Hee University, Korea.
Distributed Graph Summarization
• Distributed graph summarization
– same iterative merging mechanism in the centralized algorithm
– starting from the original graph as the summary
o each node is a super-node and
o iteratively merging super-nodes until k super-nodes left.
– In Centralized algorithms easy
o Single process with share memory
o to decide which pairs of super-nodes are good candidates for merge &
o perform these merge operations
– In Giraph distributed environment,
o All the decisions and operations have to be done in a distributed way
o through message passing and synchronization
o To fully utilize the parallelization
need to find multiple pairs of nodes to merge, and
simultaneously merge them in each iteration.
Main idea
24. Data & Knowledge Engineering Lab, Department of Computer Engineering, Kyung Hee University, Korea.
Distributed Graph Summarization
• Two challenges define two crucial tasks:
– Candidates-Find task
o The Candidates-Find task decides on the pairs of super-nodes to be merged.
– Merge task
o Whereas the Merge task executes these merges
• Propose three distributed graph summarization algorithms:
– Dist-Greedy,
– Dist-Random and
– Dist-LSH
• Three algorithms share the same operations in the Merge task
• Differ in how merge candidates are selected.
Challenges
25. Data & Knowledge Engineering Lab, Department of Computer Engineering, Kyung Hee University, Korea.
Distributed Graph Summarization
• Each Giraph vertex
– Has three attributes associated with vertices
o owner-id: points to which other super-node this super-node has been merged to.
o size: records the number of nodes in the original graph contained in this super-node.
o selfconn: represents the number of edges in connecting the nodes inside this super-node.
– Two attributes associated with edges
o size: caches the number of nodes in the other adjacent super-node of the edge to avoid an
additional round of query for this value.
o conn: is the number of edges in the original graph between this super-node and the neighbor.
Giraph vertex’s Data structure
26. Data & Knowledge Engineering Lab, Department of Computer Engineering, Kyung Hee University, Korea.
Distributed Graph Summarization
• Super-steps:
– Candidates-Find task &
– Merge task
• ExecutionPhase (Aggregator )
– Indicate COMPUTE() function currently current
Phase.
• Based on the previous value of ExecutionPhase,
– we can set the right value to this aggregator in
the PRESUPERSTEP function before each
superstep starts.
Overview
• ActiveNodes (Aggregator)
• is used to keep track of the number of super-nodes in the current summary.
• When the summary size is less or equal to the required size k,
• the value of the ExecutionPhase will be set to DONE.
• In this case, in the COMPUTE() function, every vertex will vote to halt.
• Then the whole program will finish.
27. Data & Knowledge Engineering Lab, Department of Computer Engineering, Kyung Hee University, Korea.
Distributed Graph Summarization
• How to find pairs of super-nodes as candidates to merge in
– DistGreedy
– DistRandom
– DistLSH.
• FindCandidates(msgs)
FINDING MERGE CANDIDATES
28. Data & Knowledge Engineering Lab, Department of Computer Engineering, Kyung Hee University, Korea.
Distributed Graph Summarization
• DistGreedy
– based on the centralized Greedy algorithm.
– looks at super-nodes that are 2-hops away to each other and
– thrives to find the pairs with minimum error increase.
FINDING MERGE CANDIDATES > DistGreedy
– To control the number of super-node pairs to be merged in each iteration,
o use a threshold called ErrorThreshold
o as the cutoff for which pairs qualify as merge candidates.
– every pairs with error increase < ErrorThreshold
o will become merge candidates.
– In start, ErrorThreshold = 0 (no error)
– Number of merge candidates fall below 5% of the current summary size,
o the algorithm increases ErrorThreshold by a controllable parameter,
o called ThresholdIncrease, for the subsequent iterations.
29. Data & Knowledge Engineering Lab, Department of Computer Engineering, Kyung Hee University, Korea.
Distributed Graph Summarization
• Major task
– To compute the actual error increase for each pair of 2-
hop-away super-nodes
• simple in the centralized Greedy
• More complex in the distributed environment,
– as the information to compute the error increase is
distributed in different places.
FINDING MERGE CANDIDATES > DistGreedy (Cont’d)
30. Data & Knowledge Engineering Lab, Department of Computer Engineering, Kyung Hee University, Korea.
Distributed Graph Summarization
• Error increase for merging a pair of
supernodes Vi and Vj can be decomposed
into 3 parts:
– Common Neighbor Error Increase
– Unique Neighbor Error Increase
– Self Error Increase
FINDING MERGE CANDIDATES > DistGreedy (Cont’d)
31. Data & Knowledge Engineering Lab, Department of Computer Engineering, Kyung Hee University, Korea.
Distributed Graph Summarization
• Common Neighbor Error Increase
– requires the error increase associated with
the connections of Vi and Vj to all their
common neighbors.
– For a common neighbor, say Vp
o error before the merge is
o After merge =
o Thus error increase of merging Vi and Vj w.r.t.
common neighbor Vp is:
o Collectively computed common neighbors:
FINDING MERGE CANDIDATES > DistGreedy (Cont’d)
32. Data & Knowledge Engineering Lab, Department of Computer Engineering, Kyung Hee University, Korea.
Distributed Graph Summarization
• Unique Neighbor Error Increase
– Computation requires only unique neighbors
of each super-node.
– Vi and Vj can independently compute this
part of error increase.
– For the unique neighbor Vq in Fig.
– Error increase associated with Vi unique
neighbors
– Similar for Vj
– The total is a simple sum of the two:
FINDING MERGE CANDIDATES > DistGreedy (Cont’d)
33. Data & Knowledge Engineering Lab, Department of Computer Engineering, Kyung Hee University, Korea.
Distributed Graph Summarization
• Self Error Increase
– requires collaboration between Vi and Vj
• Between the two super-nodes,
– the one with a larger id, say Vj
– Sends its self-conn to Vi
– Then at Vi,
– self-loop error
FINDING MERGE CANDIDATES > DistGreedy (Cont’d)
34. Data & Knowledge Engineering Lab, Department of Computer Engineering, Kyung Hee University, Korea.
Distributed Graph Summarization
• Finally:
– the three parts of error increase will be
aggregated at the super-node with the
smaller id, Vi in our example.
– This requires messages from
o common neighbors
o Unique Neighbors
o Self Connections
• Then Vi can simply test whether
– the total error increase is below ErrorThreshold
– or not to decide on
– whether the two super-nodes should be merged.
FINDING MERGE CANDIDATES > DistGreedy (Cont’d)
35. Data & Knowledge Engineering Lab, Department of Computer Engineering, Kyung Hee University, Korea.
Distributed Graph Summarization
• DistGreedy
– Algorithm 2
o DistGreedy’s FindCandidates function.
– There are three phases for this function.
– Giraph vertex = different roles in computation
– Aggregator ExecutionPhase
o indicate current superstep phase.
– First phase
o Giraph vertex role = common neighbor
o Vp, to a potential merge candidate Vi and Vj
o neighbors of Vp are all two hops away from each
other
o Vp will compute for all pairs of neighbors
Vi and Vj
o And send to the super-node in the pair
with the smaller id, Vi.
FINDING MERGE CANDIDATES
36. Data & Knowledge Engineering Lab, Department of Computer Engineering, Kyung Hee University, Korea.
Distributed Graph Summarization
• DistGreedy - Time complexity
– d = average number of neighbors of a vertex.
– then average no. of 2-hop away neighbors for a vertex is d2
– the computation of all the different 2-hop away neighbors
– complexity is O(d2, N)
o where N is the total number of vertices.
– Same for
– computation phase
o iterates through each 1-hop neighbor Vq to compute for every 2-hop neighbor Vj ,
thus has a time complexity of O(d3 N).
– Overall DistGreedy time complexity is =
FINDING MERGE CANDIDATES > DistGreedy (Cont’d)
37. Data & Knowledge Engineering Lab, Department of Computer Engineering, Kyung Hee University, Korea.
Distributed Graph Summarization
• DistRandom
– DistGreedy blindly examines all super-node pairs of 2 hops
o large amount of computation
o network messages.
– DistRandom randomly selects some super-node pairs to examine.
– DistRandom also has the following three supersteps.
o super-node randomly selects one neighbor
sends a message to this neighbor, including its
» size, selfconn, all neighbors’ size and conn.
o neighbor receives the message and forwards it to a random chosen neighbor with an id
smaller than the sender.
o The 2-hop away neighbor receives this message and use it to compute the error increase. If
the error increase is above ErrorThreshold, then a merge decision is made.
– Time complexity is O(d, N)
FINDING MERGE CANDIDATES > DistRandom
38. Data & Knowledge Engineering Lab, Department of Computer Engineering, Kyung Hee University, Korea.
Distributed Graph Summarization
• After Candidates-Find task
– Super-nodes to be merged
• How to merge super-nodes distributedly?
• For every vertex merge
– Instead of creating a new merged super-node
– always reuse the super-node
o with the smaller id as the merged super-node.
• super-node with larger id shall set its owner-id to the
merged super-node.
– and call VOTETOHALT()
– to turn itself to inactive.
MERGING SUPER-NODES
39. Data & Knowledge Engineering Lab, Department of Computer Engineering, Kyung Hee University, Korea.
Distributed Graph Summarization
• Issue?
– merge super-nodes Vi and Vj in to Vi
– issue is that there could be another merge
decision that requires Vi merged into Vg.
– Efficiently merge multiple super-node pairs
distributedly
– we introduce a repeatable merge decision
propagation phase to ensure all the super-nodes
know whom they eventually should be merge
into.
– This design decision is essential to save overall
supersteps and messages,
– Vertex id is much cheaper to propagate than real
vertex data.
• Decision Propagation Phase
• Connection Switch Phase
• Connection Merge Phase
• State Update Phase
MERGING SUPER-NODES
40. Data & Knowledge Engineering Lab, Department of Computer Engineering, Kyung Hee University, Korea.
Distributed Graph Summarization
• Decision Propagation Phase
– Vi will notify Vj and Vg will notify Vi
• Connection Switch Phase
– each super-nodes to be merged
– shall notify its neighbors to update this neighbor
information
– self.size, self.conn,
– All neighbor’s nbr.sizes and
– nbr.conns.
• Connection Merge Phase
– receivers of the connection switch messages shall
update their neighbor list with the new neighbor ids
• State Update Phase
– performs the actual merge by updating all the attributes
MERGING SUPER-NODES
41. Data & Knowledge Engineering Lab, Department of Computer Engineering, Kyung Hee University, Korea.
Distributed Graph Summarization
• Environment
– Cluster of 16-node (IBM SystemX iDataPlex dx340)
– 32GB RAM,
– Ubuntu Linux, Java 1.6, Giraph trunk version
• Dataset:
EXPERIMENTAL EVALUATION
42. Data & Knowledge Engineering Lab, Department of Computer Engineering, Kyung Hee University, Korea.
Distributed Graph Summarization
• Log-scaled graph summary error histograms
– across different graph summary sizes for three real datasets.
EXPERIMENTAL EVALUATION
43. Data & Knowledge Engineering Lab, Department of Computer Engineering, Kyung Hee University, Korea.
Distributed Graph Summarization
• Log-scaled running time histograms
– across different graph summary sizes for three real datasets..
EXPERIMENTAL EVALUATION
44. Data & Knowledge Engineering Lab, Department of Computer Engineering, Kyung Hee University, Korea.
Distributed Graph Summarization
EXPERIMENTAL EVALUATION
45. Data & Knowledge Engineering Lab, Department of Computer Engineering, Kyung Hee University, Korea.
Conclusion and Future work
• Presented a highly compact two-part representation
– R(S,C) of the input graph G
– based on the MDL principle.
o Greedy, Random and LSH based.
– The same has been implemented in distributed environment.
Common Neighbor Error Increase
associated with the connections to the common neighbors of the two super-nodes.
Unique Neighbor Error Increase
captures the error increase brought by the connections to the unique neighbors of the two super-nodes.
Self Error Increase
This last part of error increase comes from the self connections of the two super-nodes as well as the connection between the two super-nodes if there is any.