Download to read offline


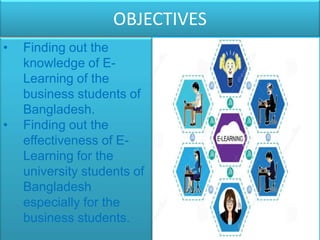
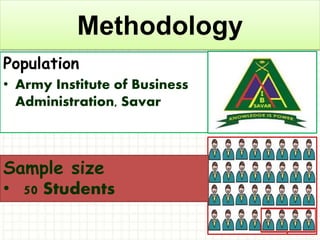
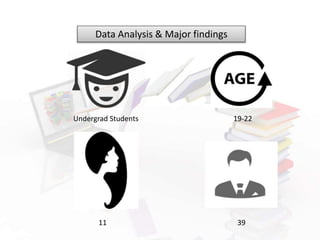
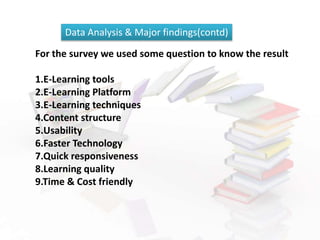
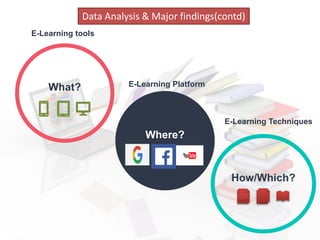
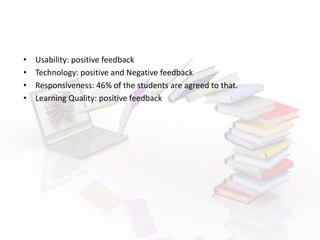
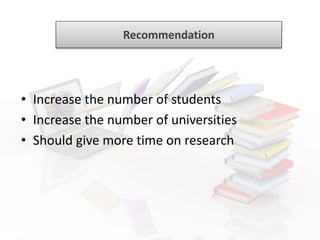
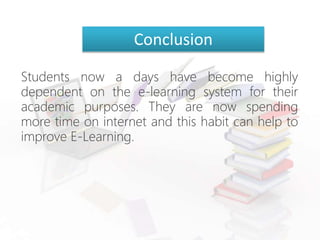


The document discusses the learning experiences of business students in Bangladesh, emphasizing the effectiveness of e-learning. It outlines the objectives, methodology, findings, and recommendations of a study conducted at the Army Institute of Business Administration, focused on evaluating students' knowledge and use of e-learning tools. Major findings indicate positive feedback on usability and learning quality, with recommendations to expand the use of e-learning and invest more in research.


