1. Multi-dimensional students’ evaluation of e-learning systems in the higher
education context: An empirical investigation
Sevgi Ozkan *, Refika Koseler
Informatics Institute, Middle East Technical University, Ankara, Turkey
a r t i c l e i n f o
Article history:
Received 31 January 2009
Received in revised form 25 May 2009
Accepted 18 June 2009
Keywords:
e-Learning information systems
Learning management systems
e-Learning evaluation
e-Learning evaluation survey
Statistical analysis
Students’ satisfaction
a b s t r a c t
There has been little research on assessment of learning management systems (LMS) within educational
organizations as both a web-based learning system for e-learning and as a supportive tool for blended
learning environments. This study proposes a conceptual e-learning assessment model, hexagonal e-
learning assessment model (HELAM) suggesting a multi-dimensional approach for LMS evaluation via
six dimensions: (1) system quality, (2) service quality, (3) content quality, (4) learner perspective, (5)
instructor attitudes, and (6) supportive issues. A survey instrument based on HELAM has been developed
and applied to 84 learners. This sample consists of students at both undergraduate and graduate levels
who are users of a web-based learning management system, U-Link, at Brunel University, UK. The survey
instrument has been tested for content validity, reliability, and criterion-based predictive validity. The
analytical results strongly support the appropriateness of the proposed model in evaluating LMSs
through learners’ satisfaction. The explanatory factor analysis showed that each of the six dimensions
of the proposed model had a significant effect on the learners’ perceived satisfaction. Findings of this
research will be valuable for both academics and practitioners of e-learning systems.
Ó 2009 Elsevier Ltd. All rights reserved.
1. Introduction
The traditional context of learning is experiencing a radical change. Teaching and learning are no longer restricted to traditional class-
rooms (Wang, Wang, & Shee, 2007). Electronic learning (hereafter e-learning), referring to the use of electronic devices for learning, includ-
ing the delivery of content via electronic media such as Internet, audio or video, satellite broadcast, interactive TV, CD-ROM, and so on
(Kaplan-Leiserson, 2000), has become one of the most significant developments in the information systems (hereafter IS) industry (Wang,
Liaw, & Wang, 2003). The rapid expansion of the Internet as a delivery platform, combined with the trends towards location-independent
education and individualization, has motivated universities to invest their resources on developing online programs. However, the devel-
opment, management and continuous improvement of e-learning systems are quite challenging both for the educational institutions and
for the industry. In that, assessment has become an essential requirement of a feedback loop for continuous improvement: ‘What gets mea-
sured gets attention’ (Eccles, 1991).
e-Learning systems are multidisciplinary by nature. Many researchers from fields such as computer science, information systems, psy-
chology, education, and educational technology, have been trying to evaluate e-learning systems. Some have focused on technology-based
components of e-learning systems (Islas et al., 2007), where others have studied only the human factor of e-learning systems considering
student and instructor satisfaction (Liaw, Huang, & Chen, 2007). Douglas and Van Der Vyver (2004) dealt with the effectiveness of e-learn-
ing course materials only; where Arbaugh and Fich (2007) studied the importance of participant interaction in online environments; and
Gilbert (2007) investigated the student experience perspective only. These individual assessment frameworks yield convenient solutions in
practice. However, they comply with the needs only partially not fulfilling all of the necessities.
The purpose of this research is to develop a comprehensive e-learning assessment model using existing literature as a base, incorporat-
ing concepts from both information systems and education disciplines. This study contributes to the e-learning literature with an instru-
ment providing guidelines for e-learning systems developers and distance educators to better understand the students’ perceptions of both
social and technical issues associated with e-learning systems. By providing a multidimensional evaluation of e-learning systems from
0360-1315/$ - see front matter Ó 2009 Elsevier Ltd. All rights reserved.
doi:10.1016/j.compedu.2009.06.011
* Corresponding author. Tel.: +90 5325961040; fax: +90 3122103745.
E-mail addresses: sevgi.ozkan@brunel.ac.uk, sozkan@ii.metu.edu.tr, sevgiozkan2005@hotmail.com (S. Ozkan).
Computers & Education 53 (2009) 1285–1296
Contents lists available at ScienceDirect
Computers & Education
journal homepage: www.elsevier.com/locate/compedu
2. students’ perspective, the findings of this research help to build more effective learning management systems and improve effectiveness in
distance education.
The paper is organized as follows. First, a critical review of a number of approaches of e-learning assessment from social and technical
perspectives is presented. From this review, components that constitute a conceptual model for e-learning systems assessment have been
developed. Next, the proposed model and the survey instrument are described. Further, the empirical investigation where the survey
instrument is applied on a learning management system at a higher education institution is reported. The survey instrument has been
tested on learners for content validity, reliability, and criterion-based predictive validity. The explanatory factor analysis has been con-
ducted. The findings are discussed and compared with the literature. Finally, contributions of this research are summarized. Based on these,
issues for the utilization of the research contributions in terms of potential future research topics are addressed.
2. Literature review
Volery and Lord (2000) defined e-learning as a combination of learner, faculty, instructor, technical staff, administrative, learner sup-
port, and use of the Internet and other technologies. In parallel, the success of an e-learning system may be considered as an emerging
concept of ‘social issues’ and ‘technical issues’ and depends on numerous circumstances, rather than a black-and-white formula. e-Learning
systems are open systems so they are affected by the environment and influenced by the people who use them. Since e-learning systems
are socio-technical entities, the e-learning literature has been reviewed under two sections in the following paragraphs.
2.1. e-Learning system as a social entity
It is evident from previous research that the quality of an instructor is an important determinant for an effective learning management
system (hereafter LMS) (Hiltz, 1993; Islas et al., 2007; Khan, 2005; Liaw et al., 2007; Selim, 2007; Wang et al., 2007; Webster & Hackley,
1997). Liaw et al. (2007) claimed that, ‘instructor’ is the major aspect of e-learning. Within learning environments, instructors should have
enough time to interact with students in their learning process (Khan, 2005). In parallel, Collis (1995) emphasizes the importance of the
‘instructor’ highlighting the fact that it is not the technology itself but the instructional implementation of the technology which
determines its effects on learning. Similarly, Webster and Hackley (1997) state that instructors’ attitudes towards a technology, their
teaching styles, and their control over the technology affect the learning outcomes. Moreover, Dillon and Gunawardena (1995) suggested
that instructors’ attitudes towards technology-mediated distance learning systems should be considered when evaluating these
systems.
Several researchers considered learner’s perceived effectiveness as an important indicator of an effective LMS (Piccoli, Ahmad, & Ives,
2001; Webster & Hackley, 1997; Dillon & Gunawardena, 1995; Leidner & Jarvenpaa, 1993; Islas et al., 2007; Kim & Lee, 2007; Liaw et al.,
2007; Volery & Lord, 2000; Holsapple & Lee-Post, 2006; Selim, 2007; Sun, Tsai, Finger, Chen, & Yeh, 2008). In that, interactive instructional
design is proved to be an essential factor for learning satisfaction and success (Hong, Lai, & Holton, 2003; Arbaugh, 2002; Berge, 2000; Jiang
& Ting, 1998; Khan, 2005; Levy, 2007; Shee & Wang, 2008). As a need, understanding and identifying the attitudes of learners towards the
LMS is important when investigating learner’s satisfaction. In order to design effective e-learning environments, it is necessary to ‘under-
stand the target group’ (Liaw et al., 2007). Learner characteristics such as motivation, belief, confidence, computer anxiety, fear, anxiety,
apprehension, enthusiasm, excitement, pride and embarrassment need to be identified (Konradt & Sulz, 2001; Passerini & Granger,
2000). Moreover, perceived enjoyment, and usefulness are positively related to intention to use LMS (Liaw et al., 2007).
There are other issues such as trends, ethical and legal issues, environmental issues, i.e., technological developments, popularity of LMS
tools, which have significant impacts on the effectiveness of an LMS. Khan (2005) pointed out the importance of ethical and legal issues on
LMS success.
2.2. e-Learning system as a technical entity
In addition to social issues mentioned, there are technical issues such as system quality and Internet quality, that have a significant
effect on the effectiveness of an LMS (Dillon & Gunawardena, 1995; Kim & Lee, 2007; Leidner & Jarvenpaa, 1993; Islas et al., 2007; Piccoli
et al., 2001; Webster & Hackley, 1997; Liaw et al., 2007; Volery & Lord, 2000; Holsapple & Lee-Post, 2006; Selim, 2007; Sun et al., 2008).
System quality has two components: the LMS software and the peripherals, i.e., the hardware. The software quality involves stability, secu-
rity, reliability, pace, responsiveness, ease of use, user-friendliness, well-organized design, personalization (Shee & Wang, 2008). The quality of
the peripherals involves wellness of microphones, earphones, electronic blackboards, electronic mail, online threaded discussion boards, synchro-
nous chat, and desktop videoconferencing. The higher the quality and reliability of used technology, the higher the learning effects will be
(Hiltz, 1993; Piccoli et al., 2001; Webster & Hackley, 1997; Sun et al., 2008).
In recent years, several innovative Internet technologies such as Web 2.0 applications have been applied in the development of e-learn-
ing systems. One of the most popular outcomes of Web 2.0 technologies are Personalized Learning Environments (PLEs) (Weller, 2006).
When Web 2.0 principles were analyzed from a learning perspective, Ullrich et al. (2008) highlighted stimulation of active participation,
i.e., interactivity; and interactive content as distinguished features.
Content quality in e-learning depends on how well the learning environment is designed and managed. Learners place great value on
content where a quality content is well-organized, effectively presented, interactive, clearly written, in the right length, useful, flexible, and pro-
vide appropriate degree of breath (Shee & Wang, 2008). Holsapple and Lee-Post in their study (2006) highlighted the importance of up-to-
datedness and usefulness of the content. In addition, effective course management, i.e., entering grades in time, making necessary announce-
ments on time, pre-defined structured exam evaluation criteria, enables learners to feel more comfortable with the course content, resulting in
higher retention and satisfaction rates.
Other issues when delivering courses via an LMS can be grouped under service quality, which includes administrative affairs such as,
student tracking, course/instruction authorization, providing LMS design tools, course management, budgeting, institutional funding and
resources for delivering and maintenance.
1286 S. Ozkan, R. Koseler / Computers & Education 53 (2009) 1285–1296
3. A number of issues related with the effectiveness of an LMS have been reviewed. These have been summarized in Appendix A. The fol-
lowing section develops a comprehensive e-learning assessment model using existing theory as a base.
3. Method
3.1. Conceptual model: hexagonal e-Learning assessment model (HELAM)
Most research suggests an integrated approach to the assessment of e-learning systems. Related literature has been reviewed focusing
on e-learning systems both as a ‘social’ and a ‘technical’ entity. Based on the literature, the social and technical issues related with LMS
assessment have been summarized in a table presented in Appendix A. It has been observed that individual assessment models examined
yield convenient solutions in practice within their specific contexts and are in conformance with the complementary literature. However,
for effective e-learning, there is a need for a systematic and comprehensive evaluation model which comprises both social and technical
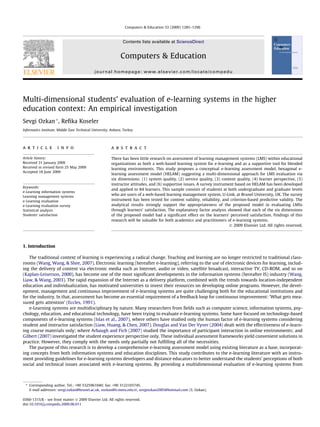
issues of e-learning. In this respect, a hexagonal e-learning assessment model (HELAM) is proposed for LMS assessment. There are 47 cri-
teria grouped under six dimensions as illustrated in Fig. 1. This model is not LMS specific and it is applicable to various e-learning infor-
mation systems. It is important to note that HELAM is neither a fixed nor a universal model.
3.2. Survey instrument and data collection
In this study both quantitative and qualitative methods have been used to test the proposed model, HELAM. To collect data from stu-
dents about their perceptions of the blended learning environment and LMS in regards to their benefits and satisfaction level; a survey
instrument based on HELAM has been developed. The researchers referred to a group of experts when discussing the validity of the ques-
tions within the survey instrument. The aim was to conduct a content validity based on the extent to which the measurement reflects the
specific intended domain of content (Carmines & Zeller, 1994). A total number of ten experts in the field of information systems (IS) and
educational technology have been asked to assess whether each dimension in the model is ‘essential’, ‘useful but not essential’, or ‘not nec-
essary’. Four of the experts are from the Information Systems Evaluation and Integration Group (ISEing), Brunel University, London, UK;
two from Learning and Teaching Development Unit, Brunel University, London, UK; and two from the Middle East Technical University,
Informatics Institute, Ankara, Turkey, and two from the Computer Education and Instructional Technology Department, Middle East Tech-
nical University, Ankara.
A pilot study was conducted where the initial instrument was applied to 90 undergraduate Level 1 students who were enrolled with the
course entitled ‘‘IS100 Introduction to Information System Technologies and Applications” at Middle East Technical University, Turkey. The
D. Technical Issues: System Quality
D1 . Easy to Use D10 . Personalization
D2 . Security D11 . Interactivity
D3 . Reliability
D4 . Usability
D5 . Maintenance
D6 . Help option available
D7 . User -Friendly
D8 . Well Organized
D9 . Availability
E. Technical Issues: Information (Content)
Quality
E1 . Curriculum Management
E2 . Course Flexibility
E3 . Interactive Content E9. Maintenance
E4 . Learning Model E10. Up-to-Dateness
E5 . Tutorial Quality E1 1. Well Organized
E6. Clarity
E7. Sufficient Content
E8. Learner Assessment Material Quality
B. Social Issues: Learner Perspective
B1 . Learner Attitudes toward LMS
B2 . Learner’s Computer Anxiety
B3 . Self Efficiency
B4 . Enjoyable Experience
B5 . Interaction with other students and teacher
B6 . Learner’s study habits
B7 . Student Experience Level with LMS
F. Technical Issues: Service Quality
F1 . Student Tracking
F2 . Course/Instruction Authorization
F3 . Course Management
F4 . Knowledgable
A. Social Issues: Supportive Factors
A1 . Promotion of LMS
A2 . Trends – (Social - Political)
A3 . Ethical & Legal Issues
A4. Cost
C. Social Issues: Instructor Attidudes
C1. Responsiveness C8. Enjoyment
C2. Informativeness C9. Self - efficacy
C3. Fairness
C4. Encouraging interaction between students
C5. Control over Technology
C6 . Course Management
C7. Communication Ability
Fig. 1. HELAM (hexagonal e-learning assessment model).
S. Ozkan, R. Koseler / Computers & Education 53 (2009) 1285–1296 1287
4. LMS evaluated was METU-online (Ozkan, Koseler, & Baykal, 2009). Together with the findings from this pilot study and the feedback gained
from the individual experts, both HELAM and the survey instrument had been revised and developed iteratively.
The final version of the survey consists of 73 questions in two main parts: first part aims to gather generic data about the learners, and
the second part about learners’ LMS experiences. The first part consists of demographic questions. The second part is divided into six sec-
tions each of which corresponds to one HELAM dimension. In this part, five point likert-type scale item is used. These questions are anchored
from 1 to 5, where 1 indicates strong disagreement and five indicates strong agreement. All responses were guaranteed confidentiality. The
survey instrument is presented in Appendix A. For quantitative data collection, the survey instrument has been made available online. It
has been anticipated that the use of computer-assisted data collection can greatly improve the reliability of the data as it eliminates the
human data entry step that includes some natural human errors (Fowler, 1993).
In order to capture qualitative data, focus group discussions have been conducted with 20 e-learners. Four different focus groups were
formed randomly from volunteers who were enthusiastic to become a part of this study. Each group consisted of 5 e-learners at graduate
and undergraduate levels. Approximately 30 min were spent with each group. The focus groups created an interactive group setting where
participants felt free to talk with other group members and make critiques. Semi-structured questions were asked seeking learner’s general
believes, perceived satisfaction, attitudes, and comments about the instructor, course, and the LMS.
3.3. Participants
The survey instrument was sent out to a total of 265 individuals. This sample consists of both graduate and post-graduate students at
Brunel University, UK. All respondents are active users of U-Link as a supportive tool to the courses they are enrolled. The online survey was
conducted for one month, with incomplete responses and missing values deleted, resulting in a sample size of 84 users for an overall re-
sponse rate of 32%. Responses were voluntary and therefore unavoidably subject to self-selection biases. Conceivably, users who were
interested in using e-learning were more likely to respond. Table 1 lists the respondents’ demographic characteristics, including gender,
age and computer usage.
4. Statistical analyses
To examine the data, statistical methods have been used. Descriptive statistics were run to analyze the collected data. The responses to
the questionnaire were analyzed using the Statistical Package for the Social Sciences (SPSS) 11.5 Windows software program. In order to
validate the proposed LMS evaluation model, HELAM and the survey instrument, a number of validity and reliability tests have been ap-
plied. An explanatory factor analysis was conducted to examine the factor structure of the survey instrument. Reliability was evaluated by
assessing the internal consistency of the items representing each factor using Cronbach’s alpha. Finally, criterion-based validity was tested.
4.1. Identifying factor structure
Before the factor analysis; we scanned for the significance correlation values and looked for any item for which the majority of the val-
ues are greater than the alpha value 0.05. Then the researchers searched for any value among the correlation coefficients that are greater
Table 1
Demographic characteristics of respondents.
Frequency Percentage (%)
Gender
Male 40 47.6
Female 44 52.4
Age
18–28 52 61.9
28–38 21 25.0
38–48 11 13.1
Computer Usage Habits (per day)
Spend time on using a computer/Internet (per day)
Less than 1 h 1 1.2
Between 1 and 3 h 20 24.1
Between 3 and 5 h 22 26.5
Between 5 and 7 h 24 28.9
Between 7 and 9 h 10 12.0
More than 9 h 6 7.2
Spend time on using a computer/Internet for educational purposes(per day)
Less than 1 h 8 9.6
Between 1 and 3 h 35 42.2
Between 3 and 5 h 27 32.5
Between 5 and 7 h 9 10.8
Between 7 and 9 h 4 4.8
Spend time on using U-Link (per day)
Less than 1 h 55 66.3
Between 1 and 3 h 24 28.9
Between 3 and 5 h 3 3.6
Between 5 and 7 h 1 1.2
Total 84 100
1288 S. Ozkan, R. Koseler / Computers & Education 53 (2009) 1285–1296
5. than 0.9 to avoid any possible multicollinearity problem. Checking the determinant of the correlation matrix is another way of detecting
multicollinearity problem. In our case the majority of the correlation coefficients are significant along with values smaller than 0.9 and a
determinant greater than the necessary value of 0.00001, therefore all the questions left1
in our survey instrument correlate reasonably well
and none of them is particularly large not leading to multicollinearity or singularity.
Kaiser–Meyer–Olkin (KMO) Measure of Sampling Adequacy and Bartlett’s test of Sphericity was conducted and a KMO value of 0.861
was found. A value close to one indicates that of correlations are relatively compact and so factor analysis should yield distinct and reliable
factors (Kaiser, 1974). Therefore we can make an inference such that there are separate differences between factors’ correlations indicating
having an adequate sample along with distinct reliable factors. In addition we have a significant test with Chi Square value of 2309.62 with
63 degrees of freedom and a significance value of 0.000 therefore we can conclude there are non-zero correlations between variables hence
factors exist.
Explanatory factor analysis was conducted to primarily establish the factor structure of the model. In order to investigate the internal
consistency of the subscales of the survey, Cronbach’s alpha coefficient was examined. Descriptive statistics were used to present central
tendency and variability. In order to decide the number of factors we used Screen plot and Eigenvalues greater than 1 criterion (Tabachnick
& Fidell, 2007). It was found that items were loaded on exactly six factors named as: Instructor Quality (Factor 1), information content qual-
ity (Factor 2), system quality (Factor 3), service quality (Factor 4), learner’s attitude (Factor 5) and finally supportive issues (Factor 6). Total
explained variance by running the data was 63.09%. This percentage is high enough to consider HELAM survey instrument as successful.
Table 2 summarizes the factor loading of the survey instrument. Rotation optimizes the factor structure as a result the relative importance
of the six factors is equalized and construction Rotated Component Matrix we have reached more homogenously distributed factor load-
ings of items among six factors.
4.2. Reliability
In order to determine the reliabilities of the factors and to assess the internal consistency of the factors, we used Cronbach’s alpha. All
the factors have high values of Cronbach’s alpha that can be seen from Table 2, all of which are around 0.8 being close to one. Since
Table 2
U-Link factor analysis and reliabilities of the survey.
Factors Item (survey instrument question number) Factor loadings Factor reliability Total variance explained (%)
Factor 1: instructor quality F1.1 24 0.799 0.9432 24.199
F1.2 21 0.793
F1.3 22 0.778
F1.4 26 0.763
F1.5 25 0.760
F1.6 30 0.700
F1.7 29 0.675
F1.8 27 0.671
F1.9 23 0.653
F1.10 20 0.621
Factor 2: information content quality F2.1 50 0.500 0.9202 13.128
F2.2 51 0.512
F2.3 53 0.763
F2.4 55 0.692
F2.5 52 0.681
F2.6 54 0.621
F2.7 46 0.563
Factor 3: system quality F3.1 37 0.807 0.9183 11.332
F3.2 38 0.789
F3.3 33 0.693
F3.4 36 0.675
F3.5 32 0.644
F3.6 39 0.640
F3.7 40 0.531
F3.8 44 0.531
Factor 4: service quality F4.1 66 0.723 0.9179 3.145
F4.2 67 0.634
F4.3 61 0.863
Factor 5: learner’s attitude F5.1 15 0.713 0.8240 8.444
F5.2 13 0.657
F5.3 10 0.771
F5.4 12 0.692
Factor 6: supportive issues F6.1 73 0.311 0.7175 2.783
F6.2 70 0.382
F6.3 72 0.772
Total 63.09
1
All the steps explained through factor analysis contains repeated controls for omitting inappropriate items from the factors in according to the factor analysis rules explained
throughout this part. The process is defined over the final version of the factors.
S. Ozkan, R. Koseler / Computers & Education 53 (2009) 1285–1296 1289
6. Cronbach’s alpha evaluates how well the items of a factor measure a single unidimensional latent construct; a high value closer to one
indicates that the items consisting the factor can measure the same underlying structure meaning they form a reliable factor and they
are consistent in between the other items in the factor.
4.3. Criterion-based predictive validity
Regarding predictive validity, a multiple regression analysis was performed. The main objective was to assess the efficacy and effective-
ness of the survey instrument’s parameters in predicting learner’s satisfaction. In this research, the proposed usability parameters (i.e., the
six factors identified in factor analysis) are the independent variables (IVs) and the composite variable learner satisfaction is the dependent
variable (DV). The composite dependent variable consisted of three items used to measure learner satisfaction. All independent variables
were entered into the analysis simultaneously in order to assess the predictive strength of the proposed model. When all independent vari-
ables were entered into the multiple regression model, results showed an R square of 0.982 and adjusted R square of 0.963 (Table 3) at
p < 0.002 which is statistically significant. These findings accounted for 96.4% (adjusted R square 92.7%) of the variance in learner’s satis-
faction, which delineate good results for the survey instrument and can be considered as preliminary evidence of its validity (Cohen, 1988).
5. Results
Descriptive statistics of each HELAM category are depicted in Table 4 to summarize the data collected from survey results. These in-
clude mean, maximum, minimum values and standard deviations. Based on the descriptive statistical data, learner’s perceived satisfaction
from U-Link is high (mean value 3.72).
In addition to descriptive statistics, Pearson correlations have been reported for all quantitative measures in order to test the quanti-
tative results. All findings have been analyzed with Pearson correlation coefficient at the significant level of 0.01. The findings were not
accepted if the significant level (2-tailed) was less than 0.01. The results of testing Pearson correlation coefficient values are shown in Table
5. By using Pearson’s product moment coefficient values interpretation has been done in two ways: one is by looking into correlations of
each HELAM dimension with overall student satisfaction, and by examining correlations between dimensions. The latter is out of the scope of
this study.
Table 3
LMS success parameters in predicting learner’s satisfaction.
Model summary
Model R R square Adjusted R square Significant (p)
1 0.982a
0.963 0.769 0.002
a
Predictors: (constant), Factor 1: instructor Quality; Factor 2: information content quality; Factor 3: system quality; Factor 4: service quality; Factor 5: learner’s attitude;
Factor 6: supportive issues.
Table 4
Descriptive statistics: mean, standard deviation, maximum and minimum values for HELAM dimensions.
N Minimum Maximum Mean Std. deviation
Learner’s attitudes 84 2.00 5.00 3.6667 0.66683
Instructor quality 84 1.00 5.00 3.5357 0.96667
System quality 84 1.29 5.00 3.6922 0.71178
Information quality 81 1.83 5.00 3.7909 0.67070
Service quality 84 1.00 5.00 3.6845 0.87085
Supportive issues 84 2.00 5.00 3.9524 0.76423
Total learning quality 83 1.52 5.00 3.7204 0.77517
Table 5
Correlations between the categories of the survey instrument (corresponds with HELAM dimensions).
r 1 2 3 4 5 6 7
Overall satisfaction (1) 1
Learner’s attitudes (2) 0.482**
1
Instructor quality (3) 0.602**
0.623**
1
Supportive issues (4) 0.630**
0.473 0.718 1
Information quality (5) 0.623**
0.592 0.983**
0.692 1
System quality (6) 0.753**
0.573 0.617 0.455**
0.618 1
Service quality (7) 0.537**
0.541 0.740 0.621**
0.727 0.482**
1
**
Correlation is significant at the 0.01 level (2-tailed).
1290 S. Ozkan, R. Koseler / Computers & Education 53 (2009) 1285–1296
7. Pearson’s product moment coefficient (r) is a parametric technique which portrays the strength and direction of the relationships be-
tween two variables. A correlation coefficient was also perceived as a statistical devise used to measure the strength/degree of supposed
linear relationships between two variables. It is said to take the value from 1 to +1. The sign in front denotes the nature of the relationship
and the absolute figure provides an indication of the strength of the relationship. The interpretation of the value between 0 and 1 was
according to Cohen (1988) guidelines as follows, r = 0.10–0.29 or r = 0. 10 to 0.29 is indicated as small, r = 0.30–0.49 or r = 0.30 to
0.49 is indicated as medium and lastly, r = 0.50–1.0 or r = 0.50 to 1.0 is in the scope of large. The level of criticality of each dimension
is represented by its Pearson correlation results.
In addition to statistical analyses, findings from the focus group interviews were analyzed. A total of 20 learners expressed their opin-
ions, where all respondents were volunteers. These qualitative findings support the quantitative analyses. In the following paragraphs, dis-
cussions on findings are presented where statistical results (Tables 4 and 5) have been merged with qualitative findings, which altogether
are supported by the literature.
6. Discussion
The first dimension identifies the effect of learner attitudes on perceived learner’s satisfaction from LMS. Statistical results (Tables 4
and 5) prove that there is a positive statistically significant relationship between learner’s attitudes and overall learner satisfaction. This
is in parallel with the literature where Webster and Hackley also (1997) stated that learner’s attitudes towards technology and blended
learning may have significant effects on the success of the LMS. However, in this study, ‘learner’s attitudes’ has not been found to be
the most significant factor on user satisfaction, which is in contrast with some researchers who proposed that user satisfaction is the most
appropriate measure for IS success available (Davis, Bagozzi, & Warshaw, 1989; Gelderman, 1998; Zoltan & Chapanis, 1982). The most
powerful indicator for learner’s attitudes has been found to be ‘learner’s perceived enjoyment towards e-learning system’ (r = 0782;
p = 0.01). This is in parallel with quantitative findings: one learner stated that ‘‘. . .U-Link is beneficial for me mainly because I can achieve
the whole course material whenever and wherever I want. Besides, the course materials are spread electronically not in paper format via U-Link
that I can save important course materials during even after the semester without any loss of information. Additionally, the electronic format of the
course materials helps me to achieve these important files more easily and efficiently. I can even save my whole course materials years and
years. . .” This is a highly important factor, which changes learner’s attitudes positively toward LMS. Most of the participants stated that
they would still prefer to use U-Link as a supportive tool even if it was optional as they believe that it would help their performance in
the module. Another finding from the focus group interviews supported by the statistical results is that the attitudes of learners towards
U-Link are positively related with the learner’s past LMS experience. For instance, one post-graduate learner stated that ‘‘. . .since I am famil-
iar with distance learning from my undergraduate studies, I found it straightforward to use U-Link. It was not difficult for me to find the relevant
tools of U-Link. . .”
The second dimension identifies the effect of instructor quality on perceived learner’s satisfaction from the LMS. Statistical results (Ta-
bles 4 and 5) prove that there is a strong relationship between the instructor’s quality and learner’s perceived satisfaction. Collis (1995)
remarked that the instructor plays a central role in the effectiveness of online delivery: ‘‘It is not the technology but the instructional imple-
mentation of the technology that determines the effects on learning’’. In parallel, focus group discussions have strengthened the impor-
tance of instructors. One of the learners stated that, ‘‘. . .whenever I send an e-mail to instructor or write something on forum, I more
enthusiastically open my U-Link session because I wonder the answer, but if the instructor does not reply to my question, my willingness to login
U-link session decrease dramatically. . .” Another learner states ‘‘. . .the instructor is very friendly and his methods were admired which motivates
me to use U-Link. . .” In brief, learner’s perceived satisfaction towards e-learning is positively affected when the instructor responds to learn-
ers rapidly, his teaching style is good enough, and his explanations are clear, and when he has control over technology; which altogether
influence the success of the learning overall positively. These results overlap with the literature (Arbaugh & Duray, 2002; Thurmond, Wam-
bach, & Connors, 2002).
The third dimension identifies the effect of system quality on learner’s perceived satisfaction. Statistical results (Tables 4 and 5) prove
that there is a highly positive relationship between system quality of the LMS and overall learner satisfaction. Considering the criteria
under the system dimension, it can be deduced that the stability of the learner interfaces has a significant emphasis on the learner. The
focus group discussions explored that the user interface is an area where a high level of interaction takes place; a well-designed, user-
friendly learner interface becomes one of the most critical factors in determining the satisfaction of learners when using the LMS. This is
in parallel with many IS-related studies (DeLone & McLean, 2003; Laudon & Laudon, 2000; Arbaugh & Fich, 2007; Wang et al., 2007;
Seddon, 1997). Another key issue which has been gaining importance with the development of Web 2.0 technologies in education is
personalization (Weller, 2006). One of the learners stated that ‘‘. . .when I login, I feel more organized seeing an opening page with my per-
sonal details. . .it is nice when it warns me which announcements I have not read. . .” The focus group interviews reflect that one of the most
important requirements of the learners is being able to control their learning progress. The learner’s habits have also been found to af-
fect the overall LMS success. ‘Easy navigation’, ‘easy to find the required information’, and ‘available help option’ are important aspects
for creating learner’s habit. Another outcome of Web 2.0 technology applications in education is interactivity (Mason & Rennie, 2007).
Before Web 2.0, students often felt isolated in a distance environment since they were not able to interact with the instructor and other
students. Both quantitative (r = 0792; p = 0.01) and qualitative results of this study prove that interactivity is an essential component in
both blended and online learning.
The fourth dimension identifies the effect of information (content) quality on learner’s perceived satisfaction. Statistical results (Tables
4 and 5) prove that there is a strong positive relationship between information quality of the LMS and overall learners’ perceived satisfac-
tion. Focus group interviews support that course quality has a significant role on learner’s perceived satisfaction from LMS. Learner’s mostly
define a quality content as whether the presentations or lecture notes are easily understandable, used appropriate degree of breath, up-to-
date, and rich content. Additionally, they state that, clear examples, illustrations, given additional resources gain their attentions, and pos-
itively influence their satisfaction. Quantitative results prove that interactive content is significant in both blended and online learning
(r = 0783; p = 0.01). This is in parallel with the literature where Web 2.0 technologies provide interactive online content (Safran, Helic, &
Gütl, 2007).
S. Ozkan, R. Koseler / Computers & Education 53 (2009) 1285–1296 1291
8. The fifth dimension identifies the effect of service quality on learner’s perceived satisfaction. Statistical results (Tables 4 and 5)
prove that there is a positive relationship between service quality of the U-Link and overall satisfaction. Learners are highly sat-
isfied by the assistants’ attitudes, and the services provided by the administrative staff. Focus group results show that learners in
blended learning courses often face technical problems which influence their overall satisfaction level negatively. It is therefore
crucial that every blended learning program has to have a supportive technical staff who has a good control of the technology
and who is able to perform basic troubleshooting tasks such as adding a learner at the last minute, modifying learner’s passwords,
changing the course settings, etc. (Volery & Lord, 2000). Another result is that learner’s perceived satisfaction is positively related
to the capability of service provided to follow up student problems and to solve students’ problems. In parallel with Haynes, Pou-
raghabagher, and Seu (1997) supportive staffs are essential for overall coordination of a blended learning module. Both faculty and
technical resources must be identified and committed to the schedule during the development of a blended module (Volery &
Lord, 2000).
The sixth dimension identifies the effect of supportive issues on learner’s perceived satisfaction. Statistical results (Tables 4 and 5)
prove that there is a strong positive relationship between supportive issues and overall learner satisfaction. Qualitative results demon-
strate that, popularity of LMS and trends influence LMS users significantly. For instance, U-Link was developed back in 1999. Since 1999,
at the beginning of each term, all the university students and academics have been encouraged to use U-Link in their modules. According
to the statistical data provided by the Brunel University, the use of U-Link has increased significantly during the last three years. Accord-
ing to one of the U-Link developers (David Sacramento) this is mainly because of the increasing popularity of e-learning portals. Another
important indicator for LMS effectiveness can be named as ‘‘friend effect”. One of the learners stated ‘‘. . .one of my friends in the upper
class advised me to check my announcements on U-Link, otherwise I wouldn’t use it. . . now I am regularly checking. . .” The ‘supportive issues’
dimension additionally covers ethical and legal issues together with privacy, plagiarism and copyright concepts. Khan (2005), in his book,
emphasized the importance of ethical and legal issues to create an effective LMS. In a typical e-learning module, there are numerous text
dialogs generated from LMS communication tools (e-mail, forum). These communication tools contain participants’ personal views and
biases which they may not want the outside world to know. Considering the openness of the web, search engines can find this informa-
tion. Therefore, institutions should clearly indicate to the learners whether or not their personal information will be shared. e-learning
module should provide clear information regarding institution’s plagiarism policy. Important e-learning portals impose serious penalties
if a case of plagiarism is substantiated (Athabasca University in Canada, Phoenix University in USA, Open University in UK). The last eth-
ical–legal issue is copyright. Content authors, instructors, tutors, facilitators and other learning material developers should consider the
others intellectual property rights during the preparing e-learning materials and institutes should check the copyright infringements
(Papp, 2000).
7. Conclusions
This study attempted to propose an e-learning evaluation model comprising a collective set of measures associated with an e-
learning system. The research in this paper sought to empirically test the constructs of this proposed conceptual model via a
survey instrument and to demonstrate which were critical for e-learning systems effectiveness. The instrument was validated
and it has been proved that all six dimensions of the proposed e-learning evaluation model were important for e-learning
effectiveness.
Even though the statistical analyses and pertinent literature allowed the researchers to propose a comprehensive LMS evaluation
model, it is important to note that this instrument focuses on assessing the effect of each HELAM dimension on overall e-learning per-
ceived satisfaction based on student perceptions only. However, there are other stakeholders of e-learning systems such as system
developers, technicians, administrators, instructors, instructional designers, multimedia designers, online facilitators, independent eval-
uators, etc. whose perceptions are also important indicators for a complete e-learning systems evaluation. In this study, a survey instru-
ment based on HELAM with respect to student perceptions has been developed, verified and validated. For future work, HELAM could be
taken as a basis forming a starting point when developing other instruments for e-learning systems evaluation with respect to other
stakeholders’ perceptions.
However, as DeLone and McLean (2003) emphasize, information systems success is a multidimensional and interdependent construct,
and it is therefore necessary to study the interrelationships among those dimensions. Hence future research efforts should explore and test
the causal relationships among proposed dimensions within the boundary of e-learning. Another future expansion would be to check the
validity of the causal research model on different learning management systems.
The proposed model (HELAM) is not exhaustive and is open to continuous development. It is not a fixed and unchanged model. Future
studies may extend this model through adding other dimensions or criteria in parallel with changes in the e-learning field and with the
latest advances in e-learning technologies. In this regard, HELAM is composed of fundamental issues which should be perceived as very
basics for effective e-learning.
Future research may focus on the development of other instruments based on HELAM specific to various types of organizations that
reflects the characteristics of education and training practices taking place in different institutional settings, including primary and second-
ary schools, universities and companies. In conclusion, 47 measures grouped under six dimensions for evaluating e-learning systems can
greatly benefit those engaged in e-learning as they seek guidance to better understand how e-learner’s perceived satisfaction can be in-
creased and how the use of learning management systems can be improved.
Acknowledgement
This research has been partially funded by the Scientific Research Projects (BAP) Funding Center of Middle East Technical University,
Ankara, Turkey.
1292 S. Ozkan, R. Koseler / Computers & Education 53 (2009) 1285–1296
9. Appendix A
HELAM
dimensions
Measures Pertinent literature Survey instrument
question number
A. Supportive
issues
A1. Promotion Sethy (2008), Agarwal and Venkatesh (2002) Focus Group
A2. Trends (social–
political)
Khan (2005) 71, 72
A3. Ethical issues Khan (2005) 69, 70
A4. Cost Agarwal and Venkatesh (2002) 73
B. Learner ‘s
attitudes
B1. Learner attitudes
toward LMS
Torkzadeha and Van Dykeb (2002), García, Schiaffino, and Amandi (2008), Levy
(2007), Selim (2007), Piccoli et al. (2001)
12, 16, 17
B2. Learner’s computer
anxiety
Bowdish, Chauvin, and Vigh (1998), Piccoli et al. (2001), Zaharias and
Poulymenakou (2003), Hayashi, Chen, Ryan, and Wu (2004), Webster and Hackley
(1997), Sun et al. (2008)
Demographic
Questions
B3. Self efficiency Picolli et al. (2001), Zaharias and Poulymenakou (2003), Granic (2008), Hiltz and
Johnson (1990), Sun et al. (2008)
10, 12, 13, 15
B4. Enjoyable experience Holsapple and Lee-Post (2006)), Hiltz (1993)) 11
B5. Interaction with other
students and teacher
Johnson, Hornik, and Salas (2008)), Kim and Lee (2007)), Sun et al. (2008)), Islas
et al. (2007))
14, 65
B6. Learners’ study habits Levy (2006) 9, 15
B7. Student experience
level with LMS
Rosenberg (2006) 18
C. Instructor’s
attitudes
C1. Responsiveness Sun et al. (2008) 20
C2. Informativeness Shumarova and Swatman (2007), Sun et al. (2008) 19, 23
C3. Fairness Levy (2007) 19, 29
C4. Encouraging
interaction between
students
Liu and Cheng (2008), Wu, Tennyson, and Hsia (2008), Ssemugabi and Villiers
(2007)
27, 30
C5. Control over
technology
Volery and Lord (2000), Webster and Hackley (1997) 21, 22, 26
C6. Course management Dillon and Gunawardena (1995) 22
C7. Communication
ability
Picolli et al. (2001), Levy (2007) 26, 28
C8. Enjoyment Picolli et al. (2001), Webster and Hackley (1997), Dillon and Gunawardena (1995),
Islas et al. (2007), Levy (2007)
25
C9. Self-efficacy Sun et al. (2008) 24
D. System
quality
D1. Easy to use Sun et al. (2008), Shee and Wang (2008), Holsapple and Lee-Post (2006) 36, 37
D2. Security Holsapple and Lee-Post (2006) 34
D3. Reliability Shee and Wang (2008), Holsapple and Lee-Post (2006) 34
D4. Usability Picolli et al. (2001); Dillon and Gunawardena (1995) 40, 44, 38
D5. Maintenance Martinez-Torres et al. (2008), Wu et al. (2008); Shee and Wang (2008) 35
D6. Help option available 41
D7. User friendly Shee and Wang (2008); Holsapple and Lee-Post (2006) 31
D8. Well-organized Volery and Lord (2000) 32, 37
D9. Availability Holsapple and Lee-Post (2006) 39, 42
D10. Personalization Ssemugabi and De Villiers (2007), Piccoli et al. (2001), Shee and Wang (2008) 45
D11. Interactivity Islas et al. (2007), Khan (2005); Webster and Hackley (1997) 33
E. Information
content
quality
E1. Curriculum
management
Papp (2000), Pawlowski (2002) 46, 47
E2. Course flexibility Sun et al. (2008) 52
E3. Interactive content Picolli et al. (2001) 52, 53
E4. Learning model Picolli et al. (2001) 51
E5. Tutorial quality Littlejohn, Falconera, and Mcgillb (2008), Webster and Hackley (1997) 59, 57, 60
E6. Clarity Holsapple and Lee-Post (2006) 55, 57, 60
E7. Sufficient content Holsapple and Lee-Post (2006) 49, 50
E8. Learner assessment
Material quality
Khan (2005) 57
E9. Maintenance Littlejohn et al. (2008) 58
E10. Up-to-datedness Shee and Wang (2008); Holsapple and Lee-Post (2006) 50
E11. Well-organized Holsapple and Lee-Post (2006) 51
F. Service
quality
F1. Student tracking Volery and Lord (2000)), Islas et al. (2007)) 61, 62, 65
F2. Course/instruction
authorization
Islas et al. (2007) 64
F3. Course management Khan (2005) 61, 62, 66
F4. Knowledgeable Liu and Cheng (2008); Holsapple and Lee-Post (2006), Clouse and Evans (2003) 63
F5. Maintenance Martinez-Torres et al. (2008), Namc, Leeb, and Lima (2007) 67, 68
S. Ozkan, R. Koseler / Computers & Education 53 (2009) 1285–1296 1293
10. Appendix B. Helam survey instrument
B.1. Demographic questions
1. Please enter your age.
2. Please enter your sex.
3. Average time I spend on using a computer/Internet per day.
4. Average time I spend on using a computer/Internet for educational purposes per day.
5. Average time I spend on using U-Link per day is.
B.2. Overall
6. U-Link helps me to manage my learning more systematically.
7. Overall, I am satisfied with U-Link.
8. Overall, I find U-Link successful.
B.3. Learner’s perspective
9. Face-to-face education is better than distance education in learning process.
10. I can manage my ‘‘study time” effectively and easily complete assignments on time by using U-Link.
11. I enjoy attending to the U-Link sessions overall.
12. U-Link improves my success in the module.
13. I find all my educational need from U-Link.
14. U-Link makes the communication easier with instructor and other class mates for me.
15. In my studies, I am self-disciplined and find it easy to set aside reading and homework time.
16. I believe that U-Link is a very efficient educational tool.
17. U-Link helped me to become more familiar with the module.
18. I have previous experience with LMS.
B.4. Instructor attitudes
19. Instructor clearly informs the students about grading policy via U-Link.
20. The instructor returns e-mails/posts within 24 h via U-Link.
21. The instructor follows up student problems and tries to find out solution via U-Link.
22. Instructor frequently updates lecture notes and fixes all the errors and mistakes in the documents on the U-Link.
23. The instructor responds promptly to questions and concerns via U-Link.
24. The instructor is proficient with all the content used in the course.
25. The instructor created an online environment conducive and enjoyable for learning via U-Link.
26. The instructor is good at communication with students via U-Link.
27. I think communicating with the instructor via U-Link is important and valuable.
28. I find it easy to communicate with the instructor via U-Link.
29. Exam and assignment results are announced on time via U-Link.
30. The instructor encourages us to interact with other students by using U-Link interactive tools.
B.5. System quality
31. U-Link’s graphical user interface is suitable for e-learning systems.
32. The program directions and navigations are clear.
33. U-Link supports interactivity between learners and system by chat, forums, discussions, etc.
34. I have not faced any system errors on U-Link.
35. When I counter an error in the system, I can get immediate feedback by e-mail and telephone.
36. Navigation is very easy on U-Link.
37. I can find required information easily on U-Link.
38. In the U-Link system I can easily navigate where I want.
39. U-Link is easily accessible via Internet.
40. U-Link is a good educational portal and improves my learning.
41. Help option is available on the system.
42. U-Link is accessible 7 days 24 h.
43. I am informed about all the course announcements U-Link by using ‘announcements’ tool.
44. Fonts (style, color, and saturation) are easy to read in both on-screen and in printed versions.
45. When I log in, I prefer U-Link to provide me a personalized entry page (i.e., showing my progress, showing which chapters I have to revise, etc.).
B.6. Information content quality
46. Lecture notes are the core learning materials on U-Link.
47. Course content and presentation gain attention.
48. Course content and presentation are long enough to cover all content.
49. The course content is covered to an appropriate degree of breadth.
50. The content is up-to-date.
51. I find it easy to understand and follow the content in lecture notes.
1294 S. Ozkan, R. Koseler / Computers & Education 53 (2009) 1285–1296
11. 52. Lecture notes are supported by multimedia tools (flash animations, simulations, videos, audios, etc.).
53. The lecture notes are interactive.
54. Course content on the U-Link is integral.
55. Abstract concepts (principles, formulas, rules, etc.) are illustrated with concrete, specific examples.
56. Lecture notes provided to me via U-Link are very enjoyable.
57. Exam questions and assignments are clearly explained.
58. Supporting materials, web-links and given examples are up-to-date, real-life examples, they improve my learning.
59. Vocabulary and terminology used are appropriate for the learners.
60. The learning objectives of the module are stated clearly on U-Link.
B.7. Service quality
61. Instructor’s attitudes are good to learners.
62. Instructor’s attitudes are friendly to learners.
63. Instructor is knowledgeable enough about content.
64. The service supported by the university is good enough.
65. I can contact with the instructor via mail or phone or fax.
66. I do not encounter any problems during communicating with university administration and help desk.
67. I do not experience any problems during registrations.
68. I can easily solve when I encounter a problem during admission to a module in registrations.
B.8. Supportive issues
69. U-Link lecture notes are prepared by obeying the ethical and legal issues.
70. The U-Link supported module provides any ethics policies that outline rules, regulations, guidelines, and prohibitions.
71. If the use of U-Link was optional, I would still prefer to use U-Link as a supportive tool as it helps my performance in the module.
72. If it was trendier and more popular, I would prefer to take this module totally online from home without having to come to the face-to-face lectures.
73. U-Link helps me to cut-down my expenditure such as paper cost, communication cost (i.e., phone), transportation cost, etc.
References
Agarwal, R., & Venkatesh, V. (2002). Assessing a firm’s web presence: A heuristic evaluation procedure for the measurement of usability. Information Systems Research, 13(2),
168–186.
Arbaugh, J. B. (2002). Managing the on-line classroom: A study of technological and behavioral characteristics of web-based MBA courses. Journal of High Technology
Management Research, 3, 203–223.
Arbaugh, J. B., & Duray, R. (2002). Technological and structural characteristics, student learning and satisfaction with web-based course: An exploratory study of two on-line
MBA programs. Management Learning, 33(3), 331–347.
Arbaugh, J. B., & Fich, R. B. (2007). The importance of participant interaction in online environments. Decision Support Systems, 43(2), 853–865.
Berge, Z. L. (2000). Evaluation web-based training programs. In B. H. Khan (Ed.), Web-based training (pp. 515–522). Englewood Cliffs, NJ: Educational Technology Publication.
Bowdish, B., Chauvin, S., & Vigh, S. (1998). Comparing student learning outcomes in hypermedia and analog assisted lectures. In Paper presented at the American Educational
Research Association. San Diego, California.
Carmines, E. G., & Zeller, R. A. (1994). Reliability and validity assessment. In M. Lewis-Beck (Ed.), Basic measurement (pp. 1–58). London: Sage.
Clouse, S. F., & Evans, G. E. (2003). Graduate business students performance with synchronous and asynchronous interaction e-learning methods. Decision Sciences Journal of
Innovative Education, 1(2), 181–202.
Cohen, J. (1988). Statistical power analysis for the behavioral sciences (2nd ed.). Hillsdale NJ: Erlbaum.
Collis, B. (1995). Anticipating the impact of multimedia in education: Lessons from the literature. Computers in Adult Education and Training, 2(2), 136–149.
Davis, F. D., Bagozzi, R. P., & Warshaw, P. R. (1989). User acceptance of computer technology: A comparison of two theoretical models. Management Science, 35(8), 982–1003.
DeLone, W. H., & McLean, E. R. (2003). The delone and mclean model of information systems success: A ten-year update. Journal of Management Information System, 19(4),
9–30.
Dillon, C. L.,& Gunawardena, C. N. (1995). A framework for the evaluation of telecommunications-based distance education. In Selected Papers from the 17th Congress of the
International Council for Distance Education (Vol. 2, pp. 348–351). Milton Keynes: Open University..
Douglas, E., & Van Der Vyver, G. (2004). Effectiveness of e-learning course materials for learning database management systems: An experimental investigation. Journal of
Computer Information System, 41(4), 41–48.
Eccles, R. G. (1991). The performance measurement manifesto. Harvard Business Review, 69(1), 131–137.
Fowler, F. J. (1993). Survey research methods. Newbury Park, CA: Sage Publication.
García, P., Schiaffino, S., & Amandi, A. (2008). An enhanced Bayesian model to detect students’ learning styles in web-based courses. Journal of Computer Assisted Learning,
24(4), 305–315.
Gelderman, M. (1998). The relation between user satisfaction, usage of information systems and performance. Information Management, 34(1), 11–18.
Gilbert, J. (2007). E-learning: The student experience. British Journal of Educational Technology, 38(4), 560–573.
Granic, A. (2008). Experience with usability evaluation of e-learning systems. Universal Access in the Information Society, 7(4), 209–221.
Hayashi, A., Chen, C., Ryan, T., & Wu, J. (2004). The role of social presence and moderating role of computer self efficacy in predicting the continuance usage of e-learning
systems. Journal of Information Systems Education, 15(2), 139–154.
Haynes, R. M., Pouraghabagher, R., & Seu, A. (1997). Interactive distance education alliance (IDEA): Collaborative model delivers on demand. The Journal: Technological Horizons
in Education, 24(8), 60–63.
Hiltz, H. R., & Johnson, K. (1990). User satisfaction with computer-mediated communication systems. Management Science, 36(6), 739–764.
Hiltz, R. S. (1993). The virtual classroom: Learning without limits via computer networks. Norwood, NJ: Ablex Corporation Publishing.
Holsapple, C. W., & Lee-Post, A. (2006). Defining, assessing, and promoting e-learning success: An information systems perspective. Decision Sciences Journal of Innovative
Education, 4(1), 67–85.
Hong, K. S., Lai, K. W., & Holton, D. (2003). Students’ satisfaction and perceived learning with web-based course. Educational Technology and Society, 6(1), 116–124.
Islas, E., Pérez, M., Rodriguez, G., Paredes, I., Ávila, I., & Mendoza, M. (2007). E-learning tools evaluation and roadmap development for an electrical utility. Journal of Theoretical
and Applied Electronic Commerce Research (JTAER), 2(1), 63–75.
Jiang, M., & Ting, E. (1998). Course design, instruction, and students’ online behaviors: A study of instructional variables and student perceptions of online learning. April. San Diego,
CA: American Educational Research Association.
Johnson, R. D., Hornik, S., & Salas, E. (2008). An empirical examination of factors contributing to the creation of successful e-learning environment. International Journal of.
Human–Computer Studies, 66(5), 356–369.
Kaiser, H. F. (1974). An index of factorial simplicity. Psychometrika, 39(1), 31–36.
Kaplan-Leiserson, E. (2000). e-Learning glossary. <http://www.learningcircuits.org/glossary.html> Retrieved April 2008.
Khan, B. (2005). Managing e-learning strategies: Design, delivery, implementation and evaluation. Hershey, London, Melbourne, Singapore: Information Science Publishing.
S. Ozkan, R. Koseler / Computers & Education 53 (2009) 1285–1296 1295
12. Kim, S. W., & Lee, M. G. (2007). Validation of an evaluation model for learning management systems. Journal of Computer Assisted Learning, 24(4), 284–294.
Konradt, U., & Sulz, K. (2001). The experience of flow in interacting with a hypermedia learning environment. Journal of Educational Multimedia and Hypermedia, 10(1), 69–84.
Laudon, K. C., & Laudon, J. P. (2000). Management information systems. New Jersey: Prentice Hall International Inc.
Leidner, D. E., & Jarvenpaa, S. L. (1993). The information age confronts education: Case studies on electronic classroom. Information Systems Research, 4(1), 24–54.
Levy, Y. (2006). Assessing the value of e-learning systems. Hersley, London, Melbourne, Singapore: Information Science Publishing.
Levy, Y. (2007). Comparing dropouts and persistence in e-learning courses. Computers Education, 48(2), 185–204.
Liaw, S. S., Huang, H. M., & Chen, G. D. (2007). Surveying instructor and learner attitudes toward e-learning. Computers Education, 49(4), 1066–1080.
Littlejohn, A., Falconera, I., & Mcgillb, L. (2008). Characterising effective eLearning resources. Computers & Education, 50(3), 757–771.
Liu, N. K., & Cheng, X. (2008). An evaluation of the learning of undergraduates using e-learning in a tertiary institution in China. International Journal on E-Learning, 7(3),
427–447.
Martinez-Torres, M. R., Toral Marı́nb, S. L., Garciab, F. B., Vaizquezb, S. G., Oliva, M. A., & Torres, T. (2008). A technological acceptance of e-learning tools used in practical and
laboratory teaching, according to the European higher education area. Behaviour Information Technology, 27(6), 495–505.
Mason, R., & Rennie, F. (2007). Using Web 2.0 for learning in the community. Internet and Higher Education, 10(3), 196–203.
Namc, K., Leeb, S. G., & Lima, H. (2007). Validating E-learning factors affecting training effectiveness. International Journal of Information Management, 27(1), 22–35.
Ozkan, S., Koseler, R., & Baykal, N. (2009). Evaluating learning management systems: Adoption of hexagonal e-learning assessment model in higher education. Transforming
Government: People, Process and Policy, 3(2), 111–130.
Papp, R. (2000). Critical success factors for distance learning. In Paper presented at the Americas conference on information system. Long Beach, CA, USA.
Passerini, K., & Granger, M. J. (2000). A developmental model for distance learning using the Internet. Computers Education, 34(1), 1–15.
Pawlowski, J. (2002). Reusable models of pedagogical concepts – A framework for pedagogical and content design. In P. B. Rebelsky (Ed.). Proceedings of world conference on
educational multimedia, hypermedia and telecommunications (pp. 1563–1568). Chesapeake, VA: AACE.
Piccoli, G., Ahmad, R., & Ives, B. (2001). Web-based virtual learning environments: a research framework and a preliminary assessment of effectiveness in basic IT skills
training. MIS Quarterly, 25(4), 401–426.
Rosenberg, M. J. (2006). Beyond e-learning: Approaches and technologies to enhance organizational knowledge, learning and performance. San Francisco: Pfeiffer.
Safran, C., Helic, D., & Gütl, C. (2007). E-learning practices and Web 2.0. ICL2007. Austria: Villach.
Seddon, P. B. (1997). A respecification and extension of the DeLone and McLean Model of IS success. Information Systems Research, 8(3), 240–253.
Selim, H. M. (2007). Critical success factors for e-learning acceptance: Confirmatory factor models. International Journal of Technology Marketing, 2(2), 157–182.
Sethy, S. S. (2008). Distance education in the age of globalization: An overwhelming desire towards blended learning. Turkish Online Journal of Distance Education-TOJDE, 9(3),
1302–6488.
Shee, D. Y., & Wang, Y. S. (2008). Multi-criteria evaluation of the web-based e-learning system: A methodology based on learner satisfaction and its applications. Computers
Education, 50(3), 894–905.
Shumarova, E. & Swatman, P. A. (2007). eValue and Value-driven user responses to information technology. Electronic Markets, 17(1), 5–9.
Ssemugabi, S., & De Villiers, M. R. (2007). Usability and learning: A framework for evaluation of web-based e-learning applications. In World conference on educational
multimedia, hypermedia and telecommunication (pp. 906–913).
Ssemugabi, S., Villiers, R. (2007). A comparative study of two usability evaluation methods using a web-based e-learning application. In ACM International Conference
Proceeding Series (vol. 226, pp. 132–142). Port Elizabeth, South Africa: South African institute of computer scientists and information technologists on IT research in
developing countries.
Sun, P. C., Tsai, R. S., Finger, G., Chen, Y. Y., & Yeh, D. (2008). What drives a successful e-learning? An empirical investigation of the critical factors influencing learner
satisfaction. Computers Education, 50(4), 1183–1202.
Tabachnick, B. G., & Fidell, L. S. (2007). Using multivariate statistics (5th ed.). Boston: Allyn and Bacon.
Thurmond, V. A., Wambach, K., & Connors, H. R. (2002). Evaluation of student satisfaction: Determining the impact of a web-based environment by controlling for student
characteristics. The American Journal of Distance Education, 16(3), 169–189.
Torkzadeha, G., & Van Dykeb, T. P. (2002). Computers in Human Behavior, 18(5), 479–494.
Ullrich, C., Borau, K., Luo, H., Tan, X., Shen, L., & Shen, R. (2008). Why Web 2.0 is good for learning and for research: Principles and prototypes. In WWW 2008 (pp. 705–714).
Beijing, China.
Volery, T., & Lord, D. (2000). Critical success factors in online education. The International Journal of Educational Management, 14(5), 216–223.
Wang, S., Liaw, S., & Wang, Y. S. (2003). Assessment of learner satisfaction with asynchronous electronic learning systems. Information Management Journal, 41(1), 75–86.
Wang, Y. S., Wang, H. Y., & Shee, D. Y. (2007). Measuring e-learning systems success in an organizational context: Scale development and validation. Computers in Human
Behavior, 23(1), 1792–1808.
Webster, J., & Hackley, P. (1997). Teaching effectiveness in technology-mediated distance learning. Academy of Management Journal, 40(6), 1282–1309.
Weller, M. (2006). VLE 2.0 and future directions in learning environments. In Proceedings of The First International LAMS Conference 2006 (pp. 99–106).
Wu, J. H., Tennyson, R. D., & Hsia, T. L. (2008). Analysis of E-learning innovation and core capability using a hypercube model. Computers in Human Behavior, 24(5), 1851–1866.
Zaharias, P., & Poulymenakou, A. (2003). Identifying training needs for ict skills enhancement in south-eastern Europe: Implications for designing web-based training courses.
Educational Technology and Society, 6(1), 27–39.
Zoltan, E., & Chapanis, A. (1982). What do professional persons think about computers? Behavior and Information Technology, 1(1), 55–68.
1296 S. Ozkan, R. Koseler / Computers & Education 53 (2009) 1285–1296