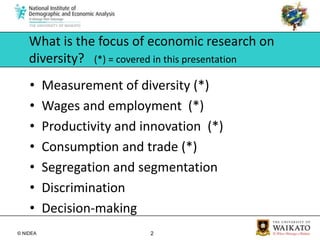
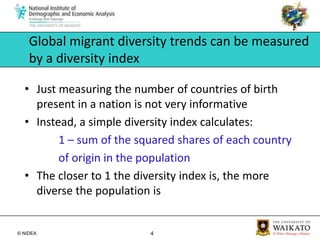
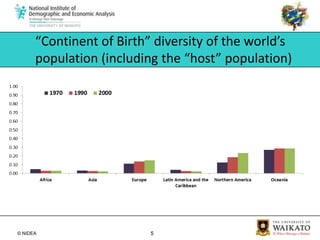
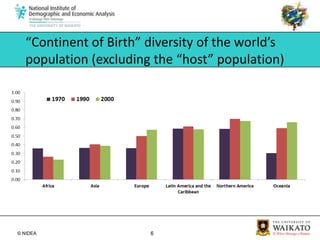
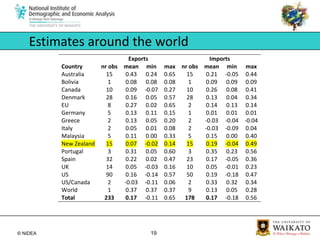
Economic research on diversity: international perspectivesJacques PootProfessor of Population EconomicsDiversity Research Forum Claudelands Event Centre, HamiltonMonday 22 August 2011
What is the focus of economic research on diversity?   (*) = covered in this presentationMeasurement of diversity (*)Wages and employment  (*)Productivity and innovation  (*)Consumption and trade (*)Segregation and segmentationDiscriminationDecision-making
Diversity has many dimensionsResearch covers: gender, age, ethnicity, birthplace/nationality, disability, sexual orientation, religionThis presentation focuses on diversity through international migration only
Global migrant diversity trends can be measured by a diversity indexJust measuring the number of countries of birth present in a nation is not very informative
Instead, a simple diversity index calculates: 1 – sum of the squared shares of each country           of origin in the populationThe closer to 1 the diversity index is, the more diverse the population is“Continent of Birth” diversity of the world’s population (including the “host” population)
“Continent of Birth” diversity of the world’s population (excluding the “host” population)
Socio-economic impacts of international migration and population diversityThere is a need for  a comprehensive multidisciplinary approach: Migration Impact Assessment (MIA)MIA is not the same as Cost-Benefit Analysis (CBA)MIA is also multi-method: using quan, qual and mixed methods, and meta-analysis
A summary: Longhi et al. (2010) in Environment and Planning C – Government and PolicyWage and employment impacts of immigration on the host population are almost negligibly smallMigrants usually ‘complement’ host population work force but are ‘substitutes’ for earlier migrants with similar skillsInstitutions matter: in the US wage effects are bigger than employment effects; in Europe it is the oppositeMigration ‘greases the wheels’ of the labour marketMeta-analyses of labour market impacts
Impact of diversity on productivity and innovationForbes Insights report August 2011 “Fostering Innovation Through a Diverse Workforce”Method: survey of 321 executives of large global enterprises; some in-depth interviews Conclusions:Diversity is a key driver of innovation and success on a global scale!Competition for ‘talent’ is fierce in today’s global economyThere has been a lot of progress on gender and ethnic diversity/inclusion, but less on disability and age
Diversity and innovation: Research on patent applicationsEuropean data2001
Patent applications per million inhabitants andthe share of foreign residents in 170 NUTS 2 regions in 1991 and 2001Positive relationship, but not necessarily linearThe correlation coefficient increased from 0.33 to 0.48The patents pattern is less clustered in 2001
Economists are trying hard to solve the causality problem by new techniques:Finding ‘instrumental variables’Finding ‘counterfactuals’Using ‘natural experiments’Using policy-linked randomizationIn the case of diversity and innovation research, we found an interesting ‘instrument’Does correlation imply causation?
 EU12 NUTS2 regions |      Obs        Mean        Std. Dev.       Min        Max-------------+-------------------------------------------------------- McDonald’s (number) |       340    26.95882    24.74134          0        189 Per million population |       340    13.49947    7.086818          0       33.6Other instruments: the presence of a capital city; the area of the region
Impact of diversity on patent applications in EuropeAn increase in the diversity index by 0.1 from the regional mean of 0.5 increases patent applications per million inhabitants by about 0.2 percent!
From macro to micro: Dutch data on innovationThis study combines  4 confidential  high-quality firm/individual level micro-datasets obtained from Statistics Netherlands. Social Statistics Survey (SSB_Banen - REOS) – 10 million obs.Community Innovation Survey (CIS 3.5), (Survey + Census of firms with >100  empl.) 	10 000 obs.Dutch Labour Force Survey (EBB) – 83 000 obs.Dutch Municipality registrations (GBA) – 16 million obs.CIS: is a regular snapshot of infrastructure /inputs /outputs /obstacles of innovation by firms EBB: is a regular screening of labour market and employees on household /ethnicity /country of birth /job situation /education /trade union /commuting 15
Results from the analysis of Dutch data“Solving” the causality problem with instruments for predicting predict the share of foreign born in the firm in 2002: the number of foreign restaurants per 10 000 municipality population the migrant population stock in 1996 Main conclusion: Employing more migrants does not boost innovation, but, among those firms that hire skilled immigrants, greater diversity of the foreign workers enhances product innovation!
Channels through which immigrants influence trade Population growth through migration increases aggregate demand: increases importsImmigrants have a preference for home country products (ethnic goods and services): increases importsHowever, once demand is large enough, firms may produce home country goods locally: lowers importsIf immigrants contribute to making firms more efficient, international competitiveness increases: increases exports, lowers importsMigrant networks reduce transaction costs  through better information exchange, facilitating communication in foreign language, enhanced trust in trading relationship, enforceability of contracts: increases both imports and exportsMigrant networks are important for both the host country (immigrants) and the home country (diaspora/expats)Meta-analysis of the impact of immigration on international trade There have been 48 studies since the 1990s that yielded more than 200 estimatesAll studies use the same theory: the ‘gravity model’ of tradeEach study reports the % change in trade when the number of immigrants in the population increases by 1%
Estimates around the world
An increase in the number of immigrants by 10 percent increases the volume of trade by about 1-2 percent. The impact is lower for trade in homogeneous goods. The migrant impact on imports is on average similar to that of exports. The migrant impact appears to be greater for migration between countries of different levels of development. Broad conclusions of the trade meta-analysis
Relevance of this MIA research for New ZealandMIA suggests generally positive or neutral economic impactsHowever, old myths die hard!NZ, Australian and Canadian policies are generally seen as better than elsewhere, consequently:(1) are expected to yield even better impacts(2) are become ‘role model’ for policy development
Hodgson and Poot (2010) New Zealand Research on the Economic Impacts of Immigration 2005–2010 - Synthesis and research agenda. Download from http://www.dol.govt.nz/publications/research/synthesis-research/Nijkamp, Poot and Sahin (eds.) (2012) Migration Impact Assessment: New Horizons. Edward Elgar.Interested in more details?
       Thank you!
Economic research on diversity

Economic research on diversity

  • 1.
    Economic research ondiversity: international perspectivesJacques PootProfessor of Population EconomicsDiversity Research Forum Claudelands Event Centre, HamiltonMonday 22 August 2011
  • 2.
    What is thefocus of economic research on diversity? (*) = covered in this presentationMeasurement of diversity (*)Wages and employment (*)Productivity and innovation (*)Consumption and trade (*)Segregation and segmentationDiscriminationDecision-making
  • 3.
    Diversity has manydimensionsResearch covers: gender, age, ethnicity, birthplace/nationality, disability, sexual orientation, religionThis presentation focuses on diversity through international migration only
  • 4.
    Global migrant diversitytrends can be measured by a diversity indexJust measuring the number of countries of birth present in a nation is not very informative
  • 5.
    Instead, a simplediversity index calculates: 1 – sum of the squared shares of each country of origin in the populationThe closer to 1 the diversity index is, the more diverse the population is“Continent of Birth” diversity of the world’s population (including the “host” population)
  • 6.
    “Continent of Birth”diversity of the world’s population (excluding the “host” population)
  • 7.
    Socio-economic impacts ofinternational migration and population diversityThere is a need for a comprehensive multidisciplinary approach: Migration Impact Assessment (MIA)MIA is not the same as Cost-Benefit Analysis (CBA)MIA is also multi-method: using quan, qual and mixed methods, and meta-analysis
  • 8.
    A summary: Longhiet al. (2010) in Environment and Planning C – Government and PolicyWage and employment impacts of immigration on the host population are almost negligibly smallMigrants usually ‘complement’ host population work force but are ‘substitutes’ for earlier migrants with similar skillsInstitutions matter: in the US wage effects are bigger than employment effects; in Europe it is the oppositeMigration ‘greases the wheels’ of the labour marketMeta-analyses of labour market impacts
  • 9.
    Impact of diversityon productivity and innovationForbes Insights report August 2011 “Fostering Innovation Through a Diverse Workforce”Method: survey of 321 executives of large global enterprises; some in-depth interviews Conclusions:Diversity is a key driver of innovation and success on a global scale!Competition for ‘talent’ is fierce in today’s global economyThere has been a lot of progress on gender and ethnic diversity/inclusion, but less on disability and age
  • 10.
    Diversity and innovation:Research on patent applicationsEuropean data2001
  • 11.
    Patent applications permillion inhabitants andthe share of foreign residents in 170 NUTS 2 regions in 1991 and 2001Positive relationship, but not necessarily linearThe correlation coefficient increased from 0.33 to 0.48The patents pattern is less clustered in 2001
  • 12.
    Economists are tryinghard to solve the causality problem by new techniques:Finding ‘instrumental variables’Finding ‘counterfactuals’Using ‘natural experiments’Using policy-linked randomizationIn the case of diversity and innovation research, we found an interesting ‘instrument’Does correlation imply causation?
  • 13.
    EU12 NUTS2regions | Obs Mean Std. Dev. Min Max-------------+-------------------------------------------------------- McDonald’s (number) | 340 26.95882 24.74134 0 189 Per million population | 340 13.49947 7.086818 0 33.6Other instruments: the presence of a capital city; the area of the region
  • 14.
    Impact of diversityon patent applications in EuropeAn increase in the diversity index by 0.1 from the regional mean of 0.5 increases patent applications per million inhabitants by about 0.2 percent!
  • 15.
    From macro tomicro: Dutch data on innovationThis study combines 4 confidential high-quality firm/individual level micro-datasets obtained from Statistics Netherlands. Social Statistics Survey (SSB_Banen - REOS) – 10 million obs.Community Innovation Survey (CIS 3.5), (Survey + Census of firms with >100 empl.) 10 000 obs.Dutch Labour Force Survey (EBB) – 83 000 obs.Dutch Municipality registrations (GBA) – 16 million obs.CIS: is a regular snapshot of infrastructure /inputs /outputs /obstacles of innovation by firms EBB: is a regular screening of labour market and employees on household /ethnicity /country of birth /job situation /education /trade union /commuting 15
  • 16.
    Results from theanalysis of Dutch data“Solving” the causality problem with instruments for predicting predict the share of foreign born in the firm in 2002: the number of foreign restaurants per 10 000 municipality population the migrant population stock in 1996 Main conclusion: Employing more migrants does not boost innovation, but, among those firms that hire skilled immigrants, greater diversity of the foreign workers enhances product innovation!
  • 17.
    Channels through whichimmigrants influence trade Population growth through migration increases aggregate demand: increases importsImmigrants have a preference for home country products (ethnic goods and services): increases importsHowever, once demand is large enough, firms may produce home country goods locally: lowers importsIf immigrants contribute to making firms more efficient, international competitiveness increases: increases exports, lowers importsMigrant networks reduce transaction costs through better information exchange, facilitating communication in foreign language, enhanced trust in trading relationship, enforceability of contracts: increases both imports and exportsMigrant networks are important for both the host country (immigrants) and the home country (diaspora/expats)Meta-analysis of the impact of immigration on international trade There have been 48 studies since the 1990s that yielded more than 200 estimatesAll studies use the same theory: the ‘gravity model’ of tradeEach study reports the % change in trade when the number of immigrants in the population increases by 1%
  • 18.
  • 19.
    An increase inthe number of immigrants by 10 percent increases the volume of trade by about 1-2 percent. The impact is lower for trade in homogeneous goods. The migrant impact on imports is on average similar to that of exports. The migrant impact appears to be greater for migration between countries of different levels of development. Broad conclusions of the trade meta-analysis
  • 20.
    Relevance of thisMIA research for New ZealandMIA suggests generally positive or neutral economic impactsHowever, old myths die hard!NZ, Australian and Canadian policies are generally seen as better than elsewhere, consequently:(1) are expected to yield even better impacts(2) are become ‘role model’ for policy development
  • 21.
    Hodgson and Poot(2010) New Zealand Research on the Economic Impacts of Immigration 2005–2010 - Synthesis and research agenda. Download from http://www.dol.govt.nz/publications/research/synthesis-research/Nijkamp, Poot and Sahin (eds.) (2012) Migration Impact Assessment: New Horizons. Edward Elgar.Interested in more details?
  • 22.
    Thank you!

Editor's Notes

  • #11 This map refers to 2001