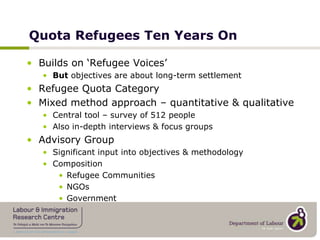
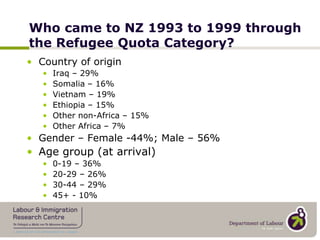
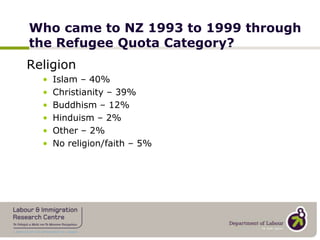
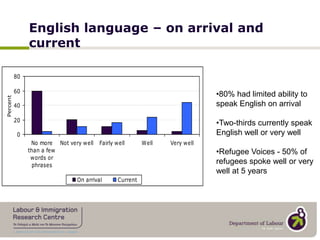
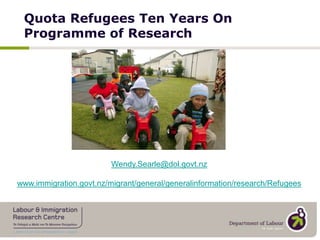
22 August 2011IMSED ResearchKeith McLeod & Wendy Searle
IMSED Research“… lead role within the New Zealand Government for research and evaluation regarding International Migration, Settlement, and Employment Dynamics.”Now part of the …Labour and Immigration Research Centre
Work programmeReflects Department and Government prioritiesCore work informing policy and servicesStrategic labour market projectsMix of Research, Evaluation and Monitoring
Flagship programmesLongitudinal Immigration Survey: New Zealand (LisNZ)Migration trends monitoring programmeSurvey monitoring programmeLEED-Migration data integration projectQuota refugees ten years on
Quota Refugees Ten Years OnProgramme of research
Quota Refugees Ten Years OnBuilds on ‘Refugee Voices’But objectives are about long-term settlementRefugee Quota CategoryMixed method approach – quantitative & qualitativeCentral tool – survey of 512 peopleAlso in-depth interviews & focus groupsAdvisory GroupSignificant input into objectives & methodologyCompositionRefugee CommunitiesNGOsGovernment
Who came to NZ 1993 to 1999 through the Refugee Quota Category?Country of originIraq – 29%Somalia – 16%Vietnam – 19%Ethiopia – 15%Other non-Africa – 15%Other Africa – 7%Gender – Female -44%; Male – 56%Age group (at arrival)0-19 – 36%20-29 – 26%30-44 – 29%45+ - 10%
Who came to NZ 1993 to 1999 through the Refugee Quota Category?ReligionIslam – 40%Christianity – 39%Buddhism – 12%Hinduism – 2%Other – 2%No religion/faith – 5%
New Land, New Life
Language & Education
English language – on arrival and current80% had limited ability to speak English on arrival
Two-thirds currently speak English well or very well
Refugee Voices - 50% of refugees spoke well or very well at 5 yearsHighest qualificationWho was most likely to have done no schooling?Those aged 45+ (24%)Employment & Income
Employment73% had worked in a paid job in NZWho was most likely to have worked in a paid job in NZ?Men (82%)Those who were younger18-29 - 89%30-44 - 80%
Activities in last 7 days38% had worked for payWho was most likely to have worked for pay?Men (48%)
Younger age groups
18-29 (42%)
30-44 (45%)How does this compare?Refugee Voices – 29% of established refugees were workingLISNZ – 76% were employed at 3 yearsNZ General Population (2009)72.9% of 15-64 year olds were employedMaori – 61.7%Pacific peoples – 56.8%
Main source of income in last 12 months
Housing
Home ownership16% owned their own house2006 Census NZ population - 53%Pacific Peoples – 22%LISNZ Survey 52% of migrants owned their own house after 3 years
For those who don’t own their home - who owns the house/flat you live in?Housing New Zealand Corporation – 47%Private person, trust or business – 34%Family member – 14%Local City Council – 5%
Health & Wellbeing
Health & Wellbeing Thinking about your health, in general  would you say your health is excellent, very good, good, fair or poor?47% rated their health as excellent/very goodWho was most likely to say that their health was fair/poor?those aged 45+ (30%)How does this compare?Refugee Voices45% rated their health as excellent or very good25% rated their health as fair or poorNZ Health Survey 06/0760% rated their health as excellent or very good10% rated their health as fair or poorLISNZ76% rated their health as excellent or very good
Social networks
Close friends in NZHow many of your close friends are (many or some)Own ethnic group – 94%
NZ European/Maori – 73%
Other ethnic group – 72%Social networksHow have you made friends in NZ from outside your ethnic community?
Social networksWhich, if any, of the following groups have you participated in in the past 12 months?
Identity & Belonging
Identity and participationHow strongly do you feel part of NZ and own ethnic group?
Identity and participationCitizenship91% had taken up NZ citizenship & 3% were in processVoting91% had voted in any NZ general electionsNZ populationVoter turnout 2006 – 76%
Recognition &legitimacyIdentity & Belonging
SafetyIn New Zealand – 93% felt very safe/safeAt work – 91%In your neighbourhood – 91%
Help needed Have you needed help with any of these things in the past 12 months?
YouthYouth
Outcomes for youth (18-29)English language94% - were able to speak English well or very well (68% overall)Employment89% had worked in a paid job (73% overall)Health & wellbeing73% said their health was excellent or good (47% overall)Social Networks46% had many close NZ European/Maori friends (24% overall)
Next Steps
Next StepsMore detailed analysis on the survey dataQualitative research25 in-depth interviewsPathways to employment & economic contribution (paid and unpaid)Focus Groups - 6English language acquisition, service provision, movements to Australia

IMSED research

  • 1.
    22 August 2011IMSEDResearchKeith McLeod & Wendy Searle
  • 2.
    IMSED Research“… leadrole within the New Zealand Government for research and evaluation regarding International Migration, Settlement, and Employment Dynamics.”Now part of the …Labour and Immigration Research Centre
  • 3.
    Work programmeReflects Departmentand Government prioritiesCore work informing policy and servicesStrategic labour market projectsMix of Research, Evaluation and Monitoring
  • 4.
    Flagship programmesLongitudinal ImmigrationSurvey: New Zealand (LisNZ)Migration trends monitoring programmeSurvey monitoring programmeLEED-Migration data integration projectQuota refugees ten years on
  • 5.
    Quota Refugees TenYears OnProgramme of research
  • 6.
    Quota Refugees TenYears OnBuilds on ‘Refugee Voices’But objectives are about long-term settlementRefugee Quota CategoryMixed method approach – quantitative & qualitativeCentral tool – survey of 512 peopleAlso in-depth interviews & focus groupsAdvisory GroupSignificant input into objectives & methodologyCompositionRefugee CommunitiesNGOsGovernment
  • 7.
    Who came toNZ 1993 to 1999 through the Refugee Quota Category?Country of originIraq – 29%Somalia – 16%Vietnam – 19%Ethiopia – 15%Other non-Africa – 15%Other Africa – 7%Gender – Female -44%; Male – 56%Age group (at arrival)0-19 – 36%20-29 – 26%30-44 – 29%45+ - 10%
  • 8.
    Who came toNZ 1993 to 1999 through the Refugee Quota Category?ReligionIslam – 40%Christianity – 39%Buddhism – 12%Hinduism – 2%Other – 2%No religion/faith – 5%
  • 9.
  • 10.
  • 11.
    English language –on arrival and current80% had limited ability to speak English on arrival
  • 12.
    Two-thirds currently speakEnglish well or very well
  • 13.
    Refugee Voices -50% of refugees spoke well or very well at 5 yearsHighest qualificationWho was most likely to have done no schooling?Those aged 45+ (24%)Employment & Income
  • 14.
    Employment73% had workedin a paid job in NZWho was most likely to have worked in a paid job in NZ?Men (82%)Those who were younger18-29 - 89%30-44 - 80%
  • 15.
    Activities in last7 days38% had worked for payWho was most likely to have worked for pay?Men (48%)
  • 16.
  • 17.
  • 18.
    30-44 (45%)How doesthis compare?Refugee Voices – 29% of established refugees were workingLISNZ – 76% were employed at 3 yearsNZ General Population (2009)72.9% of 15-64 year olds were employedMaori – 61.7%Pacific peoples – 56.8%
  • 19.
    Main source ofincome in last 12 months
  • 20.
  • 21.
    Home ownership16% ownedtheir own house2006 Census NZ population - 53%Pacific Peoples – 22%LISNZ Survey 52% of migrants owned their own house after 3 years
  • 22.
    For those whodon’t own their home - who owns the house/flat you live in?Housing New Zealand Corporation – 47%Private person, trust or business – 34%Family member – 14%Local City Council – 5%
  • 23.
  • 24.
    Health & WellbeingThinking about your health, in general would you say your health is excellent, very good, good, fair or poor?47% rated their health as excellent/very goodWho was most likely to say that their health was fair/poor?those aged 45+ (30%)How does this compare?Refugee Voices45% rated their health as excellent or very good25% rated their health as fair or poorNZ Health Survey 06/0760% rated their health as excellent or very good10% rated their health as fair or poorLISNZ76% rated their health as excellent or very good
  • 25.
  • 26.
    Close friends inNZHow many of your close friends are (many or some)Own ethnic group – 94%
  • 27.
  • 28.
    Other ethnic group– 72%Social networksHow have you made friends in NZ from outside your ethnic community?
  • 29.
    Social networksWhich, ifany, of the following groups have you participated in in the past 12 months?
  • 30.
  • 31.
    Identity and participationHowstrongly do you feel part of NZ and own ethnic group?
  • 32.
    Identity and participationCitizenship91%had taken up NZ citizenship & 3% were in processVoting91% had voted in any NZ general electionsNZ populationVoter turnout 2006 – 76%
  • 33.
  • 34.
    SafetyIn New Zealand– 93% felt very safe/safeAt work – 91%In your neighbourhood – 91%
  • 35.
    Help needed Haveyou needed help with any of these things in the past 12 months?
  • 36.
  • 37.
    Outcomes for youth(18-29)English language94% - were able to speak English well or very well (68% overall)Employment89% had worked in a paid job (73% overall)Health & wellbeing73% said their health was excellent or good (47% overall)Social Networks46% had many close NZ European/Maori friends (24% overall)
  • 38.
  • 39.
    Next StepsMore detailedanalysis on the survey dataQualitative research25 in-depth interviewsPathways to employment & economic contribution (paid and unpaid)Focus Groups - 6English language acquisition, service provision, movements to Australia