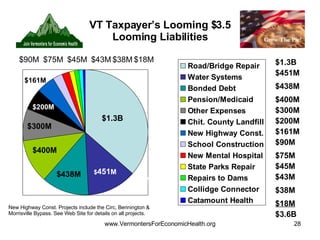
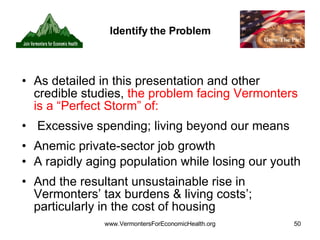
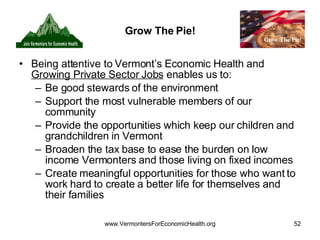
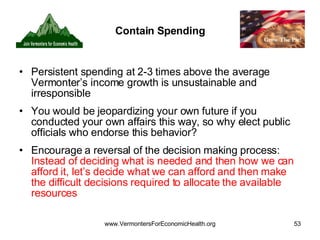
Vermonters for Economic Health Presents “ The Truth You Need To Hear” “ The multitudes remained plunged in ignorance of the simplest economic facts, and their leaders, seeking their votes, did not dare to undeceive them.” - Winston Churchill
Who are Vermonters For  Economic Health (VEH)? VEH is a grassroots, citizen-led organization.  Our mission is simple: To promote economic health and fiscal responsibility in government.
We’ll Examine . . . A brief overview of our federal fiscal health, and then examine… Vermont’s: Tax Burdens and Trends Spending and Expenses  Job Growth Demographics Solutions and  What You Can Do
The State of our Nation “ Arguably the biggest threat facing the U.S. today is our own  Fiscal Irresponsibility , and very few people are willing to  State the Facts  and  Speak the Truth .” “ Continuing on this  Unsustainable Path  will gradually erode, if not suddenly damage, our Economy, our Standard of Living, and ultimately our Domestic Tranquility and National Security.”   David Walker, Comptroller General of the U.S, 2006   “ Fiscal Wake-up Tour”:  http:// www.youtube.com/watch?v =OS2fI2p9iVs
In 8 years, Medicare & SS go cash-flow negative; In 20*, all Revenues go to Entitlements & Debt Federal Spending As a Percent of Gross Domestic  Product *Data   before   Medicare’s Prescription Drug Benefit implementation.  Source: GAO’s March 2002 analysis Federal Revenue Line Our Children’s Future; Our Legacy to them Spending Worker/Retiree Ratio: 4.9  2.8   This piece gets eaten up by the  Prescription drug benefit. An over $50 trillion projected  entitlement deficit.
The Effect of Medicare’s new  Prescription Drug Program … As the next chart will show… Costs shifted from Private Insurance, Out-of-Pocket and Medicaid to... Medicare, thus… Exacerbating an already Exploding Entitlement Cost Crisis…
% Sources of funds  for retail prescription drugs
Our Crisis: Unsustainable  & Out-of-Control Spending … The next chart will show the effects of Out-of-Control Medical Costs with… An aging Demographics with less younger workers supporting a growing elderly population… Consuming more of our nation’s resources…
National Health Spending as a Percentage of GDP Source: Centers for Medicare and Medicaid Services GDP = Gross Domestic Product
Other Federal  Challenges … The U.S. dollar has fallen in value roughly 50% against the Euro & other major currencies since 2002;  a major contributor to our rise in oil prices. Our national debt stands at about $10 trillion; almost half of which is owned by foreigners;  aiding in the continued decline of federal assistance to the states. The value of hydrocarbon exports from the Middle East and Central Asia is expected to approach $750 billion in 2008.  -  This is almost Four-Times the level in 2001;  a shifting world power is occurring before our eyes;  Sovereign Wealth Funds are an example.
Changes in the Price of Oil, in Dollars, Euros & Gold $100/Barrel Oil $57/Barrel Oil $30/Barrel Oil The value of the dollar is the market’s measure of its confidence that our government will preserve the purchasing power of its debt,  almost half of which is held Overseas. Bloomberg/WSJ 1/4/08 Had the dollar remained “as good as gold” since 2001, Oil today would be selling at  $30 a Barrel, not $100. Had the dollar remained as strong as the Euro since 2001, Oil today would be selling at  $57 a Barrel, not $100.
A Hard Truth … A  “Sense of Urgency”  is critical in Vermont. The 20 th  Century was more or less dominated -  economically and politically  - by the U.S. The 21 st  Century will not be so kind to us… It’s time to leave our unsustainable and  – more so with Vermont - sentimental visions behind… and make the tough calls.
VERMONT TAXES
Where Vermont Generates Its Tax Revenues 30% 20% 15% Source: Vermont Comprehensive Annual Financial Report.  Fiscal year ending 6/30/06. Total Revenues were approximately $3.8 billion 12% 12% 8% 3%
Why Should You Be Concerned? Source: State of Vermont Comprehensive Annual Financial Report FY 2002 – 2007; Consumer Price Index VTs gov’t payroll & employee benefit costs grew 70% since 2000.  (BFP 3/19/08) School spending has grown from $813 million in 1999 to $1.3 billion in 2007”; a 60%  increase.  -  R. Herald, 2/1/07
VT’s Tax Burden Ranking Source: The Tax Foundation; Bureau of Economic Analysis; Commerce Department Vermont Is Now the 3 rd  Most Taxed State In The Nation (1 = Highest Burden) 3 2006 3 2005 5 2004 16 2003 14 2002 14 2001 13 2000 Tax Burden Rank Year
The Gap Between Vermonters’ Taxes and the Average American’s is at a 28 Year High The difference between VT’s 13.2%* share and the national 11.3% share amounts to $372 million more in VT taxes,  or $1,500 per household , than if our taxes were at the national average. * Increased further to 14.9% in 2007. Based on 2005 data.  Source: The Vermont Economy Newsletter and The Tax Foundation
Every Revenue Source Is Being Squeezed Source: VT Department of Taxes
Cumulative % of Income Taxes Paid: By Income Level & Number of Filers 26% of Taxes Paid, 2,113 Tax Filers; 0.69% of Filers 38% Paid, 6,970 Filers; 2.29% 49% 15,200; 4.99% 98% 185,534; 61% 60% 27,632; 9.08% 75% Paid 58,415; 19.20% 91% Paid 121,827; 40.04% 100% 304,254; 100% Source: Vt. Comprehensive Annual Financial Report, 2007 $75,000 & up pay 60% of Taxes Start here, move clockwise … Top 5% pays about 50%
% Share of State Income   Taxes Paid by Income Level $300K & More $150- $300 $100- $150 $75- $100 $50- $75 $10- $25 $25- $50 $10K & lower Out of State Source: Vt. Comprehensive Annual Financial Report, 2006  Data from Taxable Year 2005 Vt’s Public Assets Inst. found a net loss of folks in 2006; yet the incomes of  those coming in were 18% higher vs. those who left.  (BFP 3/24/08) The % of $75,000 & up filers has doubled While the lower end has fallen How long can this trend last?
Consequences Of These Tax And Social Policies Rather than  create jobs & its wealth effect ,  Vermont imports its wealth through the importation of wealthy people.   Thus, Vermont creates its own income-disparity as it redistributes that wealth. Social Mobility is obstructed and prevented  – No need for Job Creation. No Opportunities…  Ultimately creating a ‘Voting Block of Dependents’ and  the kind of “Class-Warfare” of the ‘haves’ and ‘have-nots’ that politicians can then run on.  Culminating in John Edward’s “Two Americas” scenario.
VERMONT SPENDING
How Does Vermont Spend its Revenues?  39% 36% 75% 7.5% 6% 5% Source: Vermont Comprehensive Annual Financial Report.  Fiscal year ending 6/30/06.  75% of Revenues Go Towards Education and Human Services
How Has Various VT Government Spending Grown Recently? Source: Vermont Comprehensive Annual Financial Report.  Fiscal year ending 6/30/06.  * A 2003 Census study showed VT has about 50% more state employees per capita than the national average.
Student Enrollment Down - Employment and Costs Up Source: Summary of the Annual Statistical Report of Schools (SASR) FY 1997 - 2006 1997: Act 60 Implementation Student Growth = -9.1%; Teacher and Staff Growth = +20.8% 106,341 96,636 15,783 19,069 94,000 96,000 98,000 100,000 102,000 104,000 106,000 108,000 1997 1998 1999 2000 2001 2002 2003 2004 2005 2006 15,000 16,000 17,000 18,000 19,000 20,000 Students Teachers and Staff
VT’s Student : Teacher Ratio Is Now The Second Lowest In The Country Source: U.S. Department of Labor NCES Publication 2007-352
As Vermont’s  Roads and Bridges Crumble … “ A report, prepared by the Legislature's fiscal analysts for the House Transportation Committee, predicts that at current funding levels,  the state will face an  annual budget shortfall  of $203 million for maintaining its transportation system.” “ Over the next 30 years,  the state could face an overall shortage of $6 billion in transportation revenue,  according to the report.”  -  Times Argus, 1/13/08
VT Taxpayer’s Looming $3.5 Looming Liabilities $451M $1.3B $ 451 M $400M $90M $75M $43M $18M $161M $200M $45M New Highway Const. Projects include the Circ, Bennington & Morrisville Bypass. See Web Site for details on all projects. $300M $1.3B $438M $451M $438M $400M $300M $200M $161M $90M $75M $45M $43M $18M $38M $38M $3.6B
VERMONT JOBS
2007 Year-End Review of Vermont Business Jobs Lost MetroGroup - Rutland  200 Dirigo Mill - Gilman  115 Qimonda - Williston 135 Standard Register - Middlebury 112 Omya Industries - Protor  50 Vermont Plywood LLC - Hancock 35 Northern Power Sys. - Waitsfield & Barre  60 TD Banknorth Inc. – Various Locations 30 Specialty Filaments - Middlebury  180 Neo EMS - Brandon  20 Wausau Mill - Northumberland  35 Total Job Losses  972 No job gains reported; Only “plans” for future jobs. Standard Register was acquired by Connor Homes; 65 of the 112 jobs returned .  Specialty Filaments was acquired by Monahan; about 120 of the 180 lost jobs returned. Source: WCAX’s / BFP ‘07  Review on VT Business
Let’s Play:  Jeopardy! Answer: 0%
Source: Public Assets Institute Since 2001’s recession,  private sector job growth in Vermont has essentially been  0% . (In thousands) Question: What Was VT’s Private Sector Job Growth From 2000-2006?
What Kinds Of Jobs Are Being Created?
Vermont’s Job Growth March ’06 – March ‘07 Private-Sector Jobs =  Lost  - 442 Government Jobs  =  Gained  +  445   Net  + 3 Source: Vermont Economy Newsletter, December, 2007
The Paradox  Of Our Self-Fulfilling Prophesy Vermont is literally “Eating its Own” as it replaces Private-Sector taxpaying business with government and non-profit (non-taxpaying) entities… Resulting in greater tax burdens on our shrinking private-sector economy and existing residential property taxpaying citizens. Our Legislature then steps in with its social assistance to fill this void.
What Vermont’s Public Assets Institute says … “ Many of Vermont’s new jobs are low-paying service jobs.”  “ What’s needed in Vermont are good-paying jobs that take full advantage of [its] work force assets.” “ This would require our Government & Community leaders working together  to develop an economic environment  that makes the use of these assets a State Priority.”
What Others Say: Vermont Doesn’t Need Higher Taxes,  It Needs a Broader Tax Base! Former Federal Reserve Chairman Alan Greenspan concurred with the following statement: “ Over Time, Tax Revenues Are  Determined By  Economic  and  Productivity   Growth .”
Why Economic & Productivity  Growth is Key to our Economic Survival   Money is wealth to people because it allows them to buy stuff with it: Groceries, cars etc. Money may not be wealth to a Nation if the Production of Goods and Services does not keep pace with the claims against them. Trillions of dollars of debt and trillions more in retirement dollars from baby-boomers will be “cashed in” someday to buy “stuff”. If there’s not enough “stuff” to go around; claims become worth less & Inflation occurs.
“ Truth And Consequences”  Presents  “ Growth And Consequences” … Vermont has got to get serious about creating private-sector jobs and wealth through economic and productivity growth… Our transportation infrastructure, entitlements and other  claims on our economy are growing faster than our economy… These rising outlays against a shrinking pool of wealth  will lead to lower living standards and personal hardship for our families.
What Vermont Businesses think  of the state of Vermont … The O’Neal Group, a nationally recognized “Brand Identity” firm, was retained by the state of Vermont in August of 2000  They conducted a review & analysis of the Vermont brand from the perspective of  existing businesses in Vermont . Its findings…
What Vermont Businesses think  of Vermont; Its findings … “ There is a sense among business people that Vermonters view business growth as a threat to their quality of life.” “ This mindset underlies the obstructionist & capriciousness associated with the permitting process and regulatory establishment.” Reforming the permitting process is the thing Vermont businesses want most from State government.  More tax breaks are next.
Vermont Demographics
VT’s Population Growth Is Less Than Half of the National Average
VT Retirees Double In 25 Years While The Work Force Shrinks Over 65, (Retirees) Age 6-18, (school age) Total Population Age 20-65, (working age) Source: Center for Research on Vermont, Art Woolf.  (Indexed to 2000 = 100)
Vermont’s  Demographic Crisis… Vermont’s young people leave our state at 4 times the national average. Vermont has one of the lowest birthrates in the U.S. and in 2005 became the 2 nd  oldest state in the nation “ The New England 2020” report released in 2006 found Vermont’s share of people aged 25-29 was the lowest while its share of people aged 50-54 was the highest in the nation. Nearly 1 in 4 Vermonters receive some form of Medicaid, and many others receive other kinds of state and federal assistance.
Summary Among the Highest Taxed State in the nation  Spending at roughly 3X the Inflation Rate over the past 5 years in many areas (Education & Human Services; making up 75% of our budget) 0% Private-Sector Job growth over the past 8 years Vermont faces Billions in Unfunded Expenses Losing our young people at 4X the National Average With the Medicare and Social Security crisis, VT cannot expect Federal assistance to bail us out Bottom Line - We Have Lived Beyond Our Means For Far Too Long
VERMONT SOLUTIONS
Wanted: A Plan The Pew Center on the States released its 2008 Report Card on state management. “Pew strongly agrees that the state needs to do a better job of looking at the big picture when it comes to managing, not just people, but everything.” “Poor strategic planning is the theme running through Pew’s report card for [Vermont].” - Rutland Herald 4/7/08
Vermont’s Solutions… Identify the problem Change the culture = Electing credible Public Officials who represent your priorities Grow The Pie:  More high quality, private-jobs = less tax burden for all Contain spending Remove obstacles to private sector job growth and housing It’s Not Too Late – With YOUR help we can right the ship!
Identify the Problem As detailed in this presentation and other credible studies,  the problem facing Vermonters is a “Perfect Storm” of: Excessive spending; living beyond our means Anemic private-sector job growth  A rapidly aging population while losing our youth And the resultant unsustainable rise in Vermonters’ tax burdens & living costs’; particularly in the cost of housing
Change the Culture The climate in Montpelier has increasingly catered to special interests and no longer represents the average, hard-working, middle class Vermonter Lawmakers who continually target business & housing & discourage even responsible growth cause VT to lose credibility with potential employers and taxpayers alike The status-quo can no longer remain:  Changing the makeup of much of our Legislature and its culture must be a priority!
Grow The Pie! Being attentive to Vermont’s Economic Health and  Growing Private Sector Jobs  enables us to: Be good stewards of the environment Support the most vulnerable members of our community Provide the opportunities which keep our children and grandchildren in Vermont Broaden the tax base to ease the burden on low income Vermonters and those living on fixed incomes Create meaningful opportunities for those who want to work hard to create a better life for themselves and their families
Contain Spending Persistent spending at 2-3 times above the average Vermonter’s income growth is unsustainable and irresponsible You would be jeopardizing your own future if you conducted your own affairs this way, so why elect public officials who endorse this behavior? Encourage a reversal of the decision making process:  Instead of deciding what is needed and then how we can afford it, let’s decide what we can afford and then make the difficult decisions required to allocate the available resources
Remove Obstacles to Private Sector Job Growth Excessive regulation and permitting has many negative consequences: It raises the cost of everything from housing to the premiums you pay for health insurance It makes it difficult for local businesses to compete with more business-friendly locales; which leads to fewer job opportunities and fewer goods purchased locally It requires greater bureaucracy to maintain, which diverts much needed funds away from the most vulnerable members of our communities
To Our  Legislature and Governor… Vermont does not need new Incentives to attract new Business and Housing It needs to take away the Disincentives Vermont does not need to Stimulate its Economy and Housing sector… It needs to Liberate it!
What Can  You  Do? Become Informed  – decide for yourself what YOUR priorities are Sign the Petition  ( www.VermontersForEconomicHealth.org ) and join VEH’s mailing list – there is strength in numbers! Refer  your neighbors, co-workers, friends and families to our Web site so they can view this presentation and sign the petition Vote  in this fall’s elections and encourage others you know to do the same Run for Office –  We cannot change the current culture in Montpelier without changing the composition of the Statehouse Write Letters to the Editor  expressing your concern with the direction VT is headed Write your State Legislators  and let them know that their priorities are not YOUR priorities Become a Volunteer  with VEH And…
S.O.S. (Save Our State) Make a Donation   to the Political Action Committee (PAC) which VEH has set up to: Recruit, Promote and Fund… Candidates in this November’s elections who want to Save Our State through VEH’s economic- health agenda Checks can be made out to Vermonters For Economic Health or (VEH)
Vermont’s State Motto, 1778 Vermont resident and writer Dorothy Canfield Fisher wrote the following… “ The Vermont idea grapples energetically with the basic problem of human conduct… How to reconcile the needs of the group, of which every man or woman is a member, With the craving for individual freedom to be what he really is.”
It’s All About … Culture and the  r ebalancing  of our “ Freedom and Unity”   And the Need to  Change …  Our Priorities, Institutions & Economic Policies through sound  Strategic Planning
If you would like a copy of this Presentation or, If you would like this Presentation presented to your Town…  E-mail Tom Licata at:  [email_address]

Economic Health Presentation

  • 1.
    Vermonters for EconomicHealth Presents “ The Truth You Need To Hear” “ The multitudes remained plunged in ignorance of the simplest economic facts, and their leaders, seeking their votes, did not dare to undeceive them.” - Winston Churchill
  • 2.
    Who are VermontersFor Economic Health (VEH)? VEH is a grassroots, citizen-led organization. Our mission is simple: To promote economic health and fiscal responsibility in government.
  • 3.
    We’ll Examine .. . A brief overview of our federal fiscal health, and then examine… Vermont’s: Tax Burdens and Trends Spending and Expenses Job Growth Demographics Solutions and What You Can Do
  • 4.
    The State ofour Nation “ Arguably the biggest threat facing the U.S. today is our own Fiscal Irresponsibility , and very few people are willing to State the Facts and Speak the Truth .” “ Continuing on this Unsustainable Path will gradually erode, if not suddenly damage, our Economy, our Standard of Living, and ultimately our Domestic Tranquility and National Security.” David Walker, Comptroller General of the U.S, 2006 “ Fiscal Wake-up Tour”: http:// www.youtube.com/watch?v =OS2fI2p9iVs
  • 5.
    In 8 years,Medicare & SS go cash-flow negative; In 20*, all Revenues go to Entitlements & Debt Federal Spending As a Percent of Gross Domestic Product *Data before Medicare’s Prescription Drug Benefit implementation. Source: GAO’s March 2002 analysis Federal Revenue Line Our Children’s Future; Our Legacy to them Spending Worker/Retiree Ratio: 4.9 2.8 This piece gets eaten up by the Prescription drug benefit. An over $50 trillion projected entitlement deficit.
  • 6.
    The Effect ofMedicare’s new Prescription Drug Program … As the next chart will show… Costs shifted from Private Insurance, Out-of-Pocket and Medicaid to... Medicare, thus… Exacerbating an already Exploding Entitlement Cost Crisis…
  • 7.
    % Sources offunds for retail prescription drugs
  • 8.
    Our Crisis: Unsustainable & Out-of-Control Spending … The next chart will show the effects of Out-of-Control Medical Costs with… An aging Demographics with less younger workers supporting a growing elderly population… Consuming more of our nation’s resources…
  • 9.
    National Health Spendingas a Percentage of GDP Source: Centers for Medicare and Medicaid Services GDP = Gross Domestic Product
  • 10.
    Other Federal Challenges … The U.S. dollar has fallen in value roughly 50% against the Euro & other major currencies since 2002; a major contributor to our rise in oil prices. Our national debt stands at about $10 trillion; almost half of which is owned by foreigners; aiding in the continued decline of federal assistance to the states. The value of hydrocarbon exports from the Middle East and Central Asia is expected to approach $750 billion in 2008. - This is almost Four-Times the level in 2001; a shifting world power is occurring before our eyes; Sovereign Wealth Funds are an example.
  • 11.
    Changes in thePrice of Oil, in Dollars, Euros & Gold $100/Barrel Oil $57/Barrel Oil $30/Barrel Oil The value of the dollar is the market’s measure of its confidence that our government will preserve the purchasing power of its debt, almost half of which is held Overseas. Bloomberg/WSJ 1/4/08 Had the dollar remained “as good as gold” since 2001, Oil today would be selling at $30 a Barrel, not $100. Had the dollar remained as strong as the Euro since 2001, Oil today would be selling at $57 a Barrel, not $100.
  • 12.
    A Hard Truth… A “Sense of Urgency” is critical in Vermont. The 20 th Century was more or less dominated - economically and politically - by the U.S. The 21 st Century will not be so kind to us… It’s time to leave our unsustainable and – more so with Vermont - sentimental visions behind… and make the tough calls.
  • 13.
  • 14.
    Where Vermont GeneratesIts Tax Revenues 30% 20% 15% Source: Vermont Comprehensive Annual Financial Report. Fiscal year ending 6/30/06. Total Revenues were approximately $3.8 billion 12% 12% 8% 3%
  • 15.
    Why Should YouBe Concerned? Source: State of Vermont Comprehensive Annual Financial Report FY 2002 – 2007; Consumer Price Index VTs gov’t payroll & employee benefit costs grew 70% since 2000. (BFP 3/19/08) School spending has grown from $813 million in 1999 to $1.3 billion in 2007”; a 60% increase. - R. Herald, 2/1/07
  • 16.
    VT’s Tax BurdenRanking Source: The Tax Foundation; Bureau of Economic Analysis; Commerce Department Vermont Is Now the 3 rd Most Taxed State In The Nation (1 = Highest Burden) 3 2006 3 2005 5 2004 16 2003 14 2002 14 2001 13 2000 Tax Burden Rank Year
  • 17.
    The Gap BetweenVermonters’ Taxes and the Average American’s is at a 28 Year High The difference between VT’s 13.2%* share and the national 11.3% share amounts to $372 million more in VT taxes, or $1,500 per household , than if our taxes were at the national average. * Increased further to 14.9% in 2007. Based on 2005 data. Source: The Vermont Economy Newsletter and The Tax Foundation
  • 18.
    Every Revenue SourceIs Being Squeezed Source: VT Department of Taxes
  • 19.
    Cumulative % ofIncome Taxes Paid: By Income Level & Number of Filers 26% of Taxes Paid, 2,113 Tax Filers; 0.69% of Filers 38% Paid, 6,970 Filers; 2.29% 49% 15,200; 4.99% 98% 185,534; 61% 60% 27,632; 9.08% 75% Paid 58,415; 19.20% 91% Paid 121,827; 40.04% 100% 304,254; 100% Source: Vt. Comprehensive Annual Financial Report, 2007 $75,000 & up pay 60% of Taxes Start here, move clockwise … Top 5% pays about 50%
  • 20.
    % Share ofState Income Taxes Paid by Income Level $300K & More $150- $300 $100- $150 $75- $100 $50- $75 $10- $25 $25- $50 $10K & lower Out of State Source: Vt. Comprehensive Annual Financial Report, 2006 Data from Taxable Year 2005 Vt’s Public Assets Inst. found a net loss of folks in 2006; yet the incomes of those coming in were 18% higher vs. those who left. (BFP 3/24/08) The % of $75,000 & up filers has doubled While the lower end has fallen How long can this trend last?
  • 21.
    Consequences Of TheseTax And Social Policies Rather than create jobs & its wealth effect , Vermont imports its wealth through the importation of wealthy people. Thus, Vermont creates its own income-disparity as it redistributes that wealth. Social Mobility is obstructed and prevented – No need for Job Creation. No Opportunities… Ultimately creating a ‘Voting Block of Dependents’ and the kind of “Class-Warfare” of the ‘haves’ and ‘have-nots’ that politicians can then run on. Culminating in John Edward’s “Two Americas” scenario.
  • 22.
  • 23.
    How Does VermontSpend its Revenues? 39% 36% 75% 7.5% 6% 5% Source: Vermont Comprehensive Annual Financial Report. Fiscal year ending 6/30/06. 75% of Revenues Go Towards Education and Human Services
  • 24.
    How Has VariousVT Government Spending Grown Recently? Source: Vermont Comprehensive Annual Financial Report. Fiscal year ending 6/30/06. * A 2003 Census study showed VT has about 50% more state employees per capita than the national average.
  • 25.
    Student Enrollment Down- Employment and Costs Up Source: Summary of the Annual Statistical Report of Schools (SASR) FY 1997 - 2006 1997: Act 60 Implementation Student Growth = -9.1%; Teacher and Staff Growth = +20.8% 106,341 96,636 15,783 19,069 94,000 96,000 98,000 100,000 102,000 104,000 106,000 108,000 1997 1998 1999 2000 2001 2002 2003 2004 2005 2006 15,000 16,000 17,000 18,000 19,000 20,000 Students Teachers and Staff
  • 26.
    VT’s Student :Teacher Ratio Is Now The Second Lowest In The Country Source: U.S. Department of Labor NCES Publication 2007-352
  • 27.
    As Vermont’s Roads and Bridges Crumble … “ A report, prepared by the Legislature's fiscal analysts for the House Transportation Committee, predicts that at current funding levels, the state will face an annual budget shortfall of $203 million for maintaining its transportation system.” “ Over the next 30 years, the state could face an overall shortage of $6 billion in transportation revenue, according to the report.” - Times Argus, 1/13/08
  • 28.
    VT Taxpayer’s Looming$3.5 Looming Liabilities $451M $1.3B $ 451 M $400M $90M $75M $43M $18M $161M $200M $45M New Highway Const. Projects include the Circ, Bennington & Morrisville Bypass. See Web Site for details on all projects. $300M $1.3B $438M $451M $438M $400M $300M $200M $161M $90M $75M $45M $43M $18M $38M $38M $3.6B
  • 29.
  • 30.
    2007 Year-End Reviewof Vermont Business Jobs Lost MetroGroup - Rutland 200 Dirigo Mill - Gilman 115 Qimonda - Williston 135 Standard Register - Middlebury 112 Omya Industries - Protor 50 Vermont Plywood LLC - Hancock 35 Northern Power Sys. - Waitsfield & Barre 60 TD Banknorth Inc. – Various Locations 30 Specialty Filaments - Middlebury 180 Neo EMS - Brandon 20 Wausau Mill - Northumberland 35 Total Job Losses 972 No job gains reported; Only “plans” for future jobs. Standard Register was acquired by Connor Homes; 65 of the 112 jobs returned . Specialty Filaments was acquired by Monahan; about 120 of the 180 lost jobs returned. Source: WCAX’s / BFP ‘07 Review on VT Business
  • 31.
    Let’s Play: Jeopardy! Answer: 0%
  • 32.
    Source: Public AssetsInstitute Since 2001’s recession, private sector job growth in Vermont has essentially been 0% . (In thousands) Question: What Was VT’s Private Sector Job Growth From 2000-2006?
  • 33.
    What Kinds OfJobs Are Being Created?
  • 34.
    Vermont’s Job GrowthMarch ’06 – March ‘07 Private-Sector Jobs = Lost - 442 Government Jobs = Gained + 445 Net + 3 Source: Vermont Economy Newsletter, December, 2007
  • 35.
    The Paradox Of Our Self-Fulfilling Prophesy Vermont is literally “Eating its Own” as it replaces Private-Sector taxpaying business with government and non-profit (non-taxpaying) entities… Resulting in greater tax burdens on our shrinking private-sector economy and existing residential property taxpaying citizens. Our Legislature then steps in with its social assistance to fill this void.
  • 36.
    What Vermont’s PublicAssets Institute says … “ Many of Vermont’s new jobs are low-paying service jobs.” “ What’s needed in Vermont are good-paying jobs that take full advantage of [its] work force assets.” “ This would require our Government & Community leaders working together to develop an economic environment that makes the use of these assets a State Priority.”
  • 37.
    What Others Say:Vermont Doesn’t Need Higher Taxes, It Needs a Broader Tax Base! Former Federal Reserve Chairman Alan Greenspan concurred with the following statement: “ Over Time, Tax Revenues Are Determined By Economic and Productivity Growth .”
  • 38.
    Why Economic &Productivity Growth is Key to our Economic Survival Money is wealth to people because it allows them to buy stuff with it: Groceries, cars etc. Money may not be wealth to a Nation if the Production of Goods and Services does not keep pace with the claims against them. Trillions of dollars of debt and trillions more in retirement dollars from baby-boomers will be “cashed in” someday to buy “stuff”. If there’s not enough “stuff” to go around; claims become worth less & Inflation occurs.
  • 39.
    “ Truth AndConsequences” Presents “ Growth And Consequences” … Vermont has got to get serious about creating private-sector jobs and wealth through economic and productivity growth… Our transportation infrastructure, entitlements and other claims on our economy are growing faster than our economy… These rising outlays against a shrinking pool of wealth will lead to lower living standards and personal hardship for our families.
  • 40.
    What Vermont Businessesthink of the state of Vermont … The O’Neal Group, a nationally recognized “Brand Identity” firm, was retained by the state of Vermont in August of 2000 They conducted a review & analysis of the Vermont brand from the perspective of existing businesses in Vermont . Its findings…
  • 41.
    What Vermont Businessesthink of Vermont; Its findings … “ There is a sense among business people that Vermonters view business growth as a threat to their quality of life.” “ This mindset underlies the obstructionist & capriciousness associated with the permitting process and regulatory establishment.” Reforming the permitting process is the thing Vermont businesses want most from State government. More tax breaks are next.
  • 42.
  • 43.
    VT’s Population GrowthIs Less Than Half of the National Average
  • 44.
    VT Retirees DoubleIn 25 Years While The Work Force Shrinks Over 65, (Retirees) Age 6-18, (school age) Total Population Age 20-65, (working age) Source: Center for Research on Vermont, Art Woolf. (Indexed to 2000 = 100)
  • 45.
    Vermont’s DemographicCrisis… Vermont’s young people leave our state at 4 times the national average. Vermont has one of the lowest birthrates in the U.S. and in 2005 became the 2 nd oldest state in the nation “ The New England 2020” report released in 2006 found Vermont’s share of people aged 25-29 was the lowest while its share of people aged 50-54 was the highest in the nation. Nearly 1 in 4 Vermonters receive some form of Medicaid, and many others receive other kinds of state and federal assistance.
  • 46.
    Summary Among theHighest Taxed State in the nation Spending at roughly 3X the Inflation Rate over the past 5 years in many areas (Education & Human Services; making up 75% of our budget) 0% Private-Sector Job growth over the past 8 years Vermont faces Billions in Unfunded Expenses Losing our young people at 4X the National Average With the Medicare and Social Security crisis, VT cannot expect Federal assistance to bail us out Bottom Line - We Have Lived Beyond Our Means For Far Too Long
  • 47.
  • 48.
    Wanted: A PlanThe Pew Center on the States released its 2008 Report Card on state management. “Pew strongly agrees that the state needs to do a better job of looking at the big picture when it comes to managing, not just people, but everything.” “Poor strategic planning is the theme running through Pew’s report card for [Vermont].” - Rutland Herald 4/7/08
  • 49.
    Vermont’s Solutions… Identifythe problem Change the culture = Electing credible Public Officials who represent your priorities Grow The Pie: More high quality, private-jobs = less tax burden for all Contain spending Remove obstacles to private sector job growth and housing It’s Not Too Late – With YOUR help we can right the ship!
  • 50.
    Identify the ProblemAs detailed in this presentation and other credible studies, the problem facing Vermonters is a “Perfect Storm” of: Excessive spending; living beyond our means Anemic private-sector job growth A rapidly aging population while losing our youth And the resultant unsustainable rise in Vermonters’ tax burdens & living costs’; particularly in the cost of housing
  • 51.
    Change the CultureThe climate in Montpelier has increasingly catered to special interests and no longer represents the average, hard-working, middle class Vermonter Lawmakers who continually target business & housing & discourage even responsible growth cause VT to lose credibility with potential employers and taxpayers alike The status-quo can no longer remain: Changing the makeup of much of our Legislature and its culture must be a priority!
  • 52.
    Grow The Pie!Being attentive to Vermont’s Economic Health and Growing Private Sector Jobs enables us to: Be good stewards of the environment Support the most vulnerable members of our community Provide the opportunities which keep our children and grandchildren in Vermont Broaden the tax base to ease the burden on low income Vermonters and those living on fixed incomes Create meaningful opportunities for those who want to work hard to create a better life for themselves and their families
  • 53.
    Contain Spending Persistentspending at 2-3 times above the average Vermonter’s income growth is unsustainable and irresponsible You would be jeopardizing your own future if you conducted your own affairs this way, so why elect public officials who endorse this behavior? Encourage a reversal of the decision making process: Instead of deciding what is needed and then how we can afford it, let’s decide what we can afford and then make the difficult decisions required to allocate the available resources
  • 54.
    Remove Obstacles toPrivate Sector Job Growth Excessive regulation and permitting has many negative consequences: It raises the cost of everything from housing to the premiums you pay for health insurance It makes it difficult for local businesses to compete with more business-friendly locales; which leads to fewer job opportunities and fewer goods purchased locally It requires greater bureaucracy to maintain, which diverts much needed funds away from the most vulnerable members of our communities
  • 55.
    To Our Legislature and Governor… Vermont does not need new Incentives to attract new Business and Housing It needs to take away the Disincentives Vermont does not need to Stimulate its Economy and Housing sector… It needs to Liberate it!
  • 56.
    What Can You Do? Become Informed – decide for yourself what YOUR priorities are Sign the Petition ( www.VermontersForEconomicHealth.org ) and join VEH’s mailing list – there is strength in numbers! Refer your neighbors, co-workers, friends and families to our Web site so they can view this presentation and sign the petition Vote in this fall’s elections and encourage others you know to do the same Run for Office – We cannot change the current culture in Montpelier without changing the composition of the Statehouse Write Letters to the Editor expressing your concern with the direction VT is headed Write your State Legislators and let them know that their priorities are not YOUR priorities Become a Volunteer with VEH And…
  • 57.
    S.O.S. (Save OurState) Make a Donation to the Political Action Committee (PAC) which VEH has set up to: Recruit, Promote and Fund… Candidates in this November’s elections who want to Save Our State through VEH’s economic- health agenda Checks can be made out to Vermonters For Economic Health or (VEH)
  • 58.
    Vermont’s State Motto,1778 Vermont resident and writer Dorothy Canfield Fisher wrote the following… “ The Vermont idea grapples energetically with the basic problem of human conduct… How to reconcile the needs of the group, of which every man or woman is a member, With the craving for individual freedom to be what he really is.”
  • 59.
    It’s All About… Culture and the r ebalancing of our “ Freedom and Unity” And the Need to Change … Our Priorities, Institutions & Economic Policies through sound Strategic Planning
  • 60.
    If you wouldlike a copy of this Presentation or, If you would like this Presentation presented to your Town… E-mail Tom Licata at: [email_address]