Download to read offline


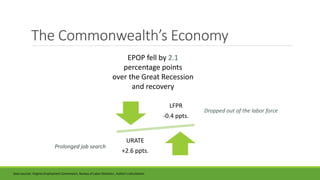

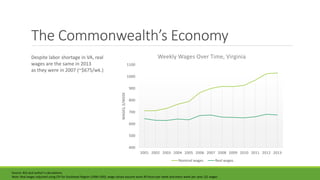


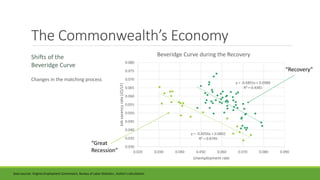
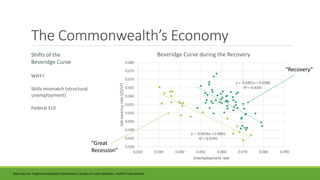


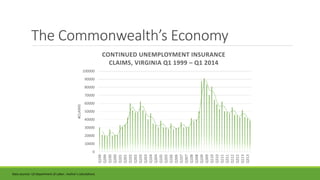


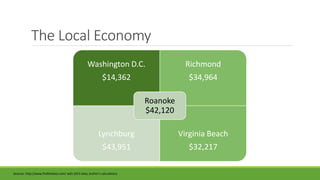


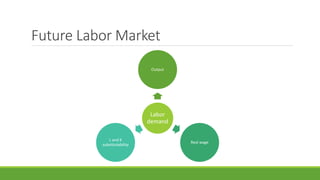


The document summarizes labor market trends in Virginia and the Roanoke Valley region from 1999-2014. It finds that while Virginia has experienced a labor shortage, real wages have remained stagnant. The Roanoke Valley specifically has seen real wages fall over time and lag behind the rest of Virginia. Current data shows labor shortages in both Virginia and the Roanoke Valley, which may put upward pressure on wages going forward. The document also projects growing employment in various occupations in the Roanoke region by 2020.


