Download to read offline

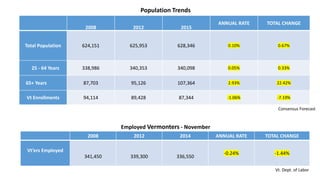
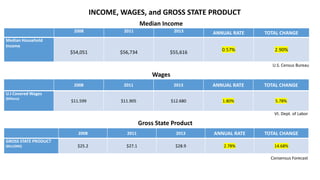
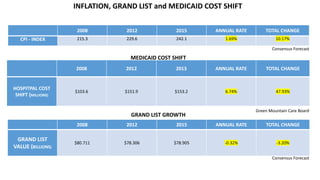
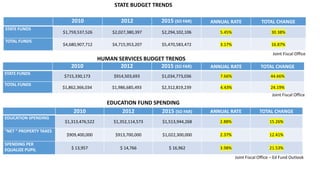
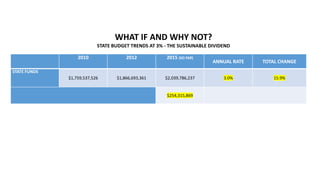

This document summarizes an economic outlook seminar presented to the State Chamber of Commerce on January 14, 2015. It profiles key demographic and economic trends in Vermont from 2008-2015, showing mostly modest annual growth rates of around 3% except for higher rates in Medicaid costs. State budget spending is shown to have grown much faster at 5.45% annually from 2010-2015. Adopting a more modest 3% annual growth rate for the state budget could have eliminated budget deficits. The document also profiles tax data for top income earners and outlines options to remedy fiscal imbalances, recommending focusing reforms and efficiencies abandoned in 2011.