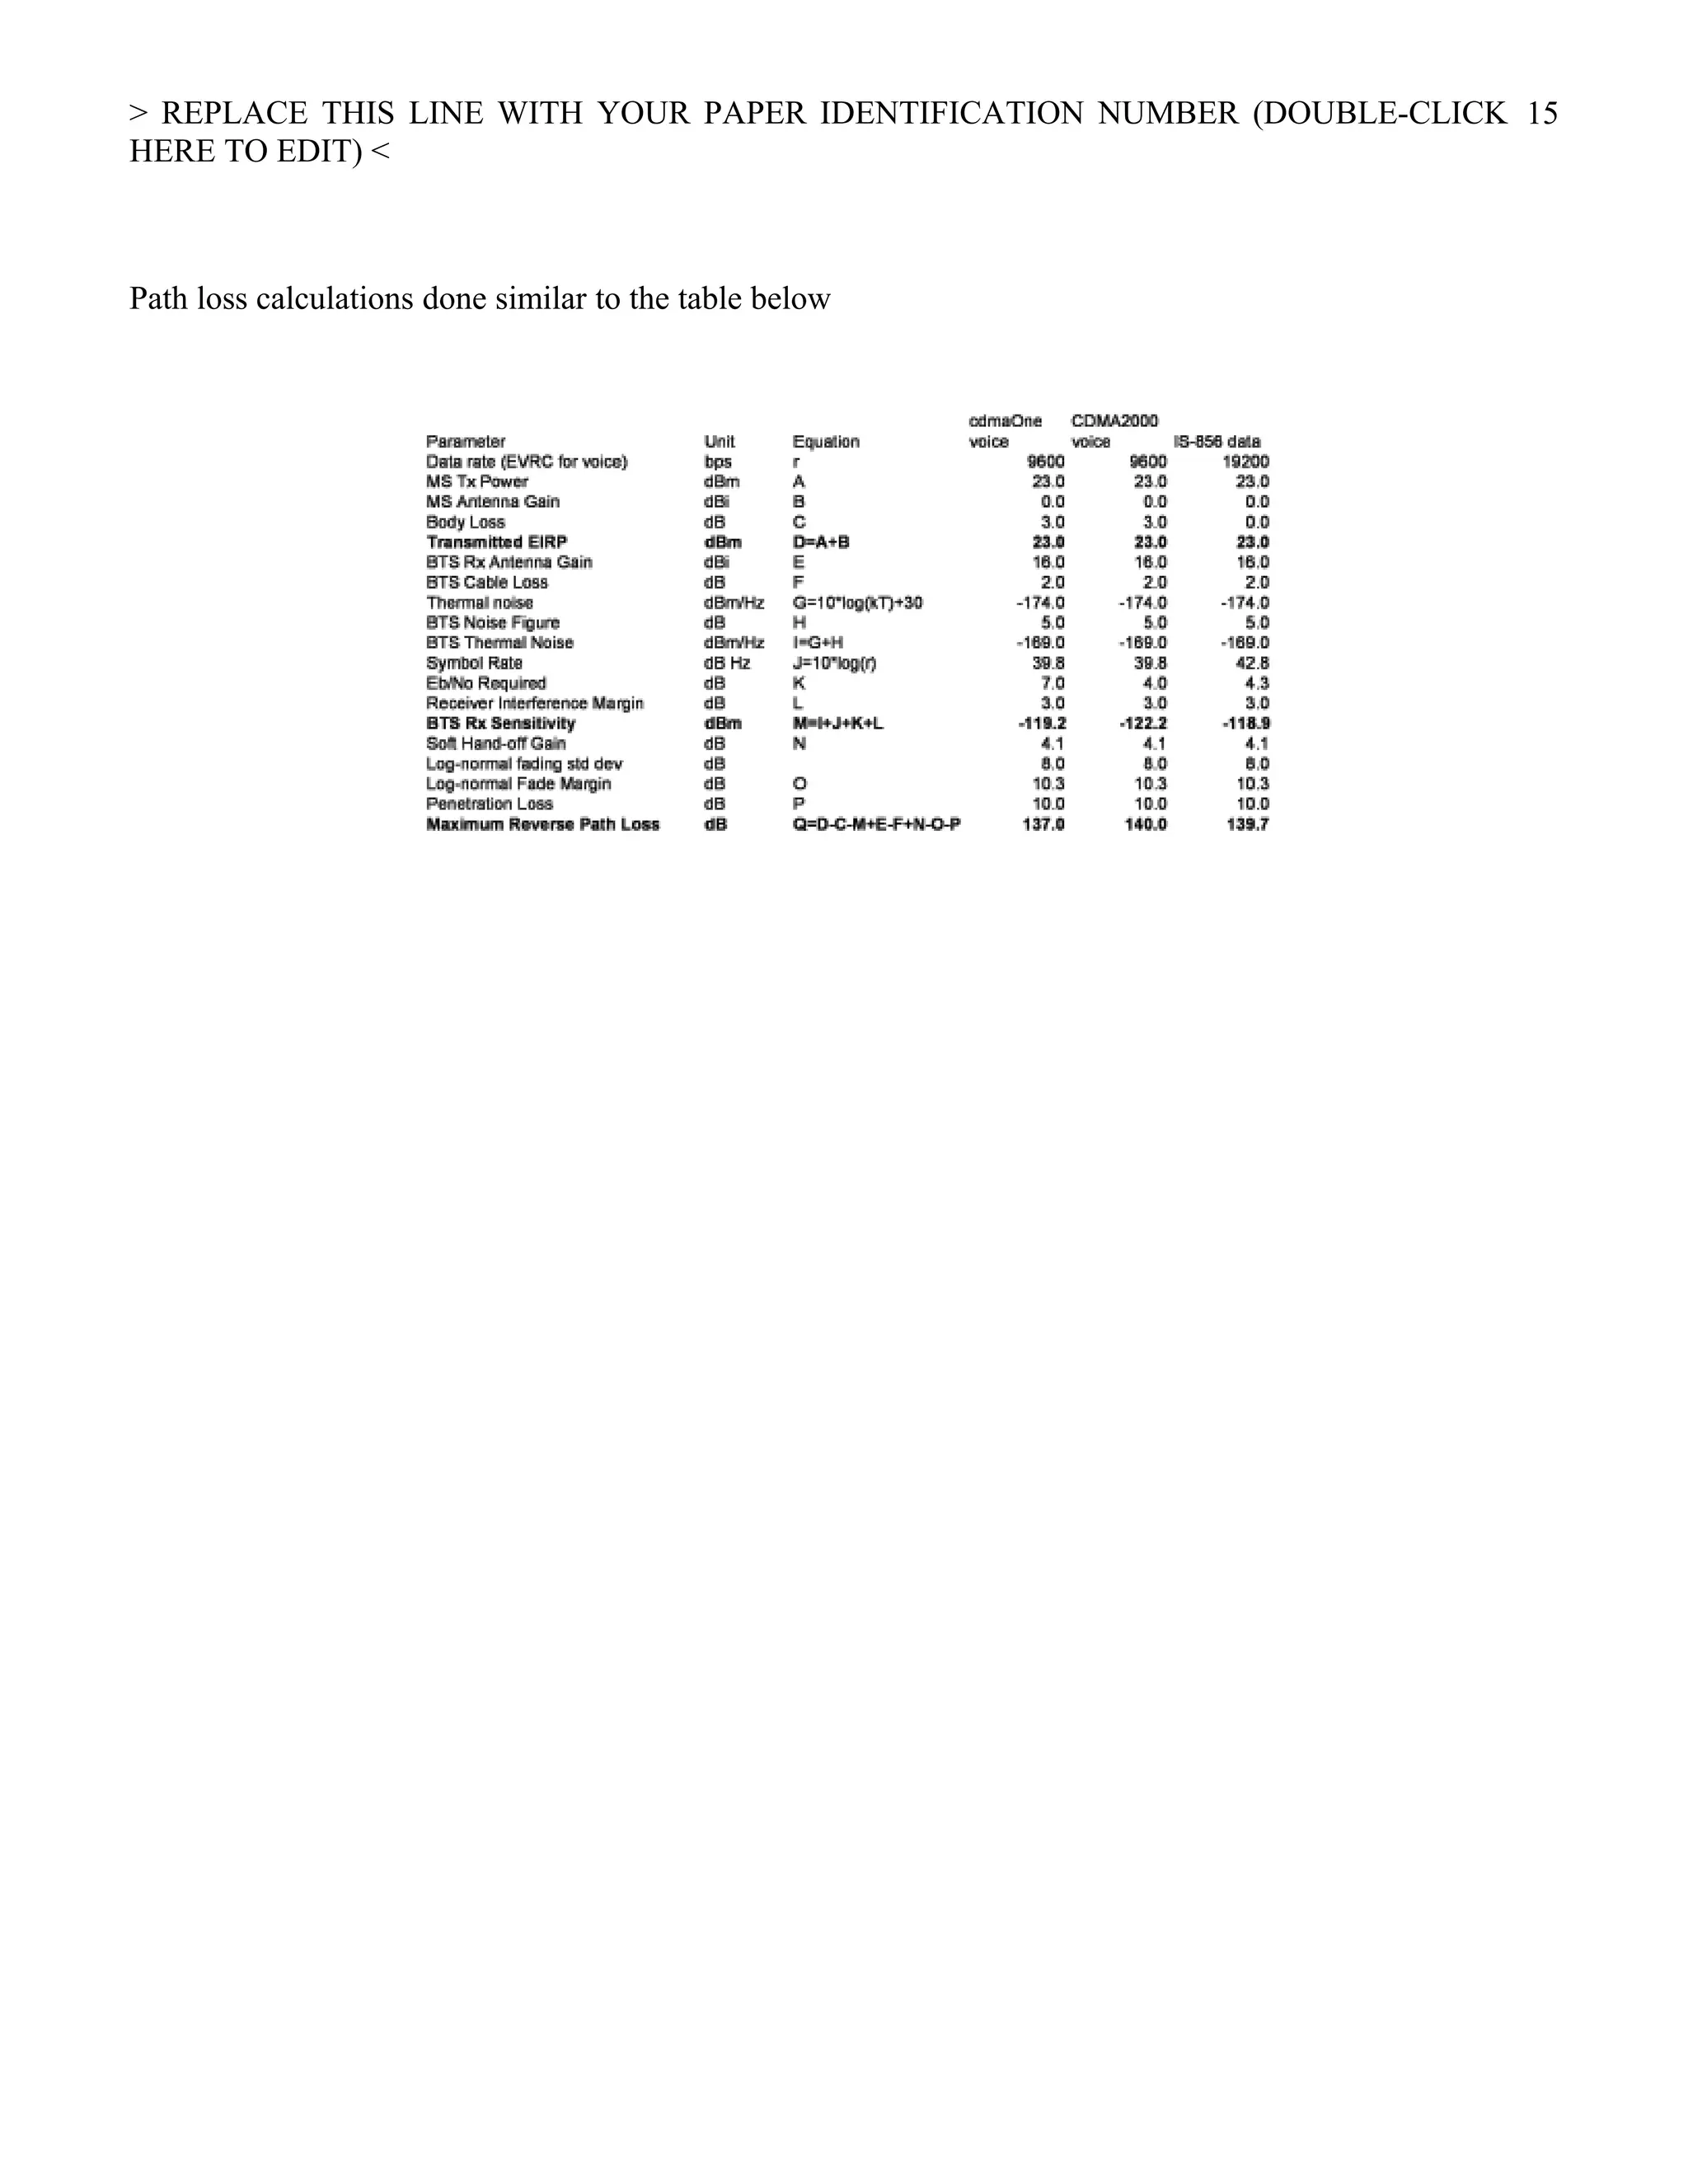
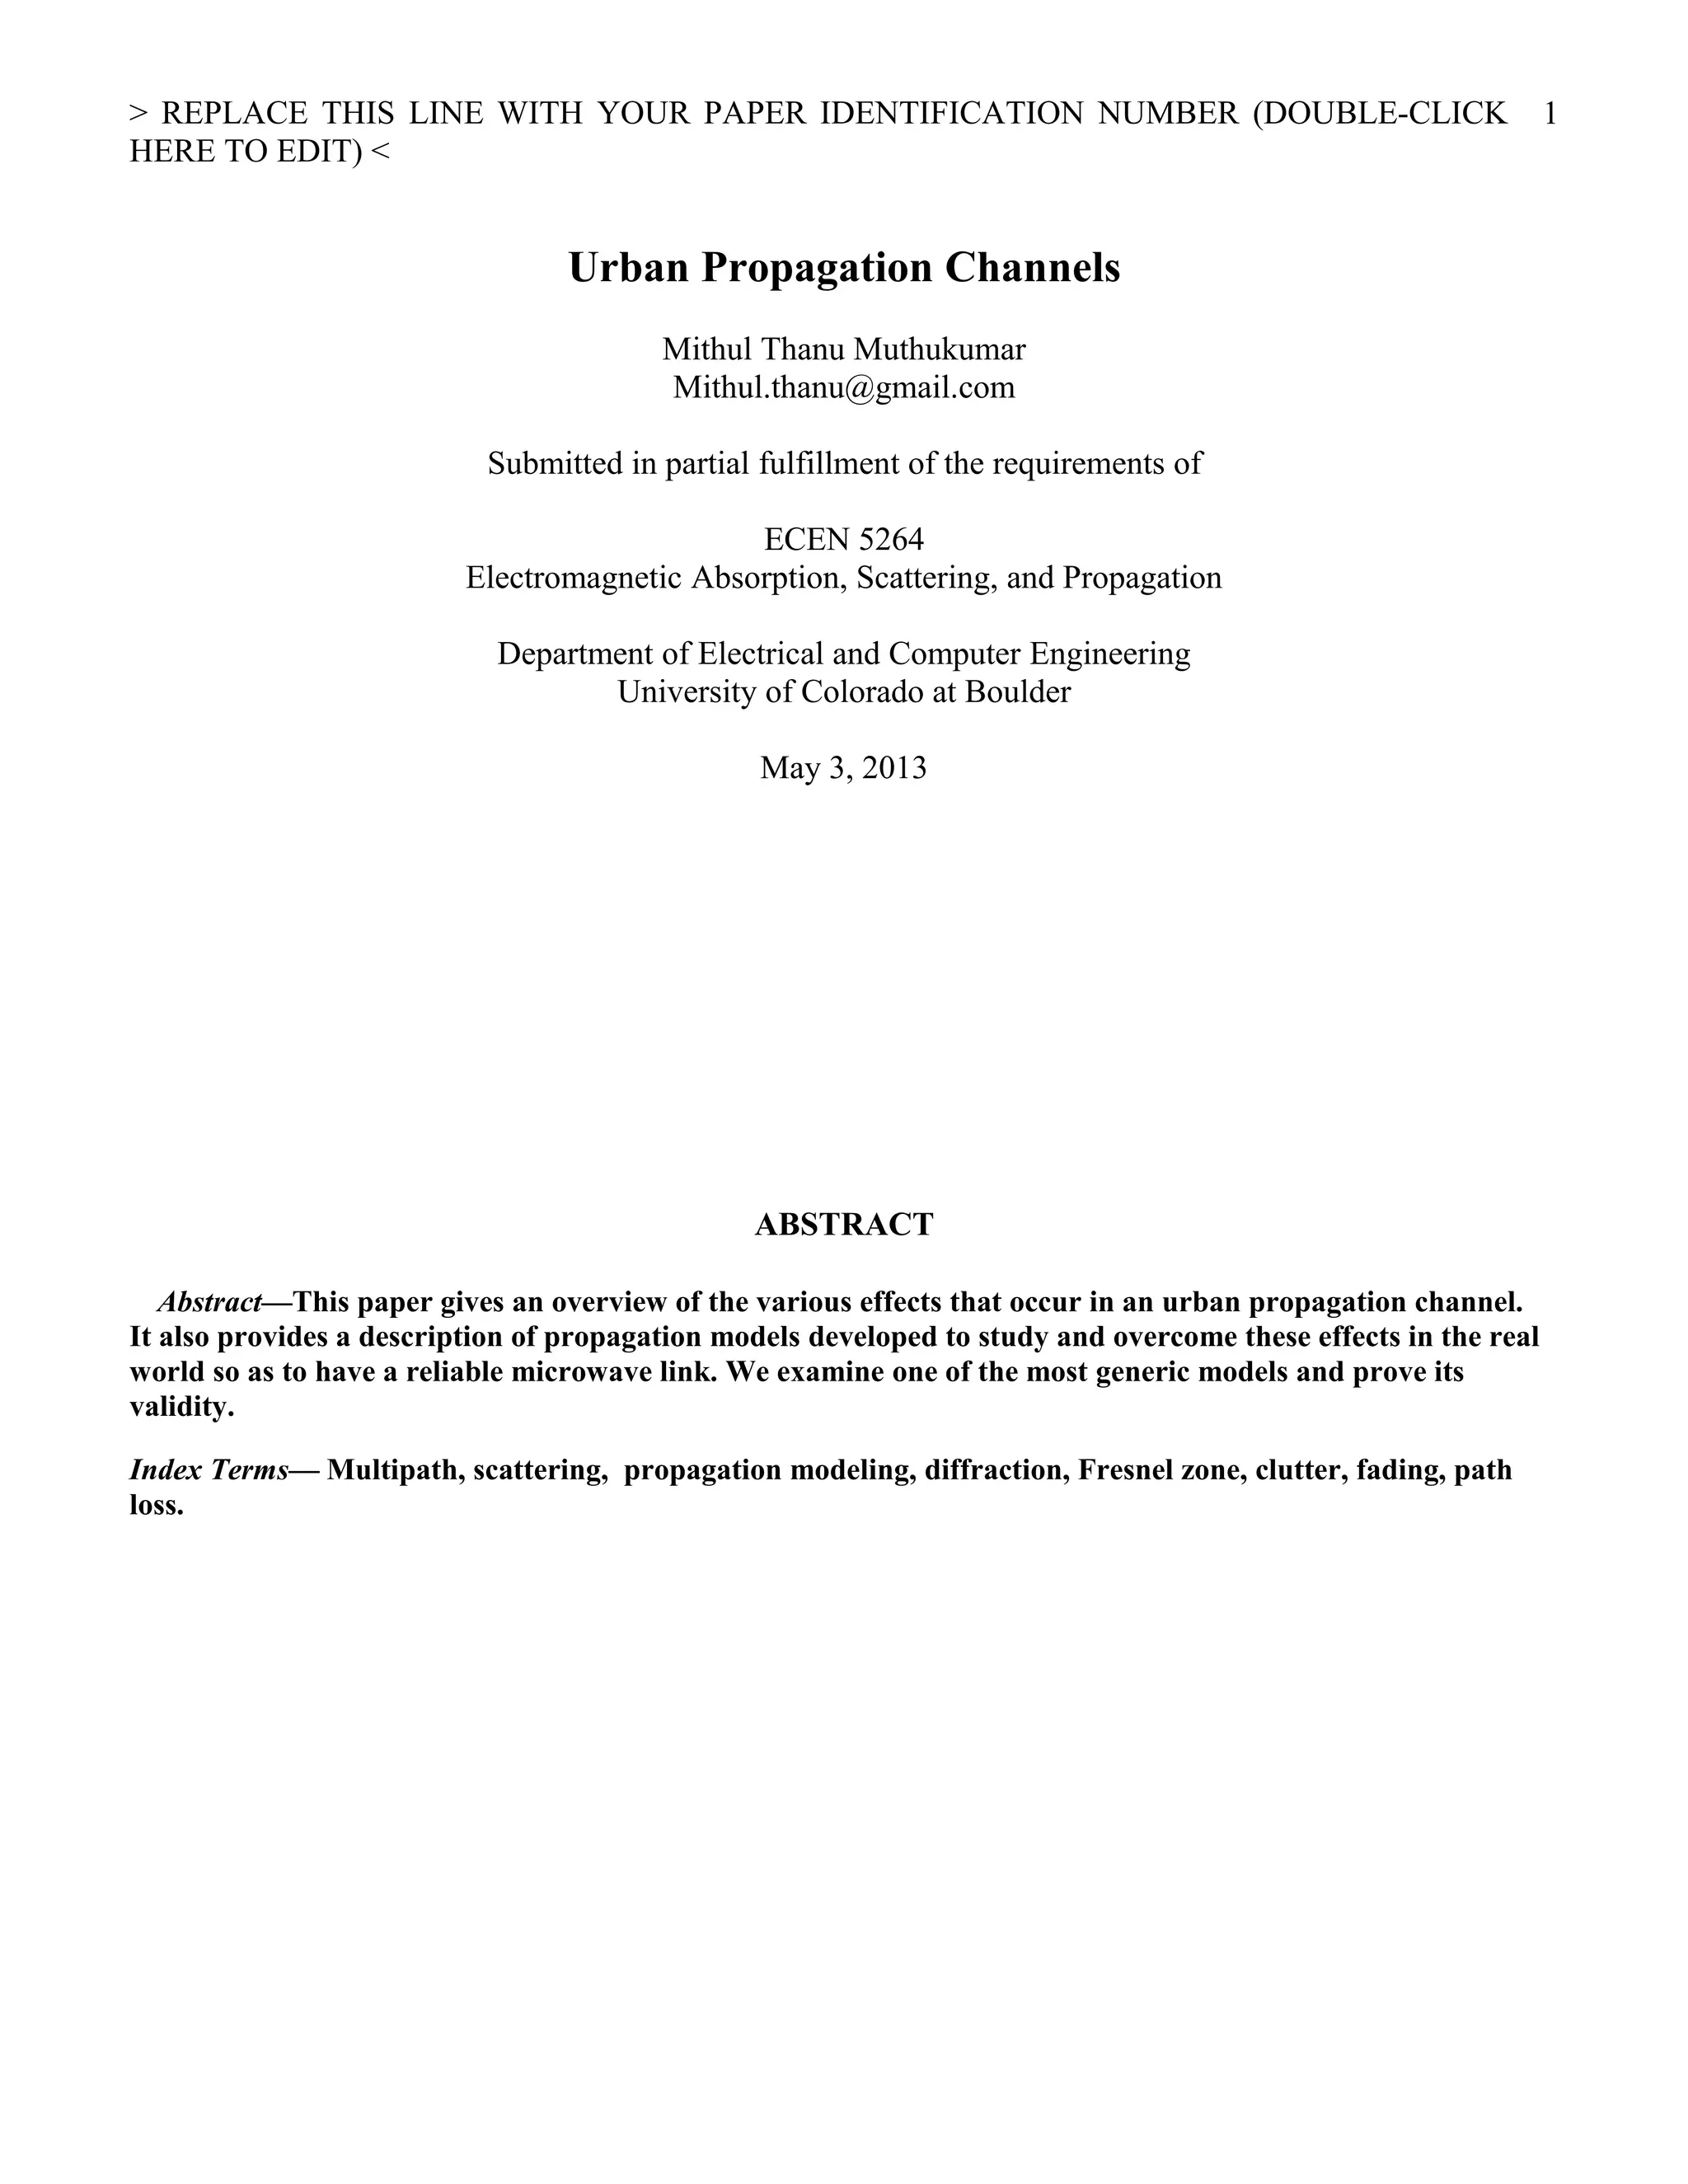
This paper discusses propagation modeling for urban environments. It describes the various effects that impact signal propagation in cities, such as multipath fading caused by signals reflecting off buildings. Empirical propagation models like COST 231 are developed based on extensive measurements to characterize path loss in urban areas. The paper also examines diffraction effects caused by obstructions blocking the first Fresnel zone and the impact of weather on radio wave propagation. Modeling is done of signal propagation around the University of Colorado campus to validate the COST 231 model for suburban environments.
Although unmanned aerial vehicles (UAVs) were mostly studied and used for military purposes before, they
have become very popular recently for both civil uses, such as law enforcement and crop survey, and for
potential commercial uses such as grocery delivery and Internet extension. Researchers investigating new
networking protocols for UAV networks usually need the help of simulations to test their protocol designs,
particularly when networks of large scales are desired in their tests. One choice that researchers need to
make in the simulation of UAV networks is the radio propagation model for the air links. In this paper we
compare the three radio propagation models that are available in the ns2 network simulation package and
investigate if the choice of one particular model would have a significant impact on the simulation results
for UAV networks.
Improvement of Fading Channel Modeling Performance for Wireless Channel IJECEIAES
Fading channel modeling is generally defined as the variation of the attenuation of a signal with various variables. Time, geographical position, and radio frequency which is included. Fading is often modeled as a random process. Thus, a fading channel is a communication channel that experiences fading. In this paper, the proposed system presents a new design and simulate a wireless channel using Rayleigh channels. Rayleigh channels using two approaches (flat and frequency-selective fading channels) in order to calculate some path space loss efforts and analysis the performance of different wireless fading channel modeling. The results show that the bite error rate (BER) performance is dramatically improved in the value of signal to noise ratio (SNR) is equal to 45dB. Finally, the experimental results show that the proposed method enhances the performance of fading channel modeling by reducing the error of BER when the SNR is reduced also. Moreover, the more accurate model is Rayleigh model which can be considered for developing fading channel model.
Kinds of Propagation Models
Models of Different Types of Cells
Web Plot Digitizer Tool
Study of the parameters fc, d, hb, hm and Coverage Environments for each of OKUMURA, HATA and COST231
MATLAB Simulation
IJERA (International journal of Engineering Research and Applications) is International online, ... peer reviewed journal. For more detail or submit your article, please visit www.ijera.com
Effect on Channel Capacity of Multi-User MIMO System in Crowded AreaIJEEE
Multiple-Input Multiple-Output (MIMO) and Multi-User
MIMO (MU-MIMO) systems have been expected to
improve the channel capacity over a limited bandwidth of
existing networks.
Path Loss Characterization of 3G Wireless Signal for Urban and Suburban Envir...Onyebuchi nosiri
Abstract - The characteristic effects of propagation environment on wireless communication signals are significant on the transmitted and received signal quality. The study focused on investigative analysis of the effects of propagation environment on the wireless communication signals within some geographical domains in Port Harcourt, River State. Field measurements were carried out in some selected areas namely GRA phase II and Aggrey Road categorized as urban and Sub urban areas respectively using Sony Ericsson (W995) Test Phone and GPS receiver (BU353). The analyses were based on linear regression (mean square error) approach. The computed path loss exponents and standard deviation based on the empirical analyses conducted for urban and suburban environments are 3.57dB, 2.98dB and 19.6, 13.2, respectively. The results obtained were used to compare the performance of the various existing path loss prediction models such as Okumura-Hata, Cost 231 and ECC-33. Okumura-Hata model showed better performance in urban environment while Cost 231 performed better in rural environment. They study therefore recommends the deployment of Okumura-Hata model in urban, while Cost 231for suburban study areas.
SαS noise suppression for OFDM wireless communication in rayleight channel IJECEIAES
Orthogonal frequency division multiplexing (OFDM) is a form of multicarrier transmission technique widely used in the modern wireless network to achieve high-speed data transmission with good spectral efficiency. However, in impulsive noise environement BER performances of these systems, originally designed for a Gaussian noise model, are much degraded. In this paper, a new symmetric-alpha-stable (SαS) noise suppression technique based conjointly on adaptive modulation, convolutional coding (AMC) and Recursive Least Square (RLS) filtering is presented. The proposed scheme is applied on OFDM system in Rayleigh fading channel. The transmissions are analyzed under different combinations of digital modulation schemes (BPSK, QPSK, 16-QAM, 64-QAM) and convolutional code rates (1/2, 2/3, 3/4). Simulation results show that our proposed hybrid technique provides effective impulsive noise cancelation in OFDM system and exhibits better BER performance.
A hybrid algorithm for wave-front corrections applied to satellite-to-ground ...TELKOMNIKA JOURNAL
Laser communications hold accurate data rate for ground satellite links. The laser beam is transmitted through the atmosphere. The clear-air turbulence induces a number of phase distortions that damage wave-front. Adaptive optics (AO) treats wave front correction. The nature of AO systems is iterative; it can be integrated in metaheuristic algorithms such as genetic algorithm (GA). This paper presents improved version of algorithm for wave-front corrections. The improved algorithm is based on genetic algorithm (GA) and adaptive optics approach (OA). It is implemented in a computer simulation model called object-oriented matlab adaptive optics (OOMAO). The optimisation process involves best possible GA parameters as a function of population size, iteration count, and the actuators’ voltage intervals. Results show that the application of GA improves the performance of AO in wave-front corrections and the communication between satellite-to-ground laser links as well.
Third Generation Wireless Modeling in Urban EnvironmentEECJOURNAL
The global mobile communication is fast growing in industry. This paper recommends appropriate settings to evaluate the performance of wireless mobile system deploying third generation networks in an urban environment. To meet this aim, a case Study of Sulaimanyia city is considered for this study by establishing suitable radio channel models. The work presents a statistical channel model, where fixed and nomadic analysis services are considered in the simulated radio coverage scenario. The cartographic dataset had been collected, and Matlab Software was used for showing the analysis and simulation results. Statistical channel models are derived that combine standard parameters such as separation distance, operating frequency and terminal height with more advanced and innovative parameters such as distance dependent shadowing and LOS probability.
ENHANCED ANTENNA POSITION IMPLEMENTATION OVER VEHICULAR- AD HOC NETWORK (VNET...ijwmn
The technology related to networking moves wired connection to wireless connection. The basic problem concern in the wireless domain, random packet loss for the end to end connection. In this paper we show the performance and the impact of the packet loss and delay, by the bit error rate throughput etc with respect to the real world scenario vehicular ad hoc network in 3-dimension space (VANET in 3D). Over the years software development has responded to the increasing growth of wireless connectivity in developing network enabled software. In this paper we consider the real world physical problem in three dimensional wireless domain and map the problem to analytical problem .
In this paper we simulate that analytic problem with respect to real world scenario by using enhanced antenna position system (EAPS) mounted over the mobile node in 3D space. In this paper we convert the real world problem into lab oriented problem by using the EAPS –system and shown the performance in wireless domain in 3 dimensional space.
Loss of strength, A periodic reduction in the received strength of a radio transmission.
This is about the phenomenon of loss of signal in telecommunications.Fading refers to the
time variation of the received signal power caused by changes in the transmission medium or path.
Performance of modeling wireless networks in realistic environmentCSCJournals
A wireless network is realized by mobile devices which communicate over radio channels. Since, experiments of real life problem with real devices are very difficult, simulation is used very often. Among many other important properties that have to be defined for simulative experiments, the mobility model and the radio propagation model have to be selected carefully. Both have strong impact on the performance of mobile wireless networks, e.g., the performance of routing protocols varies with these models. There are many mobility and radio propagation models proposed in literature. Each of them was developed with different objectives and is not suited for every physical scenario. The radio propagation models used in common wireless network simulators, in general researcher consider simple radio propagation models and neglect obstacles in the propagation environment. In this paper, we study the performance of wireless networks simulation by consider different Radio propagation models with considering obstacles in the propagation environment. In this paper we analyzed the performance of wireless networks by OPNET Modeler .In this paper we quantify the parameters such as throughput, packet received attenuation.
Impact of Using Modified Open Area Okumura-Hata Propagation Model in Determin...IJMERJOURNAL
ABSTRACT: This paper examines the applicability of the Okumura - Hata model in Malaysia in GSM frequency band. The study was carried out in the open area only since measurements provided from Malaysia Mobile were about the open areas. The mean square error (MSE) was calculated between measured path loss values and those predicted on basis of Okumura-Hata model for an open area. The MSE is up to 6dB, which is an acceptable value for the signal prediction. Therefore, the model gave a significant difference in an open area that allowed necessary changes to be introduced in the model. That error was minimized by subtracting the calculated MSE (15.31dB) from the original equation of open area for Okumura-Hata model. Modified equation was also verified for another cell in an open area in Malaysia and gave acceptable results.
please if any problem in this slide than give me feedback i will remove those problem .
Two people can damage a society one who knows and does not talk, another one who does not know and talk.
Compared to wireless deployment in areas with different environmentseIJECEIAES
In the mobile phone system, it is highly desirable to estimate the loss of the track not only to improve performance but also to achieve an accurate estimate of financial feasibility; the inaccurate estimate of track loss either leads to performance degradation or increased cost. Various models have been introduced to accurately estimate the path loss. One of these models is the Okomura / Hata model, which is recommended for estimating path loss in cellular systems that use micro cells. This system is suitable for use in a variety of environments. This study examines the comparison of path loss models for statistical analysis derived from experimental data collected in urban and suburban areas at frequencies of 150-1500 MHz’s The results of the measurements were used to develop path loss models in urban and suburban areas. The results showed that Pathloss increases in urban areas respectively.
COMPARISON OF RADIO PROPAGATION MODELS FOR LONG TERM EVOLUTION (LTE) NETWORKijngnjournal
This paper concerns about the radio propagation models used for the upcoming 4th Generation (4G) of cellular networks known as Long Term Evolution (LTE). The radio wave propagation model or path loss model plays a very significant role in planning of any wireless communication systems. In this paper, a comparison is made between different proposed radio propagation models that would be used for LTE, like Stanford University Interim (SUI) model, Okumura model, Hata COST 231 model, COST Walfisch-Ikegami & Ericsson 9999 model. The comparison is made using different terrains e.g. urban, suburban and rural area.SUI model shows the lowest path lost in all the terrains while COST 231 Hata model illustrates highest path loss in urban area and COST Walfisch-Ikegami model has highest path loss for suburban and rural environments.
Determination of Propagation Path Loss and Contour Map for FUTA FM Radio Fede...IOSR Journals
Abstract: FM signal propagation through the troposphere interacts with the terrain as obstacles and reflection planes. To understand the degree of interaction, signal strength measurements of the 93.1MHz frequency modulated Radio located at Federal University of Technology; Akure, Nigeria was carried out in the area surrounding the station. The paper reviews the various models for predicting transmission loss and employed the long rice irregular terrain model for its versatility for the study. The losses along the paths were determined and this was compared with the path loss predicted by the irregular terrain model and this was highly correlated. The result offers useful data for developing the contour map of the propagation loss which was developed for the station. It was concluded that with the irregular terrain model predictions can be used for accurate spectrum management in Nigeria. Keywords: Signal Strength, Transmission Loss, Terrain, Spectrum Management.
Determination of Propagation Path Loss and Contour Map for FUTA FM Radio Fede...IOSR Journals
FM signal propagation through the troposphere interacts with the terrain as obstacles and reflection
planes. To understand the degree of interaction, signal strength measurements of the 93.1MHz frequency
modulated Radio located at Federal University of Technology; Akure, Nigeria was carried out in the area
surrounding the station. The paper reviews the various models for predicting transmission loss and employed
the long rice irregular terrain model for its versatility for the study. The losses along the paths were determined
and this was compared with the path loss predicted by the irregular terrain model and this was highly
correlated. The result offers useful data for developing the contour map of the propagation loss which was
developed for the station. It was concluded that with the irregular terrain model predictions can be used for
accurate spectrum management in Nigeria
An Analytical Analysis of Path Loss Models for Mobile Cellular Wireless Commu...IJCI JOURNAL
The paper deals with the study based on the comparative analysis of radio propagation models for mobile cellular wireless communication of global system for mobile at frequencies 0.9 GHz and 1.8 GHz,respectively. The path loss propagation models are vital tool for planning the wireless network as well as
designed to predict path loss in a meticulous environment. Various propagation models: Free-space model, CCIR (ITU-R) model, Hata model, Ericson model, and Stanford University Interim (SUI) model have been studied and examined through analytically from the base station (BS) to mobile station (MS)
and vice versa followed by respective simulation performance evaluation by using Matlab simulator. The observed data is collected at the operating frequency of 0.9 GHz from various environments (high density region and low density region) using the spectrum analyzer and path loss comparison is shown for
different model.
AN ANALYTICAL ANALYSIS OF PATH LOSS MODELS FOR MOBILE CELLULAR WIRELESS COMMU...IJCI JOURNAL
The paper deals with the study based on the comparative analysis of radio propagation models for mobile cellular wireless communication of global system for mobile at frequencies 0.9 GHz and 1.8 GHz, respectively. The path loss propagation models are vital tool for planning the wireless network as well as
designed to predict path loss in a meticulous environment. Various propagation models: Free-space model, CCIR (ITU-R) model, Hata model, Ericson model, and Stanford University Interim (SUI) model have been studied and examined through analytically from the base station (BS) to mobile station (MS)
and vice versa followed by respective simulation performance evaluation by using Matlab simulator. The observed data is collected at the operating frequency of 0.9 GHz from various environments (high density region and low density region) using the spectrum analyzer and path loss comparison is shown for
different model.
Survey of analysis and performance of ofdm signals in time and frequency disp...eSAT Publishing House
IJRET : International Journal of Research in Engineering and Technology is an international peer reviewed, online journal published by eSAT Publishing House for the enhancement of research in various disciplines of Engineering and Technology. The aim and scope of the journal is to provide an academic medium and an important reference for the advancement and dissemination of research results that support high-level learning, teaching and research in the fields of Engineering and Technology. We bring together Scientists, Academician, Field Engineers, Scholars and Students of related fields of Engineering and Technology
Comparative Study of Path Loss Models for Wireless Communication in Urban and...Onyebuchi nosiri
ABSTRACT: The study was based on the comparative analysis of radio propagation models for Global System for Mobile Communications at 900MHz. Drive test analyses were carried out from two selected terrains in Rivers State namely GRA Phase II and Aggrey Road classified as urban and suburban areas respectively, to evaluate the best propagation model for the study area. The data obtained were used to compare the various prediction models namely; Cost 231, Okumura-Hata and ECC-33. Mean path loss values of 115.16dB for Okumura-Hata and 117.79dB for COST 231 and 280.88dB for ECC-33 respectively were predicted in the urban environment. Mean path loss values of 115.16dB, 114.76dB and 314.84dB were predicted by Okumura-Hata, Cost 231and ECC-33 models respectively in the suburban environment. ECC-33 over estimated path loss and gave the highest prediction in both environments. Okumura-Hata model showed better performance in urban while COST 231 performed better in the suburban environment. Okumura-hata and COST 231 models are recommended for deployment in urban and suburban environments respectively.
Comparative Study of Path Loss Models for Wireless Communication in Urban and...
ECEN+5264 TERM PAPER_Mithul Thanu
1. > REPLACE THIS LINE WITH YOUR PAPER IDENTIFICATION NUMBER (DOUBLE-CLICK
HERE TO EDIT) <
Urban Propagation Channels
Mithul Thanu Muthukumar
Mithul.thanu@gmail.com
Submitted in partial fulfillment of the requirements of
ECEN 5264
Electromagnetic Absorption, Scattering, and Propagation
Department of Electrical and Computer Engineering
University of Colorado at Boulder
May 3, 2013
ABSTRACT
Abstract—This paper gives an overview of the various effects that occur in an urban propagation channel.
It also provides a description of propagation models developed to study and overcome these effects in the real
world so as to have a reliable microwave link. We examine one of the most generic models and prove its
validity.
Index Terms— Multipath, scattering, propagation modeling, diffraction, Fresnel zone, clutter, fading, path
loss.
1
2. > REPLACE THIS LINE WITH YOUR PAPER IDENTIFICATION NUMBER (DOUBLE-CLICK
HERE TO EDIT) <
1. INTRODUCTION
n the tropospheric region which extends upto12 km above the earths surface the radio waves are
transmitted and received through microwave links and between these microwave links we have a
constantly changing environment which influences the propagation characteristics of these waves. The
electromagnetic radiation in this region is called as the ground waves and sky waves and similar to light
these electromagnetic radiations experience various effects such as reflection, scattering, attenuation and
diffraction. As to which of these effects occur, it is dependent on the surface which the electromagnetic
wave encounters. If the wave impinges on an object which is comparable to its wavelength it experiences
reflection. When it encounters a sharp irregular edge it undergoes diffraction and scattering is caused by
objects way smaller than the wavelength of the propagating wave.
I
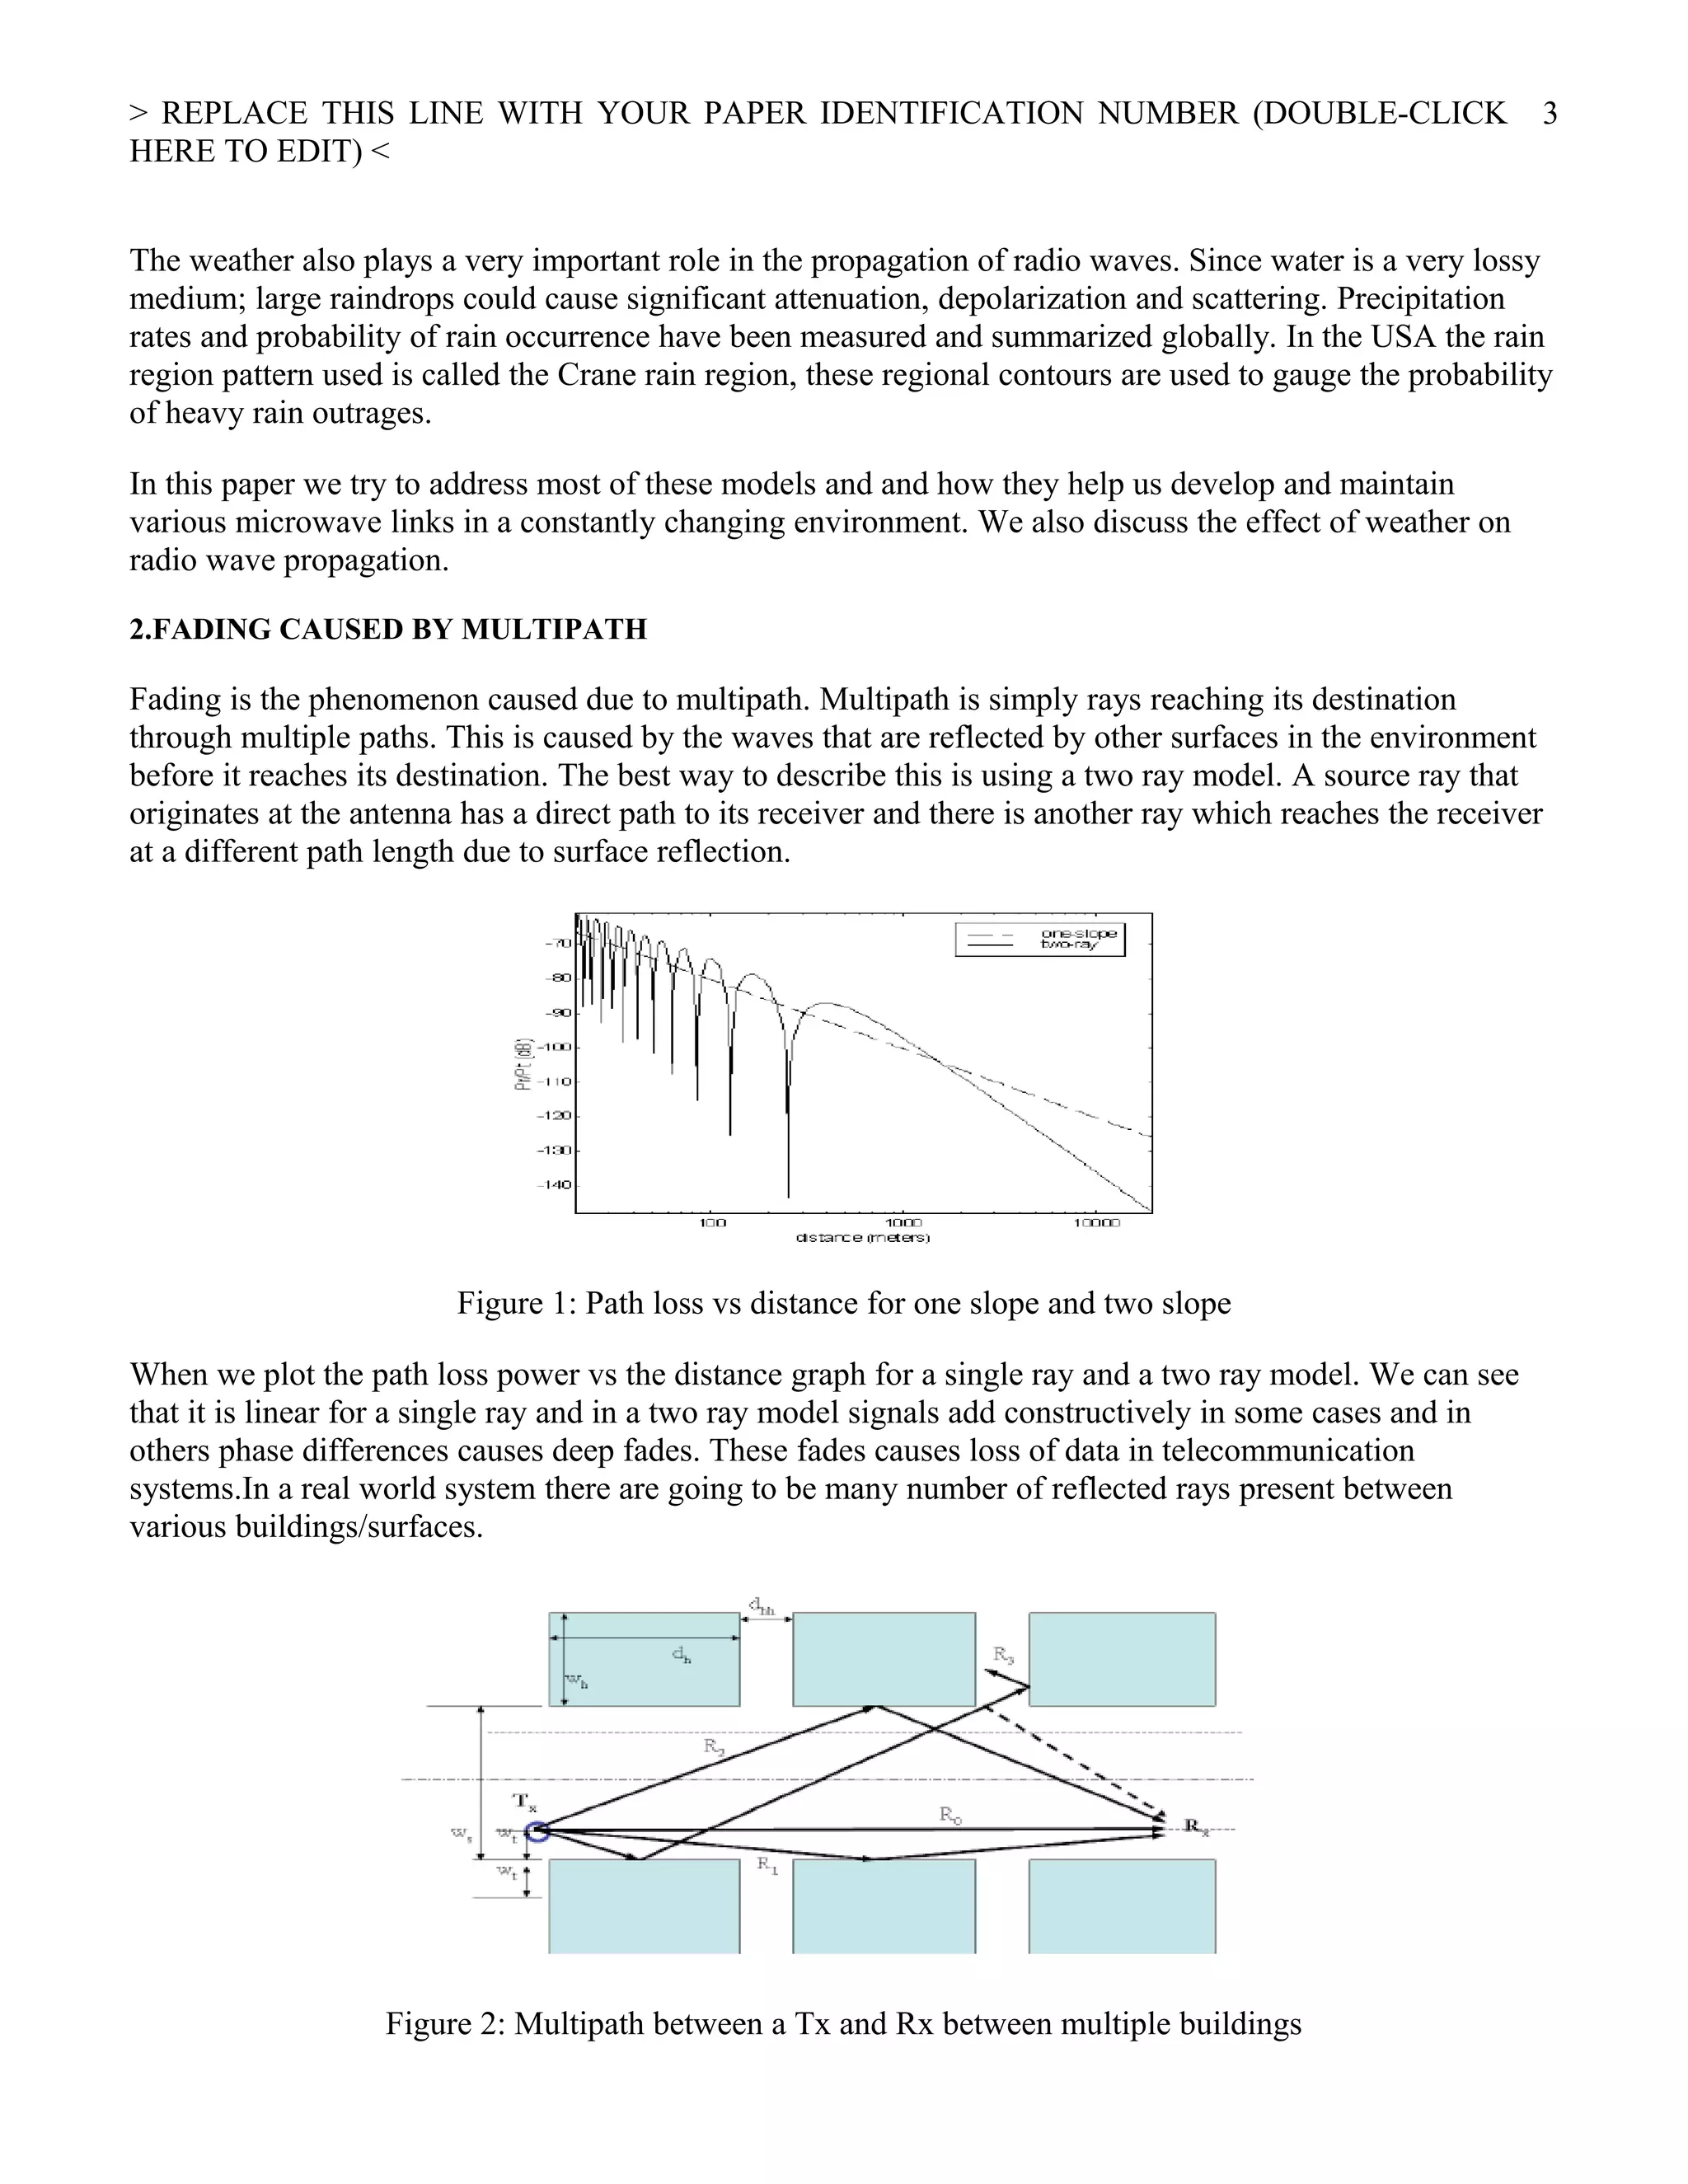
When electromagnetic waves are propagated over extended distances they experience fading. This occurs
because of the changing distance between the receiver and transmitter and the changes in the atmospheric
conditions. Fading can be split into three types, fading in free space, large-scale fading or shadowing and
small scale fading. It is important to measure the path loss in all the cases as it provides us with useful
information to what happens to these electromagnetic radiations in a statistical sense. For each of these
fading types different models have been proposed and implemented. All these models try to define the path
loss component for different environments. The simplest way of defining path loss is that it’s the ratio
between the received power to the transmitted power. For free space propagation the power ratio of a
microwave system can be given by the Friss formulae.
, (1)
Where, Pt and Pr are the transmitted and received power and Gt and Gr are the gains of the transmitting and
receiving antennas respectively. As most Rf comparison and measurements are performed in decibles and it
is a consistent method to determine the signal level at any given point, we manipulate the equation to a
logarithmic format to obtain the equation below [1].
L(dB) = 32.45+20log(f/fo)+20log(d/d0) (2)
The path loss is highly dependent on the environment; a dense region such as an urban city will have higher
path loss compared to a suburban region. It is important to develop empirical models as they are less site
specific and provide a first order modeling for a wide range of similar locations. Developing all these
models consume a lot of time and cost. Hence, these models are always developed around PCS frequencies
(800 MHz to 1900 Mhz) which are commercially used by cellular companies and extended over other
frequencies. These empirical models are mostly applicable to outdoor environments but when we model for
indoor propagation the modeling is mostly site specific with features specific to a particular building: wall
thickness, construction material used, floor and ceiling material etc. Since most of the buildings have sharp
edges, diffraction is a very common phenomenon in indoor propagation or in a region comprising lots of
building. The diffraction losses are often calculated as a function of obstruction with respect to the first
Fresnel zone. Fresnel zones are zones delimited by prolate ellipsoids of revolution with transmitter and
receiver as the two foci [2]; the nth
Fresnel zone is the loci of points with an excess path between (n-1)λ/2
and (n)λ/2 over the direct path. The odd Fresnel zones especially the first carry most of the propagation
energy; therefore it is highly essential the designed microwave link clears this region so as to have an
effective communication link.
2
3. > REPLACE THIS LINE WITH YOUR PAPER IDENTIFICATION NUMBER (DOUBLE-CLICK
HERE TO EDIT) <
The weather also plays a very important role in the propagation of radio waves. Since water is a very lossy
medium; large raindrops could cause significant attenuation, depolarization and scattering. Precipitation
rates and probability of rain occurrence have been measured and summarized globally. In the USA the rain
region pattern used is called the Crane rain region, these regional contours are used to gauge the probability
of heavy rain outrages.
In this paper we try to address most of these models and and how they help us develop and maintain
various microwave links in a constantly changing environment. We also discuss the effect of weather on
radio wave propagation.
2.FADING CAUSED BY MULTIPATH
Fading is the phenomenon caused due to multipath. Multipath is simply rays reaching its destination
through multiple paths. This is caused by the waves that are reflected by other surfaces in the environment
before it reaches its destination. The best way to describe this is using a two ray model. A source ray that
originates at the antenna has a direct path to its receiver and there is another ray which reaches the receiver
at a different path length due to surface reflection.
Figure 1: Path loss vs distance for one slope and two slope
When we plot the path loss power vs the distance graph for a single ray and a two ray model. We can see
that it is linear for a single ray and in a two ray model signals add constructively in some cases and in
others phase differences causes deep fades. These fades causes loss of data in telecommunication
systems.In a real world system there are going to be many number of reflected rays present between
various buildings/surfaces.
Figure 2: Multipath between a Tx and Rx between multiple buildings
3
4. > REPLACE THIS LINE WITH YOUR PAPER IDENTIFICATION NUMBER (DOUBLE-CLICK
HERE TO EDIT) <
The equation for the power received is given below
(3)
Where l1 and l’
1 are defined below
(4)
We assume a value of 10 feet for Wt and 40 feet for Ws and obtain the plot below.
Figure 3: Plot of fades caused my multipaths
We observe as we increase the number of rays the number of fades also increases this is due to the
destructive interference between multiple rays.
3. PROPAGATION MODEL IN URBAN AND SUB-URBAN CHANNELS
To overcome these fades and to provide an efficient microwave link; empirical models were designed.
Extensive measurements were performed in different urban and suburban environments and were modeled
into a general equation, of these the most significant empirical model was the COST 231-Hata model. This
model was derived by Okumura by performing extensive measurements and was later put into equation by
Hata and this model provides effective path loss estimates for large urban cells, suburban as well as rural
regions[3]. The derived equation is given below
LHata = c0 + cf log(f/1MHz) – b(hB/1m) – a(hM/1m) + (44.9-6.55 log(hB/1m)) log(d/1km) + CM (5)
The co cf and b(hB) almost remain constant between different regions. The values of a(hM) and CM vary
extensively and are modeled according to the city size and height. The data book of the COST project gives
the values for different cities. Using the above model we try to design the propagation characteristics in
Boulder at the University of Colorado campus. A signal generator was set up to transmit at 785 MHz
frequency form the engineering center through a directional panel antenna. Various data points of receiver
4
5. > REPLACE THIS LINE WITH YOUR PAPER IDENTIFICATION NUMBER (DOUBLE-CLICK
HERE TO EDIT) <
power were measured using a spectrum analyzer outside the engineering center and the readings are
tabulated as below. Antenna parameters are provided in the Appendix [A1].
Table 1: Measurements of received power at various distances
These data points were fed into EDX propagation design software and the actual propagation model was
designed.
Figure 4: Free space Propagation model
From the above design we can see that only 4 data points matches the actual measured values. This is
because the free space propagation model only considers the decay in power with respect do distance and
does not account for the fades from multipath. Now we calculate the various parameters of the COST 231
model for a suburban environment and input it in the EDX design software and run the simulation. We
import the antenna lobe pattern [A2] into the simulation tool and we obtain the COST 231 propagation
model and this model has managed to match 14 of the 21 different data points proving that it is an efficient
sub urban propagation model. The modeling equation for the sub-urban environment in boulder is given
below along with the propagation pattern.
5
6. > REPLACE THIS LINE WITH YOUR PAPER IDENTIFICATION NUMBER (DOUBLE-CLICK
HERE TO EDIT) <
Lhata = 69.55 dB + 26.16 log(f/1MHz) – 13.82 (hB/1m) – 1.1 log( f/1Mhz) - 0.7)hM/1m – 1.56 log ( f/1Mhz)
+ 0.8 + (44.9 – 6.55 log(hb/1m)) log (d/1km) – 2(log ( f/28mhz))2
- 5.4 (6)
Where hB defines the height of the base station or the Rx antenna whick can vary from 10m to 100m, hM
height of the mobile terminal which ranges from 0 m to10 m and hb gives the average height of the building
around the datapoints. For our case we assumed this to be 15-30 meters. We could only match 14 points
because of approximation of height values. Model is more accurate for accurate values of assumed height.
In the equation we have substituted values of c0, cf, b(hB),a(hM) and CM from the data book for a suburban
terrain operation between frequency range of 500-1500 MHz for a COST 231Hata model [A3]. The
software computes the Lhata and modifies the propagation model as given below and proves its validity for
suburban environments by managing to obtain a closer propagation model to the actual readings.
Figure 5: COST 231 propagation model
There is another model derived from the COST 231 model called the COST 231-Walfish Ikegami Model.
This model is based on the considerations of reflection and scattering above and between buildings in urban
environments. It considers the LOS and the NLOS situations hence it has an additional term compared to
the previous equation
LNLOS = L0 + Max{0, Lrts + Lmsd} (7)
The Lrts and the Lmsd are the factors representing the diffraction and scatters from rooftop to streets and Lmsd
is the Multi-diffraction between buildings. This model enables us to obtain a better model for dense urban
environments by tweaking the Loss equation by including additional parameters.
3. SMALL SCALE AND LARGE SCALE FADING
Small scale fading is explained by the fact that, the instantaneous received signal is a sum of many
contributions coming from different directions due to the many reflections of the transmitted signal
reaching the receiver [5]. In the time domain, multipath parameters can be seen as the spread of the arriving
waves but in the frequency domain, the concept becomes less intuitive and relates to a coherence
bandwidth, which refers to the width of the spectrum attenuated by the fade. Depending on the coherence
bandwidth the wave experiences flat fading or frequency selective fading. The amplitude of the signal
follows a Rayleigh fading distribution.Rayleigh fading channels are used in empirical urban studies and are
6
7. > REPLACE THIS LINE WITH YOUR PAPER IDENTIFICATION NUMBER (DOUBLE-CLICK
HERE TO EDIT) <
accepted to model multipath environments with no direct line of sight. The channel amplitude follows the
Rayleigh distribution:
P(α) = (2α /Ω) exp ( - α2
/Ω) (8)
Where, Ω is the mean square value of α
Now moving over to large scale fading which corresponds to losses caused due to blockage such as a
receiver turning into a corner or entering a building. This large-scale fading is referred to as shadowing.
Large scale variations caused by shadowing follow log normal distribution, which means when they are
converted to dB values they follow a Gaussian distribution.
P0(R) =1/2 erfc (-F/σ ) (9)
This is useful for calculating the edge reliability in wireless communications.
4. DIFFRACTION AND CLUTTER
Diffraction loss is a very significant component of microwave design. It depends on the path clearance, for
a given path clearance the diffraction loss will vary from a minimum value for a single knife-edge
obstruction to a maximum for smooth spherical obstructions [6]. Most of the microwave energy is
concentrated within the first Fresnel zone and the diffraction loss is always calculated as a function of
obstruction with respect to the first Fresnel zone. The dotted lines in the figure below represent the 1st
2nd
and 3rd
Fresnel zones. The obstruction height must always clear the first Fresnel zone or the microwave link
is going to suffer clutter or diffraction loss.
Figure 6: Fresnel zone geometry
F1 the radius of the first Fresnel ellipsoid can be approximated by the following formulae.
F1 = 17.3 (d1d2/f*d)1/2
(10)
There are infinite Fresnel zone in an real world environment. The even Fresnel are generally ignored
because they are totally in out of phase with the original signal and hence out the original signal and hence
it is not required in the design of a radio path. The diffraction loss is small when at least 55% of the first
Fresnel zone is cleared. There by using the formulae we can design systems so that it clears the 1st
Fresnel
zone.
7
8. > REPLACE THIS LINE WITH YOUR PAPER IDENTIFICATION NUMBER (DOUBLE-CLICK
HERE TO EDIT) <
To prove this we setup an antenna to radiate at 785 Mhz frequency using an antenna at a window in the
basement so there is NLOS measurement and various data points are noted on the map and measurements
of received power are taken at these points. We plot the radiation characteristics using the EDX software
without accounting for any of the environmental factors and considering it as a free space propagation
model.
Point RcvdPowerdBm Antangle Antgain dBi EIRP(dBm) pathloss dist(m) Receivedpower #VALUE!
1 -40.1 0 0 10 43 -93.1 100 -37.6 2
165N -66.7 20 -2 8 41 -115.7 165 -80 2.217484
181S -60.34 -30 -5 5 38 -103.34 181 -140 2.257679
2 -45.1 0 0 10 43 -98.1 200 -43.1 2.30103
254N -62.74 10 -1 9 42 -113.74 254 -73 2.404834
268N -87.8 30 -5 5 38 -130.8 268 -80.1 2.428135
270S -77.27 -20 -2 8 41 -126.27 270 -140 2.431364
3 -49.55 0 0 10 43 -102.55 300 -46.9 2.477121
320S -73.78 -10 -1 9 42 -124.78 320 -140 2.50515
325S -79.5 -30 -5 5 38 -122.5 325 -140 2.511883
4 -50.8 0 0 10 43 -103.8 400 -49.7 2.60206
400N -80 20 -2 8 41 -129 400 -93.2 2.60206
454S -51.3 -20 -2 8 41 -100.3 454 -90.9 2.657056
5 -68.5 0 0 10 43 -121.5 500 -91.7 2.69897
510N -84 30 -5 5 38 -127 510 -96.5 2.70757
510S -39.2 -30 -5 5 38 -82.2 510 -140 2.70757
550N -83 10 -1 9 42 -134 550 -82.8 2.740363
550S -85.3 -10 -1 9 42 -136.3 550 -140 2.740363
580S -81.8 -20 -2 8 41 -130.8 580 -140 2.763428
581N -86 20 -2 8 41 -135 581 -140 2.764176
582 -140 0 0 10 43 NA 582 -87.4 2.764923
Table 2 : Received power for 785 Hz at various data points
Figure 6: Free space propagation model
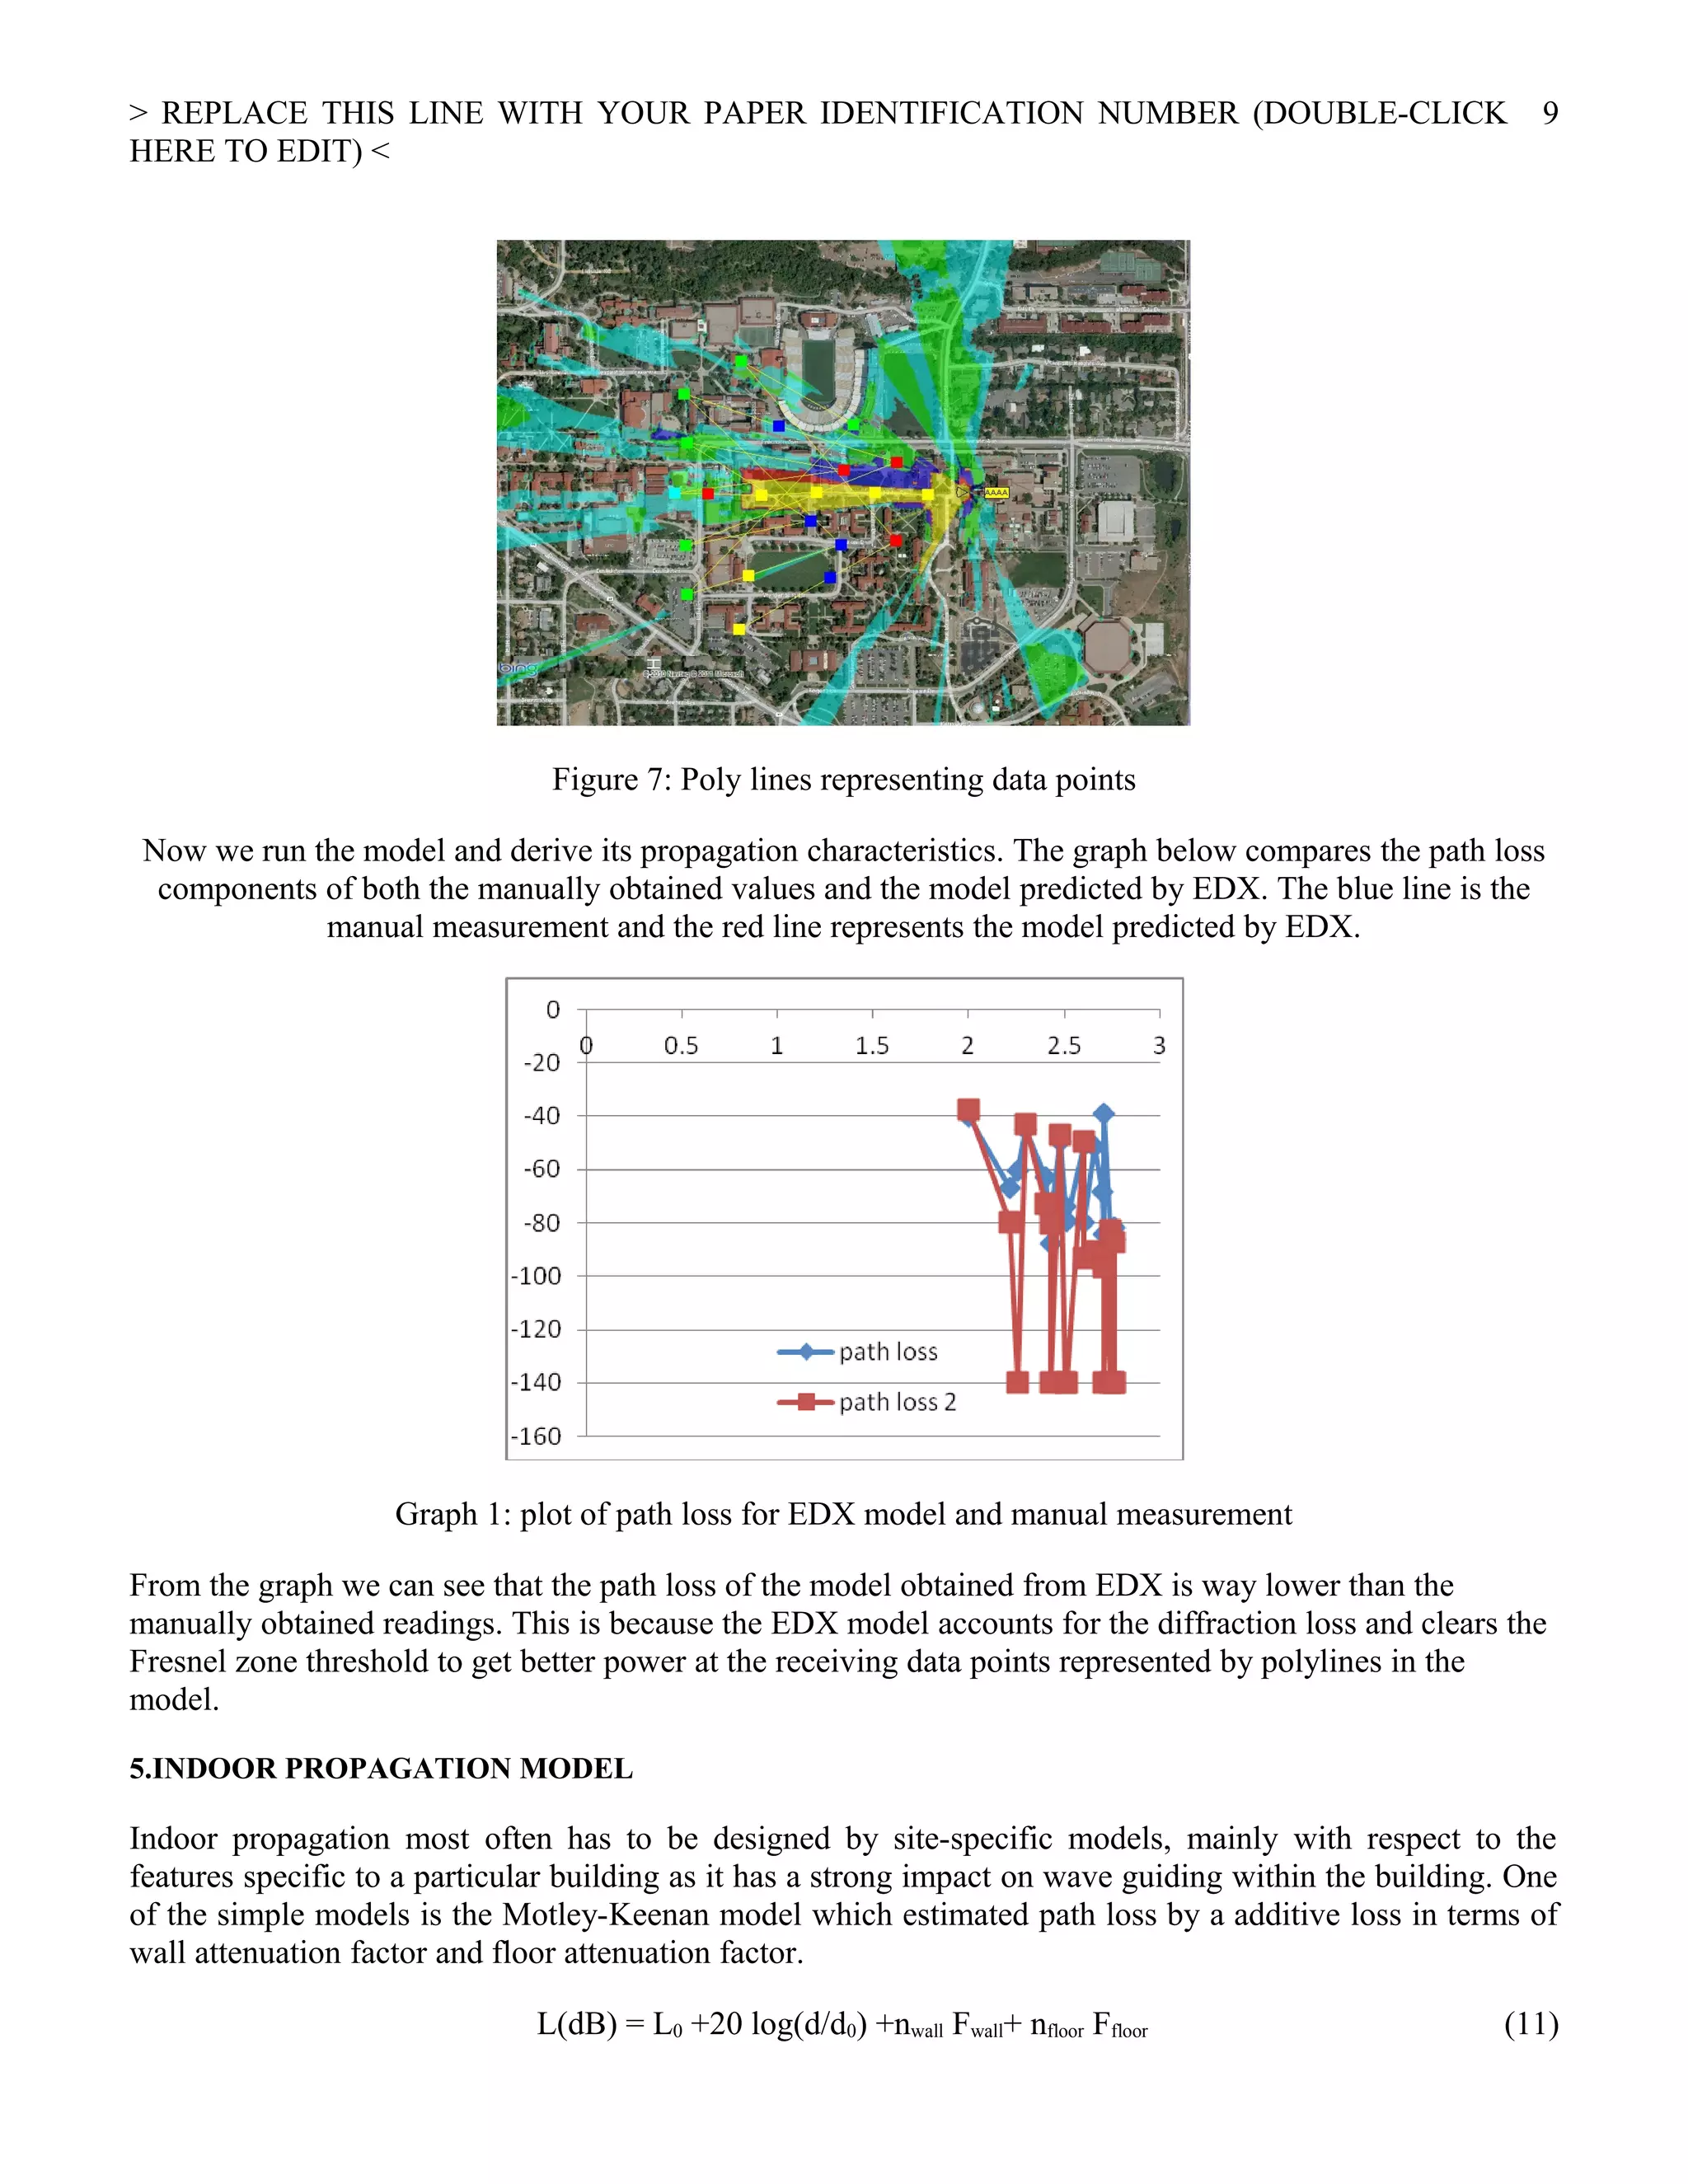
Now we zoom in to the model and draw the poly lines to tweak the model and account for the region data
and the average height of objects around the data points for clutter and diffraction losses [A4].
8
9. > REPLACE THIS LINE WITH YOUR PAPER IDENTIFICATION NUMBER (DOUBLE-CLICK
HERE TO EDIT) <
Figure 7: Poly lines representing data points
Now we run the model and derive its propagation characteristics. The graph below compares the path loss
components of both the manually obtained values and the model predicted by EDX. The blue line is the
manual measurement and the red line represents the model predicted by EDX.
Graph 1: plot of path loss for EDX model and manual measurement
From the graph we can see that the path loss of the model obtained from EDX is way lower than the
manually obtained readings. This is because the EDX model accounts for the diffraction loss and clears the
Fresnel zone threshold to get better power at the receiving data points represented by polylines in the
model.
5.INDOOR PROPAGATION MODEL
Indoor propagation most often has to be designed by site-specific models, mainly with respect to the
features specific to a particular building as it has a strong impact on wave guiding within the building. One
of the simple models is the Motley-Keenan model which estimated path loss by a additive loss in terms of
wall attenuation factor and floor attenuation factor.
L(dB) = L0 +20 log(d/d0) +nwall Fwall+ nfloor Ffloor (11)
9
10. > REPLACE THIS LINE WITH YOUR PAPER IDENTIFICATION NUMBER (DOUBLE-CLICK
HERE TO EDIT) <
The model simply approximates the number of walls and floors with an average loss for each. The COST
project also proposed a model for indoor penetration. This model considers the angle through which the
radiation enters a building and the material used to construct the walls of the building.
6. ATMOSPHERIC ABSORBPTION AND ITS EFFECTS
Due to temperature variations in the atmosphere the water vapor content will vary thereby creating different
refractive layers in the atmosphere, which will affect long range microwave links. This effect is dominant
in costal regions as the humidity is high in these regions. They create a refractive gradient in the
atmosphere which leads to multipath and hence fading. When we talk about humidity it directly implies to
the water vapor content in the atmosphere. The atmospheric absorption is dominated by the water vapor
and the oxygen content in the atmosphere. The absorption of microwave energy by oxygen is a result of
magnetic dipole interactions with the incident radiation due to the oxygen molecule’s permanent magnetic
dipole moment [7]. This creates transistors between the fine molecular structure levels of the allowed
rotational states. The general absorption rate for oxygen molecule in terms of dB/Km is given below.
AO2 = 7.19x10⁻³
+6.09/(f2
+0.27)+4.81/{(f-57)2
+1.5}) x f2
x10-3
(12)
The absorption of microwave energy by water vapor results from electric dipole interactions and its
theoretical treatment is similar to the case discussed above. The absorption rate can be given by the
following equation.
[13]
7. IMPACT OF RAIN ON RADIO CHANNELS
As we have seen in the earlier case water is a very lossy medium and as the size of the rain drop increases it
tends to leave its spherical shape and transforms to more of an oblate ellipsoid. Due to this change in shape
of the rain drop, its effect is more dominant in the horizontally polarized wave compared to that of the
vertically polarized wave. Hence, most design engineers prefer to use the vertically polarized wave. Also,
rain fades have more dominant effects on higher frequencies. Since, rain storms are a more localized
phenomena it only affects a portion of the microwave link. Hence various measurements are done
geographically to determine the precipitation rates and probability of rain occurrences. The commonly used
rain region data is the Crain rain region map. With the help of this model it is possible to estimate the
occurrence of rain over a huge geographical region and design systems accordingly. The effective path
length attenuated due to rain can be defined by the equation below:
Deff = d / 1 + (d/d0) [14]
Where do = 35e-0.015R0
.
01
R0.01= 100mm/h.
The rain attenuation is estimated by
A0.01= deff*k*(R0.01)α
[15]
10
11. > REPLACE THIS LINE WITH YOUR PAPER IDENTIFICATION NUMBER (DOUBLE-CLICK
HERE TO EDIT) <
Where k and α are the constants defined by the Crain region table.
Thus, it is possible compute rain attenuations for a specific region and design an efficient microwave link.
8. CONCLUSION
In this paper we have discussed how surfaces in urban environments affects the propagation of radio waves.
We managed to design empirical models to contain these propagation effects and how to establish an
effective microwave link in an urban/sub-urban channel also proving their validity by using simulation tool
EDX. Finally, we discuss on the propagation effects caused due to the atmosphere and rain. All these
empirical models and equations do not give a 100% efficient system by they manage to address the most of
the losses and provide us with a sufficiently effective radio link modeling strategy for Urban/Sub-urban
propagation channels.
References
[1] http://www.radio-electronics.com/info/propagation/radio-propagation/radio-propagation-overview-tutorial.php
[2] “Identification of Scattering objects in microcell in Urban Propagation channels” , Mir Ghoraishi, Member, IEEE, Junichi
Takada, Member, IEEE.IEEE TRANSACTIONS ON ANTENNAS AND PROPAGATION, VOL. 54, NO. 11, NOVEMBER
2006.
[3] “Modification of Universal okumura and Hata model for radio wave propagation” ,Lida Akhoondzadeh-Asl and Narges
Noori,IEEE,propagationProceedings of Asia-Pacific Microwave Conference 2007
[4] “Microcell Urban Propagation Channel Analysis Using Measurement Data”, Mir Ghoraishi, Jun-ichi Takada(Tokyo Institute
of Technology),IEEE Proceedings 2005.
[5] ”Morse.colorado.edu”,Notes Thomas Schwengler.
[6]” Full-Wave Computation of Clutter for VHF Ground RADAR over Irregular Terrain”,Le pauld,Ieee,
Radar, 2001 CIE International Conference on, Proceedings,p314-318.
[7] “The absorbption of radio waves by oxygen and watervapor in the atmosphere”,Straiton.a,IEEE TRANSACTIONS ON
ANTENNAS AND PROPAGATION, JULY 1975.
11
12. > REPLACE THIS LINE WITH YOUR PAPER IDENTIFICATION NUMBER (DOUBLE-CLICK
HERE TO EDIT) <
APPENDIX
[A1] Antenna parameters
RX antenna:
Dipole Antenna (0.8 to 1 GHz) for 2650A / 2652A / 2658A.
Frequency Range: 0.8 to 1 GHz
Antenna Gain: >1 dBi
VSWR: <1.5
Connector: Type N(m)
Weight: approx. 20 g
Dipole Antenna (0.8 to 1 GHz)
TX antenna:
No ITEM TYPICAL
1 Frequency Range 740 - 785 MHz
2 Impedance 50 ohms
3 VSWR (or Return Loss) < 1.5:1 ( or > 14dB)
4 Gain >9.5dBi
5 Polarization Vertical, Linear
6 3dB Horizontal Beamwidth 66 Degrees
7 3dB Vertical Beamwidth 66 Degrees
8 Front to Back Ratio >20dB
A[2]
Antenna Pattern of 785 MHz.- Pat file - CSI-AP-698-2.2K-7-10 PS700_1.pat
12
13. > REPLACE THIS LINE WITH YOUR PAPER IDENTIFICATION NUMBER (DOUBLE-CLICK
HERE TO EDIT) <
A[3]
13
14. > REPLACE THIS LINE WITH YOUR PAPER IDENTIFICATION NUMBER (DOUBLE-CLICK
HERE TO EDIT) <
A[4]
Accounting for clutter height and vegetation losses.
Colour codes for the Propagation Figure 6 and 7
Accounting for clutter height values
14
15. > REPLACE THIS LINE WITH YOUR PAPER IDENTIFICATION NUMBER (DOUBLE-CLICK
HERE TO EDIT) <
Path loss calculations done similar to the table below
15
16. > REPLACE THIS LINE WITH YOUR PAPER IDENTIFICATION NUMBER (DOUBLE-CLICK
HERE TO EDIT) <
16