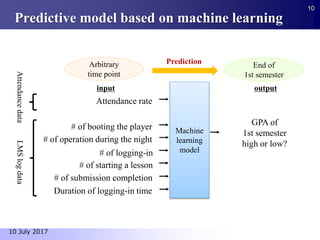
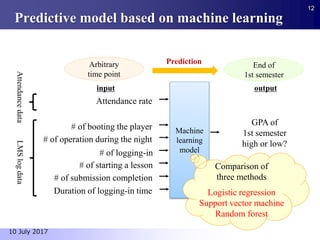
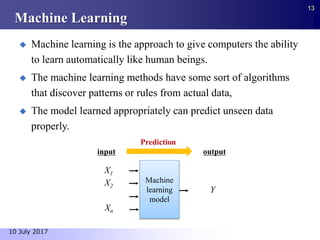
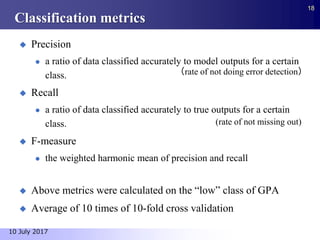
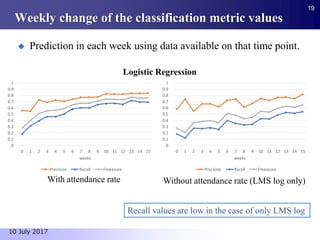
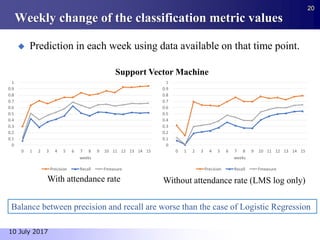
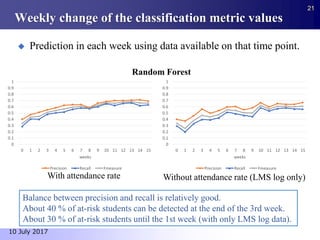
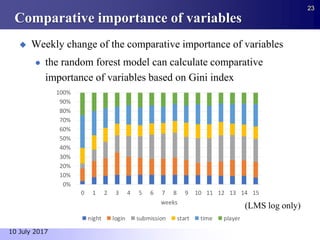
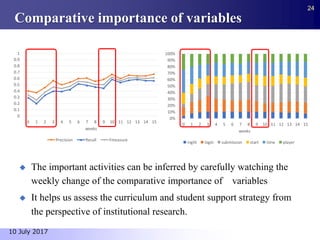
Nobuhiko KONDO1), Midori OKUBO2) and Toshiharu HATANAKA3)
1) University Education Center, Tokyo Metropolitan University
2) School of Engineering, Osaka University
3) Department of Information Science and Technology, Osaka University
Early Detection of At-Risk Students
Using Machine Learning
Based on LMS Log Data
10 July 2017
1
Analytics in education
 Analytics in education has been received much attention over
the past decade.
 The word of “Educational big data”
has been used in recent years.
 Many related fields
 Institutional Research (IR)
 Learning Analytics(LA)
 Educational Data Mining(EDM)
2
10 July 2017
What is Learning Analytics?
 Call for papers of 1st International Conference on Learning
Analytics and Knowledge(LAK) (2011)
 Horizon Report 2012
 The goal of learning analytics is to enable teachers and schools
to tailor educational opportunities to each student’s level of
need and ability in close-to-real time.
3
10 July 2017
Learning analytics is the measurement, collection,
analysis and reporting of data about learners and their
contexts, for purposes of understanding and optimising
learning and the environments in which it occurs.
Early detection of at-risk students
 For educational institutions,
especially colleges or universities,
it is necessary that high retention rate is maintained,
therefore enrollment management is important.
 In recent studies, for example,
early detection of at-risk students with learning analytics
has been considered in this context.
4
10 July 2017
Overview of this study
 Several studies also investigated the correlation between
learning outcome and usage of learning management system
(LMS), and the log data of LMS have turned to be useful to
analyze students’ learning behavior.
 In this study, an approach to detection of academically at-risk
students by using machine learning methods based on log data
of LMS is proposed.
 Then results of some numerical experiments with actual data
implemented to investigate the performance of the approach
will be shown.
5
10 July 2017
Predictive model of at-risk students
with LMS data
6
10 July 2017
LMS used in this study
 In the university X, a LMS is used on the whole university.
 Students should use the LMS
 to manage their own learning in several classes
 to check some information from the university
 to use an e-portfolio system
 to learn with some self-learning contents, and so on.
 They are expected to use the LMS enough throughout their
school life.
 Although the LMS is not very often used in some classes,
a level of usage is expected to reflect a level of commitment to
learning in the university, because the students need to use it to
spend their school life smoothly.
7
10 July 2017
LMS used in this study
 The LMS records a logfile whenever any students operate it.
 One record contains
 the student ID,
 the operating date
 the type of operation.
8
10 July 2017
Sample of LMS log data
ID Date Operation Category Detail
AAAAAA 2015-04-01
12:00:00.472812
Login Home
BBBBBB 2015-04-01
12:00:14.121184
Login Home
CCCCCC 2015-04-01
12:01:02.395736
Login Home
AAAAAA 2015-04-01
12:01:23.023648
Switching
function
Information
DDDDDD 2015-04-01
12:01:53.957362
Login Home
BBBBBB 2015-04-01
12:00:00.111111
Switching
function
Settings
AAAAAA 2015-04-01
12:00:00.111111
Lesson start Report Class A
…
…
…
…
…
9
10 July 2017
Predictive model based on machine learning
10
10 July 2017
# of booting the player Machine
learning
model
Attendance rate
# of operation during the night
# of logging-in
# of submission completion
Duration of logging-in time
GPA of
1st semester
high or low?
# of starting a lesson
input output
Arbitrary
time point
End of
1st semester
Prediction
AttendancedataLMSlogdata
GPA was binarized based on
the distribution of students’ GPA
(µ =2.164,σ = 0.96)
GPA > (μ – σ)⇒ high
GPA ≦ (μ – σ)⇒ low (at-risk)
Variables used in this study
Type Variables Data source
Response
variable
(1) GPA Grade data
Explanatory
variable
(2) Attendance rate Attendance data
(3) # of booting the player
LMS log data
(4) # of operation during the night
(5) # of logging-in
(6) # of starting a lesson
(7) # of submission completion
(8) Duration of logging-in time
10 July 2017
11
Predictive model based on machine learning
12
10 July 2017
# of booting the player Machine
learning
model
Attendance rate
# of operation during the night
# of logging-in
# of submission completion
Duration of logging-in time
GPA of
1st semester
high or low?
# of starting a lesson
input output
Comparison of
three methods
Logistic regression
Support vector machine
Random forest
Arbitrary
time point
End of
1st semester
Prediction
AttendancedataLMSlogdata
Machine Learning
 Machine learning is the approach to give computers the ability
to learn automatically like human beings.
 The machine learning methods have some sort of algorithms
that discover patterns or rules from actual data,
 The model learned appropriately can predict unseen data
properly.
13
10 July 2017
Machine
learning
model
input
Prediction
output
X1
X2
Xn
Y
Machine learning methods used in this study
 Logistic regression is a kind of generalized linear model and used
often as two class classifier.
 Due to its easiness to handle and applicability, it has been used in
several fields.
 Support vector machine (SVM) is a kernel machine widely used for
pattern classification and regression problem.
 As it is said that SVM has high generalization ability, it has been used
widely as well as the logistic regression.
 Random forest is one of the ensemble learning model. The random
forest model contains some simple decision trees as weak learners
and output the value as the average or majority vote of outputs of
the decision trees.
 It is known that the random forest model has some advantage such as
robustness against the noise, quickness of learning, easiness of setting
the hyper parameter, and so on.
14
10 July 2017
Numerical Experiments
15
10 July 2017
Numerical Experiments
 From the purpose of this study,
an at-risk student detecting method should have
an ability to detect such students as early as possible.
 Therefore, we performed an experiment
to investigate how the detection ability changes
for each week in the first semester.
 The period of classes per a semester of the target university is
15 weeks.
16
10 July 2017
Data and experimental environment
 Data used in the experiments
 Records of 202 students admitted to
the department Y of the university X in 2015.
 All logfiles of a period
between April 1st and August 5th in 2015 were used.
 The number of record was 200,979.
 Experimental environment
 Python 3.6.0
 scikit-learn package
17
10 July 2017
Classification metrics
 Precision
 a ratio of data classified accurately to model outputs for a certain
class.
 Recall
 a ratio of data classified accurately to true outputs for a certain
class.
 F-measure
 the weighted harmonic mean of precision and recall
 Above metrics were calculated on the “low” class of GPA
 Average of 10 times of 10-fold cross validation
18
10 July 2017
(rate of not doing error detection)
(rate of not missing out)
Weekly change of the classification metric values
 Prediction in each week using data available on that time point.
19
10 July 2017
0
0.1
0.2
0.3
0.4
0.5
0.6
0.7
0.8
0.9
1
0 1 2 3 4 5 6 7 8 9 10 11 12 13 14 15
weeks
Precision Recall Fmeasure
0
0.1
0.2
0.3
0.4
0.5
0.6
0.7
0.8
0.9
1
0 1 2 3 4 5 6 7 8 9 10 11 12 13 14 15
weeks
Precision Recall Fmeasure
Logistic Regression
Recall values are low in the case of only LMS log
With attendance rate Without attendance rate (LMS log only)
Weekly change of the classification metric values
 Prediction in each week using data available on that time point.
20
10 July 2017
0
0.1
0.2
0.3
0.4
0.5
0.6
0.7
0.8
0.9
1
0 1 2 3 4 5 6 7 8 9 10 11 12 13 14 15
weeks
Precision Recall Fmeasure
0
0.1
0.2
0.3
0.4
0.5
0.6
0.7
0.8
0.9
1
0 1 2 3 4 5 6 7 8 9 10 11 12 13 14 15
weeks
Precision Recall Fmeasure
Balance between precision and recall are worse than the case of Logistic Regression
Support Vector Machine
With attendance rate Without attendance rate (LMS log only)
Weekly change of the classification metric values
 Prediction in each week using data available on that time point.
21
10 July 2017
0
0.1
0.2
0.3
0.4
0.5
0.6
0.7
0.8
0.9
1
0 1 2 3 4 5 6 7 8 9 10 11 12 13 14 15
weeks
Precision Recall Fmeasure
0
0.1
0.2
0.3
0.4
0.5
0.6
0.7
0.8
0.9
1
0 1 2 3 4 5 6 7 8 9 10 11 12 13 14 15
weeks
Precision Recall Fmeasure
Balance between precision and recall is relatively good.
About 40 % of at-risk students can be detected at the end of the 3rd week.
About 30 % of at-risk students until the 1st week (with only LMS log data).
With attendance rate Without attendance rate (LMS log only)
Random Forest
Comparative importance of variables
 It would be preferable to investigate which variable affect the
classification ability strongly.
 As the random forest model can calculate comparative
importance of variables based on Gini index, we investigated
weekly change of the importance of variables as an approach
to deal with such a problem.
22
10 July 2017
Comparative importance of variables
 Weekly change of the comparative importance of variables
 the random forest model can calculate comparative
importance of variables based on Gini index
23
10 July 2017
0%
10%
20%
30%
40%
50%
60%
70%
80%
90%
100%
0 1 2 3 4 5 6 7 8 9 10 11 12 13 14 15
weeks
night login submission start time player
(LMS log only)
Comparative importance of variables
 The important activities can be inferred by carefully watching the
weekly change of the comparative importance of variables
 It helps us assess the curriculum and student support strategy from
the perspective of institutional research.
24
10 July 2017
0%
10%
20%
30%
40%
50%
60%
70%
80%
90%
100%
0 1 2 3 4 5 6 7 8 9 10 11 12 13 14 15
weeks
night login submission start time player
0
0.1
0.2
0.3
0.4
0.5
0.6
0.7
0.8
0.9
1
0 1 2 3 4 5 6 7 8 9 10 11 12 13 14 15
weeks
Precision Recall Fmeasure
Conclusions
 We considered automatic detecting method for at-risk
students.
 We examined the typical machine learning techniques to such
students based on the actual log data of LMS and investigated
their performance.
 As the approach can detect a sign of off-task behavior of
students with only the log data, a certain level of applicability of
the approach is shown.
 It is indicated that some characteristics of behavior about
learning which affect the learning outcomes can be detected with
only the online log data.
25
10 July 2017
Conclusions
 Furthermore, comparative importance of explanatory variables
would help to estimate which variable affects comparatively to
the learning outcome at any given point of time.
 By watching the importance of variable constantly, it is
expected that an intervention strategy will be more adaptively
and planning of classes, curriculum and student support can be
considered based on the information.
26
10 July 2017
Thank you for your kind attention!
kondo@tmu.ac.jp
@nobuhiko_kondo
27
10 July 2017

Early Detection of At-Risk Students Using Machine Learning Based on LMS Log Data

  • 1.
    Nobuhiko KONDO1), MidoriOKUBO2) and Toshiharu HATANAKA3) 1) University Education Center, Tokyo Metropolitan University 2) School of Engineering, Osaka University 3) Department of Information Science and Technology, Osaka University Early Detection of At-Risk Students Using Machine Learning Based on LMS Log Data 10 July 2017 1
  • 2.
    Analytics in education Analytics in education has been received much attention over the past decade.  The word of “Educational big data” has been used in recent years.  Many related fields  Institutional Research (IR)  Learning Analytics(LA)  Educational Data Mining(EDM) 2 10 July 2017
  • 3.
    What is LearningAnalytics?  Call for papers of 1st International Conference on Learning Analytics and Knowledge(LAK) (2011)  Horizon Report 2012  The goal of learning analytics is to enable teachers and schools to tailor educational opportunities to each student’s level of need and ability in close-to-real time. 3 10 July 2017 Learning analytics is the measurement, collection, analysis and reporting of data about learners and their contexts, for purposes of understanding and optimising learning and the environments in which it occurs.
  • 4.
    Early detection ofat-risk students  For educational institutions, especially colleges or universities, it is necessary that high retention rate is maintained, therefore enrollment management is important.  In recent studies, for example, early detection of at-risk students with learning analytics has been considered in this context. 4 10 July 2017
  • 5.
    Overview of thisstudy  Several studies also investigated the correlation between learning outcome and usage of learning management system (LMS), and the log data of LMS have turned to be useful to analyze students’ learning behavior.  In this study, an approach to detection of academically at-risk students by using machine learning methods based on log data of LMS is proposed.  Then results of some numerical experiments with actual data implemented to investigate the performance of the approach will be shown. 5 10 July 2017
  • 6.
    Predictive model ofat-risk students with LMS data 6 10 July 2017
  • 7.
    LMS used inthis study  In the university X, a LMS is used on the whole university.  Students should use the LMS  to manage their own learning in several classes  to check some information from the university  to use an e-portfolio system  to learn with some self-learning contents, and so on.  They are expected to use the LMS enough throughout their school life.  Although the LMS is not very often used in some classes, a level of usage is expected to reflect a level of commitment to learning in the university, because the students need to use it to spend their school life smoothly. 7 10 July 2017
  • 8.
    LMS used inthis study  The LMS records a logfile whenever any students operate it.  One record contains  the student ID,  the operating date  the type of operation. 8 10 July 2017
  • 9.
    Sample of LMSlog data ID Date Operation Category Detail AAAAAA 2015-04-01 12:00:00.472812 Login Home BBBBBB 2015-04-01 12:00:14.121184 Login Home CCCCCC 2015-04-01 12:01:02.395736 Login Home AAAAAA 2015-04-01 12:01:23.023648 Switching function Information DDDDDD 2015-04-01 12:01:53.957362 Login Home BBBBBB 2015-04-01 12:00:00.111111 Switching function Settings AAAAAA 2015-04-01 12:00:00.111111 Lesson start Report Class A … … … … … 9 10 July 2017
  • 10.
    Predictive model basedon machine learning 10 10 July 2017 # of booting the player Machine learning model Attendance rate # of operation during the night # of logging-in # of submission completion Duration of logging-in time GPA of 1st semester high or low? # of starting a lesson input output Arbitrary time point End of 1st semester Prediction AttendancedataLMSlogdata
  • 11.
    GPA was binarizedbased on the distribution of students’ GPA (µ =2.164,σ = 0.96) GPA > (μ – σ)⇒ high GPA ≦ (μ – σ)⇒ low (at-risk) Variables used in this study Type Variables Data source Response variable (1) GPA Grade data Explanatory variable (2) Attendance rate Attendance data (3) # of booting the player LMS log data (4) # of operation during the night (5) # of logging-in (6) # of starting a lesson (7) # of submission completion (8) Duration of logging-in time 10 July 2017 11
  • 12.
    Predictive model basedon machine learning 12 10 July 2017 # of booting the player Machine learning model Attendance rate # of operation during the night # of logging-in # of submission completion Duration of logging-in time GPA of 1st semester high or low? # of starting a lesson input output Comparison of three methods Logistic regression Support vector machine Random forest Arbitrary time point End of 1st semester Prediction AttendancedataLMSlogdata
  • 13.
    Machine Learning  Machinelearning is the approach to give computers the ability to learn automatically like human beings.  The machine learning methods have some sort of algorithms that discover patterns or rules from actual data,  The model learned appropriately can predict unseen data properly. 13 10 July 2017 Machine learning model input Prediction output X1 X2 Xn Y
  • 14.
    Machine learning methodsused in this study  Logistic regression is a kind of generalized linear model and used often as two class classifier.  Due to its easiness to handle and applicability, it has been used in several fields.  Support vector machine (SVM) is a kernel machine widely used for pattern classification and regression problem.  As it is said that SVM has high generalization ability, it has been used widely as well as the logistic regression.  Random forest is one of the ensemble learning model. The random forest model contains some simple decision trees as weak learners and output the value as the average or majority vote of outputs of the decision trees.  It is known that the random forest model has some advantage such as robustness against the noise, quickness of learning, easiness of setting the hyper parameter, and so on. 14 10 July 2017
  • 15.
  • 16.
    Numerical Experiments  Fromthe purpose of this study, an at-risk student detecting method should have an ability to detect such students as early as possible.  Therefore, we performed an experiment to investigate how the detection ability changes for each week in the first semester.  The period of classes per a semester of the target university is 15 weeks. 16 10 July 2017
  • 17.
    Data and experimentalenvironment  Data used in the experiments  Records of 202 students admitted to the department Y of the university X in 2015.  All logfiles of a period between April 1st and August 5th in 2015 were used.  The number of record was 200,979.  Experimental environment  Python 3.6.0  scikit-learn package 17 10 July 2017
  • 18.
    Classification metrics  Precision a ratio of data classified accurately to model outputs for a certain class.  Recall  a ratio of data classified accurately to true outputs for a certain class.  F-measure  the weighted harmonic mean of precision and recall  Above metrics were calculated on the “low” class of GPA  Average of 10 times of 10-fold cross validation 18 10 July 2017 (rate of not doing error detection) (rate of not missing out)
  • 19.
    Weekly change ofthe classification metric values  Prediction in each week using data available on that time point. 19 10 July 2017 0 0.1 0.2 0.3 0.4 0.5 0.6 0.7 0.8 0.9 1 0 1 2 3 4 5 6 7 8 9 10 11 12 13 14 15 weeks Precision Recall Fmeasure 0 0.1 0.2 0.3 0.4 0.5 0.6 0.7 0.8 0.9 1 0 1 2 3 4 5 6 7 8 9 10 11 12 13 14 15 weeks Precision Recall Fmeasure Logistic Regression Recall values are low in the case of only LMS log With attendance rate Without attendance rate (LMS log only)
  • 20.
    Weekly change ofthe classification metric values  Prediction in each week using data available on that time point. 20 10 July 2017 0 0.1 0.2 0.3 0.4 0.5 0.6 0.7 0.8 0.9 1 0 1 2 3 4 5 6 7 8 9 10 11 12 13 14 15 weeks Precision Recall Fmeasure 0 0.1 0.2 0.3 0.4 0.5 0.6 0.7 0.8 0.9 1 0 1 2 3 4 5 6 7 8 9 10 11 12 13 14 15 weeks Precision Recall Fmeasure Balance between precision and recall are worse than the case of Logistic Regression Support Vector Machine With attendance rate Without attendance rate (LMS log only)
  • 21.
    Weekly change ofthe classification metric values  Prediction in each week using data available on that time point. 21 10 July 2017 0 0.1 0.2 0.3 0.4 0.5 0.6 0.7 0.8 0.9 1 0 1 2 3 4 5 6 7 8 9 10 11 12 13 14 15 weeks Precision Recall Fmeasure 0 0.1 0.2 0.3 0.4 0.5 0.6 0.7 0.8 0.9 1 0 1 2 3 4 5 6 7 8 9 10 11 12 13 14 15 weeks Precision Recall Fmeasure Balance between precision and recall is relatively good. About 40 % of at-risk students can be detected at the end of the 3rd week. About 30 % of at-risk students until the 1st week (with only LMS log data). With attendance rate Without attendance rate (LMS log only) Random Forest
  • 22.
    Comparative importance ofvariables  It would be preferable to investigate which variable affect the classification ability strongly.  As the random forest model can calculate comparative importance of variables based on Gini index, we investigated weekly change of the importance of variables as an approach to deal with such a problem. 22 10 July 2017
  • 23.
    Comparative importance ofvariables  Weekly change of the comparative importance of variables  the random forest model can calculate comparative importance of variables based on Gini index 23 10 July 2017 0% 10% 20% 30% 40% 50% 60% 70% 80% 90% 100% 0 1 2 3 4 5 6 7 8 9 10 11 12 13 14 15 weeks night login submission start time player (LMS log only)
  • 24.
    Comparative importance ofvariables  The important activities can be inferred by carefully watching the weekly change of the comparative importance of variables  It helps us assess the curriculum and student support strategy from the perspective of institutional research. 24 10 July 2017 0% 10% 20% 30% 40% 50% 60% 70% 80% 90% 100% 0 1 2 3 4 5 6 7 8 9 10 11 12 13 14 15 weeks night login submission start time player 0 0.1 0.2 0.3 0.4 0.5 0.6 0.7 0.8 0.9 1 0 1 2 3 4 5 6 7 8 9 10 11 12 13 14 15 weeks Precision Recall Fmeasure
  • 25.
    Conclusions  We consideredautomatic detecting method for at-risk students.  We examined the typical machine learning techniques to such students based on the actual log data of LMS and investigated their performance.  As the approach can detect a sign of off-task behavior of students with only the log data, a certain level of applicability of the approach is shown.  It is indicated that some characteristics of behavior about learning which affect the learning outcomes can be detected with only the online log data. 25 10 July 2017
  • 26.
    Conclusions  Furthermore, comparativeimportance of explanatory variables would help to estimate which variable affects comparatively to the learning outcome at any given point of time.  By watching the importance of variable constantly, it is expected that an intervention strategy will be more adaptively and planning of classes, curriculum and student support can be considered based on the information. 26 10 July 2017
  • 27.
    Thank you foryour kind attention! kondo@tmu.ac.jp @nobuhiko_kondo 27 10 July 2017