SlideShare a Scribd company logo
A. L. Wagner Appraisal Group, Inc.
                                       Real Estate Appraisers & Consultants

1807 S. Washington Street, Suite 110                                                             Telephone (630) 416-6556
Naperville, IL 60565                                                                                   Fax (630) 416-6591
www.WagnerAppraisal.com                                                                 E-Mail: Chip@WagnerAppraisal.com

   Alvin L. “Chip” Wagner III, SRA, SCRP


                                         JULY 2010 eNEWSLETTER

   Dear Chicago-Area Real Estate Community and other interested parties in real estate and relocation:

   Attached please find my July Statistics:
       Monthly Market Pulse for Detached Housing;
       Monthly Market Pulse for Attached Housing;
       Quarterly Report with data from previous 12-month period. (7/1/2009 to 6/30/2010)

   The Quarterly Report shows the community statistics for total active listings, total under contract, sales volume
   over the past 12 months and the resulting MSI (Months Supply of Inventory). It also reports the Mean Sales
   Price. In the far right column shows the MSI and Mean Sales Price for the same period one year ago with the
   percent of change. In this eNewsletter, I am sharing the trended information for the entire Chicagoland region
   for each category in the Quarterly Report since 2005 (at our market’s peak).


   The graph above shows the increasing trend in the number of active listings in the Chicago region that peaked
   in 2008, and has been declining. Fewer active listings help to decrease the supply of inventory.
The graph above shows the increasing trend in the number of contract pendings in the Chicago region that
peaked at a low in the first quarter of 2009, and has steadily increased since then. The 2010 totals are the
highest they have been since 2006, and the continued increase in contract pendings is a good sign of continued
sales activity. This has been in part the market’s reaction to the $6,500 and $8,000 tax incentives that expired
on April 30th. This tax credit was to help spur activity, and it succeeded.


The graph above shows the increasing trend in the number of sales to take place in the Chicago region. This
annualized stat shows the market bottomed in early 2009, and has been increasing ever since. From the end of
2005 to the beginning of 2009, the drop in sales volume was approximately 50%. Since fewer homes were
selling, the inventory increased. The basic laws of Supply and Demand lead to the declining values our market
has faced.
The graph above shows the first three quarters of each year, the MSI increased, and the fourth quarter it
decreased and then returned to the same trend the following year. In 2009, the MSI actually began decreasing
between the 2nd quarter and 3rd quarter. It has remained somewhat stable over the past 3 quarters.

The Months Supply of Inventory (MSI) is a calculation that measures the relationship between the number of
active listings on the market as compared to the rate at which they are selling.

      Less than 3 months of supply will place strong pressure on prices upward, which could result in as high
       as double digit appreciation.
      3 to 4 Months of supply will place pressure on prices upward, resulting in appreciating values.
      5 to 6 Months of supply is generally considered a balanced market with little to no fluctuation in value.
      7 to 8 Months supply is going to result in downward pressure on prices, usually leading to declining
       values.
      Over a 9 Month supply is an extreme oversupply, placing strong downward pressure on prices,
       potentially at a double digit annual rate.

The good news is the continued downward trend in the Inventory Levels.
At the end of the first quarter, in my April eNewsletter, I reported that there was “Finally Something Positive to
Say.” I discussed the statistics in the quarterly report had shown 41% of the communities analyzed in the report
showed either increasing, or stable mean sales prices from the previous quarter. This was important because it
is the first period since 2007 that shows areas with increasing prices from the previous quarter. But the overall
Chicagoland average was still in decline.

At the end of the 2nd quarter of 2010, we see the first increase in Mean Sales Price since the middle of 2007.
The graph above shows the Mean Sales Price as of the end of the 1st quarter to the end of the 2nd quarter
increased 2.74%. This is after a 34% decrease over the previous 10 quarters.

And of the 186 suburban communities profiled in the Quarterly Report, 96 communities (48.9%) showed a
positive increase or barely negligible change of less than ½ % downward.

There are continued concerns of the shadow inventory and the homes in pre-foreclosure and foreclosure that
have not hit the market yet. It is difficult to measure the impact of this. The real concern is the economy and
Unemployment. Once people have jobs, they can pay their mortgage. When they pay their mortgage,
foreclosures go down. The following table shows local unemployment levels going back 10 years. Cook and
DuPage Counties are seeing increasing levels, but the State and National averages are seeing a decline.

 Unemployment by County-Chicago Metro Area                                                                      (Source: IDES)
              Cook         DuPage        Kane        Lake         McHenry          Will      State of IL      National
  Jun-10      10.9%         9.0%         10.8%       10.3%         9.9%           11.0%        10.4%            9.5%
  Dec-09      10.8%         8.6%         11.2%       11.6%         10.4%          11.0%        11.0%           10.0%
  Dec-08      7.1%          5.4%         7.5%        8.3%          6.9%           7.2%          7.9%            7.6%
  Dec-07      5.1%          3.8%         4.8%        5.0%          4.3%           4.7%          5.0%            4.6%
  Dec-06      4.7%          3.4%         4.3%        4.2%          3.7%           4.3%          4.6%            4.6%
  Dec-05      6.5%          4.7%         5.7%        4.5%          5.1%           5.5%          5.7%            5.1%
  Dec-04      6.6%          5.0%         6.0%        5.3%          5.2%           5.9%          5.8%            5.7%
  Nov-03       7.3%         5.2%         7. 0%       6.2%          6.3%           6.9%          6.7%            6.0%
  Nov-02       7.4%         5.2%         6.6%        5.6%          5.7%           6.3%          6.5%            5.8%
  Nov-01       6.1%         3.9%         5.3%        4.5%          4.5%           5.1%          5.4%            4.7%
  Nov-00       4.9%         2.9%         4.3%        3.5%          3.4%           4.2%          4.4%            4.0%

Thanks for your continued interest. I frequently post real estate and appraisal-related information on my
Facebook page and blog at: http://chipwags.blogspot.com/. Follow my company Facebook page at:
http://www.facebook.com/pages/Naperville-IL/AL-Wagner-Apprasial-Group/368919896256?v=wall

Regards,

Chip
Alvin “Chip” Wagner III, SRA, SCRP (RAC Member)

A. L. Wagner Appraisal Group, Inc. is proud to have been serving the Chicago metropolitan area since 1970 by its founder Alvin Wagner Jr.
Currently lead by his son Alvin III, known as “Chip,” we specialize in corporate relocation appraisals and complete residential appraisals for all
purposes including lending, REO/Foreclosure, Legal (divorce, estates, trusts, litigation support), market value appraisals for Realtors and
individuals for both listing and selling purposes. Visit www.WagnerAppraisal.com for more information on our qualifications and services. Thank
you for your referrals!

If you know of someone who would benefit by this newsletter or our market studies, please feel free to pass them along. If you would like to be
removed from my distribution list, please send an e-mail to: Chip@WagnerAppraisal.com. All information contained in this eNewsletter was created
by Alvin L. “Chip” Wagner III, SRA, SCRP and is the opinion of the author. Market statistics were derived from the MRED, LLC and the former
Multiple Listing Service of Northern Illinois.

More Related Content

What's hot

This Month in Real Estate for US Market July 2009
This Month in Real Estate for US Market July 2009This Month in Real Estate for US Market July 2009
This Month in Real Estate for US Market July 2009
Keller Williams Careers
 
September 2016 Boston Real Estate Market Trends
September 2016 Boston Real Estate Market TrendsSeptember 2016 Boston Real Estate Market Trends
September 2016 Boston Real Estate Market Trends
Joe Schutt
 
Annie Williams Real Estate Report - November 2021
Annie Williams Real Estate Report - November 2021Annie Williams Real Estate Report - November 2021
Annie Williams Real Estate Report - November 2021
Annie Williams
 
August 2016 Boston Real Estate Market Trends
August 2016 Boston Real Estate Market TrendsAugust 2016 Boston Real Estate Market Trends
August 2016 Boston Real Estate Market Trends
Anna Burns
 
March Market Trends Report
March Market Trends ReportMarch Market Trends Report
March Market Trends ReportCate8364
 
National Residential Real Estate Market - January 2019 update
National Residential Real Estate Market - January 2019 updateNational Residential Real Estate Market - January 2019 update
National Residential Real Estate Market - January 2019 update
Scott Rodgers
 
Oahu real-estate-statistics-monthly-update-june2014
Oahu real-estate-statistics-monthly-update-june2014Oahu real-estate-statistics-monthly-update-june2014
Oahu real-estate-statistics-monthly-update-june2014
Eric West
 
2014 Market Forecast - California Association of Realtors
2014 Market Forecast - California Association of Realtors2014 Market Forecast - California Association of Realtors
2014 Market Forecast - California Association of Realtors
Ronny Budiutama
 
December 2016 Greater Boston Real Estate Market Trends
December 2016 Greater Boston Real Estate Market TrendsDecember 2016 Greater Boston Real Estate Market Trends
December 2016 Greater Boston Real Estate Market Trends
Joe Schutt
 
GBAR Monthly Housing Market Data November 2016
GBAR Monthly Housing Market Data November 2016GBAR Monthly Housing Market Data November 2016
GBAR Monthly Housing Market Data November 2016
Joe Schutt
 
Greater Boston Association of Realtors Monthly Housing Data: October 2016
Greater Boston Association of Realtors Monthly Housing Data: October 2016Greater Boston Association of Realtors Monthly Housing Data: October 2016
Greater Boston Association of Realtors Monthly Housing Data: October 2016
Joe Schutt
 
2016 ECONOMIC AND HOUSING MARKET FORECAST
2016 ECONOMIC AND HOUSING MARKET FORECAST2016 ECONOMIC AND HOUSING MARKET FORECAST
2016 ECONOMIC AND HOUSING MARKET FORECAST
Ronny Budiutama
 
May 2018 - Continued conflicting signs: Toronto real estate market charts
May 2018 - Continued conflicting signs: Toronto real estate market chartsMay 2018 - Continued conflicting signs: Toronto real estate market charts
May 2018 - Continued conflicting signs: Toronto real estate market charts
Scott Ingram, CPA, CA, MBA
 
Greater Boston Association of Realtors January 2017 Monthly Indicators Report
Greater Boston Association of Realtors January 2017 Monthly Indicators ReportGreater Boston Association of Realtors January 2017 Monthly Indicators Report
Greater Boston Association of Realtors January 2017 Monthly Indicators Report
Joe Schutt
 
June 2018 - Don't be deceived
June 2018 - Don't be deceivedJune 2018 - Don't be deceived
June 2018 - Don't be deceived
Scott Ingram, CPA, CA, MBA
 
T Mi Re December09 Us
T Mi Re December09 UsT Mi Re December09 Us
T Mi Re December09 Us
pdrury
 

What's hot (19)

May Market Report
May Market ReportMay Market Report
May Market Report
 
This Month in Real Estate for US Market July 2009
This Month in Real Estate for US Market July 2009This Month in Real Estate for US Market July 2009
This Month in Real Estate for US Market July 2009
 
September 2016 Boston Real Estate Market Trends
September 2016 Boston Real Estate Market TrendsSeptember 2016 Boston Real Estate Market Trends
September 2016 Boston Real Estate Market Trends
 
Annie Williams Real Estate Report - November 2021
Annie Williams Real Estate Report - November 2021Annie Williams Real Estate Report - November 2021
Annie Williams Real Estate Report - November 2021
 
August 2016 Boston Real Estate Market Trends
August 2016 Boston Real Estate Market TrendsAugust 2016 Boston Real Estate Market Trends
August 2016 Boston Real Estate Market Trends
 
March Market Trends Report
March Market Trends ReportMarch Market Trends Report
March Market Trends Report
 
March 2014 Report
March 2014 ReportMarch 2014 Report
March 2014 Report
 
National Residential Real Estate Market - January 2019 update
National Residential Real Estate Market - January 2019 updateNational Residential Real Estate Market - January 2019 update
National Residential Real Estate Market - January 2019 update
 
Oahu real-estate-statistics-monthly-update-june2014
Oahu real-estate-statistics-monthly-update-june2014Oahu real-estate-statistics-monthly-update-june2014
Oahu real-estate-statistics-monthly-update-june2014
 
2014 Market Forecast - California Association of Realtors
2014 Market Forecast - California Association of Realtors2014 Market Forecast - California Association of Realtors
2014 Market Forecast - California Association of Realtors
 
December 2016 Greater Boston Real Estate Market Trends
December 2016 Greater Boston Real Estate Market TrendsDecember 2016 Greater Boston Real Estate Market Trends
December 2016 Greater Boston Real Estate Market Trends
 
GBAR Monthly Housing Market Data November 2016
GBAR Monthly Housing Market Data November 2016GBAR Monthly Housing Market Data November 2016
GBAR Monthly Housing Market Data November 2016
 
Greater Boston Association of Realtors Monthly Housing Data: October 2016
Greater Boston Association of Realtors Monthly Housing Data: October 2016Greater Boston Association of Realtors Monthly Housing Data: October 2016
Greater Boston Association of Realtors Monthly Housing Data: October 2016
 
2016 ECONOMIC AND HOUSING MARKET FORECAST
2016 ECONOMIC AND HOUSING MARKET FORECAST2016 ECONOMIC AND HOUSING MARKET FORECAST
2016 ECONOMIC AND HOUSING MARKET FORECAST
 
May 2018 - Continued conflicting signs: Toronto real estate market charts
May 2018 - Continued conflicting signs: Toronto real estate market chartsMay 2018 - Continued conflicting signs: Toronto real estate market charts
May 2018 - Continued conflicting signs: Toronto real estate market charts
 
Greater Boston Association of Realtors January 2017 Monthly Indicators Report
Greater Boston Association of Realtors January 2017 Monthly Indicators ReportGreater Boston Association of Realtors January 2017 Monthly Indicators Report
Greater Boston Association of Realtors January 2017 Monthly Indicators Report
 
Mw1309
Mw1309Mw1309
Mw1309
 
June 2018 - Don't be deceived
June 2018 - Don't be deceivedJune 2018 - Don't be deceived
June 2018 - Don't be deceived
 
T Mi Re December09 Us
T Mi Re December09 UsT Mi Re December09 Us
T Mi Re December09 Us
 

Viewers also liked

Lect11 Sorting
Lect11 SortingLect11 Sorting
Lect11 Sortingryokollll
 
Chicagoland Quarterly Supply/Demand Report - 7/1/2011
Chicagoland Quarterly Supply/Demand Report - 7/1/2011Chicagoland Quarterly Supply/Demand Report - 7/1/2011
Chicagoland Quarterly Supply/Demand Report - 7/1/2011
chipwags
 
Chicagoland Monthly Maket Pulse -Feb 2010 Detached
Chicagoland Monthly Maket Pulse -Feb 2010 DetachedChicagoland Monthly Maket Pulse -Feb 2010 Detached
Chicagoland Monthly Maket Pulse -Feb 2010 Detached
chipwags
 
H W 2010 07 De
H W 2010 07 DeH W 2010 07 De
H W 2010 07 Dechipwags
 
Reporte Inmobiliario - Datafest2016
Reporte Inmobiliario - Datafest2016Reporte Inmobiliario - Datafest2016
Reporte Inmobiliario - Datafest2016
Reporteinmobiliario
 

Viewers also liked (6)

Lect11 Sorting
Lect11 SortingLect11 Sorting
Lect11 Sorting
 
Chicagoland Quarterly Supply/Demand Report - 7/1/2011
Chicagoland Quarterly Supply/Demand Report - 7/1/2011Chicagoland Quarterly Supply/Demand Report - 7/1/2011
Chicagoland Quarterly Supply/Demand Report - 7/1/2011
 
Chicagoland Monthly Maket Pulse -Feb 2010 Detached
Chicagoland Monthly Maket Pulse -Feb 2010 DetachedChicagoland Monthly Maket Pulse -Feb 2010 Detached
Chicagoland Monthly Maket Pulse -Feb 2010 Detached
 
H W 2010 07 De
H W 2010 07 DeH W 2010 07 De
H W 2010 07 De
 
Reporte Inmobiliario - Datafest2016
Reporte Inmobiliario - Datafest2016Reporte Inmobiliario - Datafest2016
Reporte Inmobiliario - Datafest2016
 
電子書
電子書電子書
電子書
 

Similar to E Newsletter7 2010

Lake Elsinore EDWC Presentation, 9/20/2018
Lake Elsinore EDWC Presentation, 9/20/2018Lake Elsinore EDWC Presentation, 9/20/2018
Lake Elsinore EDWC Presentation, 9/20/2018
Southwest Riverside County Association of Realtors
 
San Francisco Real Estate Housing Market 2016 Summary
San Francisco Real Estate Housing Market 2016 SummarySan Francisco Real Estate Housing Market 2016 Summary
San Francisco Real Estate Housing Market 2016 Summary
Ronny Budiutama
 
San Francisco Real Estate Housing Market 2016 Summary
San Francisco Real Estate Housing Market 2016 SummarySan Francisco Real Estate Housing Market 2016 Summary
San Francisco Real Estate Housing Market 2016 Summary
Ronny Budiutama
 
2017 Housing Market Forecast - Leslie Appleton Young
2017 Housing Market Forecast - Leslie Appleton Young2017 Housing Market Forecast - Leslie Appleton Young
2017 Housing Market Forecast - Leslie Appleton Young
Inman News
 
Annie Williams Real Estate Report Nov-Dec 2015
Annie Williams Real Estate Report Nov-Dec 2015Annie Williams Real Estate Report Nov-Dec 2015
Annie Williams Real Estate Report Nov-Dec 2015
Jon Weaver
 
Annual report on sf county housing market
Annual report on sf county housing marketAnnual report on sf county housing market
Annual report on sf county housing market
Ronny Budiutama
 
September Realtor Report
September Realtor ReportSeptember Realtor Report
Physician Loans USA
Physician Loans USAPhysician Loans USA
Physician Loans USA
ChaDeiparine
 
Annie Williams 2016 Annual Real Estate Report
Annie Williams 2016 Annual Real Estate ReportAnnie Williams 2016 Annual Real Estate Report
Annie Williams 2016 Annual Real Estate Report
Annie Williams
 
Annie Williams Market Report May-June 2016
Annie Williams Market Report May-June 2016Annie Williams Market Report May-June 2016
Annie Williams Market Report May-June 2016
Jon Weaver
 
8
88
Monthly Market Report - April 2018 from Physicians Agent™ Network
Monthly Market Report - April 2018 from Physicians Agent™ NetworkMonthly Market Report - April 2018 from Physicians Agent™ Network
Monthly Market Report - April 2018 from Physicians Agent™ Network
ChaDeiparine
 
Annie Williams Real Estate Report Sept-Oct 2016
Annie Williams Real Estate Report Sept-Oct 2016Annie Williams Real Estate Report Sept-Oct 2016
Annie Williams Real Estate Report Sept-Oct 2016
Annie Williams
 
October 2014 Denver Metro Real Estate Report
October 2014 Denver Metro Real Estate ReportOctober 2014 Denver Metro Real Estate Report
October 2014 Denver Metro Real Estate Report
Jones Team Colorado - Realty Group
 
Monthly Market Report - March 2018 from Physicians Agent™ Network
Monthly Market Report - March 2018 from Physicians Agent™ NetworkMonthly Market Report - March 2018 from Physicians Agent™ Network
Monthly Market Report - March 2018 from Physicians Agent™ Network
ChaDeiparine
 
Annie Williams Real Estate Report - April 2019
Annie Williams Real Estate Report - April 2019Annie Williams Real Estate Report - April 2019
Annie Williams Real Estate Report - April 2019
Jon Weaver
 
Zillow Sued Over Zestimates - June/July Real Estate Report
Zillow Sued Over Zestimates - June/July Real Estate ReportZillow Sued Over Zestimates - June/July Real Estate Report
Zillow Sued Over Zestimates - June/July Real Estate Report
AMSI, San Francisco
 
July 2017 - Are we in a buyer's market?: Toronto real estate market charts
July 2017 - Are we in a buyer's market?: Toronto real estate market chartsJuly 2017 - Are we in a buyer's market?: Toronto real estate market charts
July 2017 - Are we in a buyer's market?: Toronto real estate market charts
Scott Ingram, CPA, CA, MBA
 
Residential Property Indices_Lightstone_Sept 2017
Residential Property Indices_Lightstone_Sept 2017Residential Property Indices_Lightstone_Sept 2017
Residential Property Indices_Lightstone_Sept 2017
Berty Van Staaden
 
May 2014 Realtor Report
May 2014 Realtor ReportMay 2014 Realtor Report

Similar to E Newsletter7 2010 (20)

Lake Elsinore EDWC Presentation, 9/20/2018
Lake Elsinore EDWC Presentation, 9/20/2018Lake Elsinore EDWC Presentation, 9/20/2018
Lake Elsinore EDWC Presentation, 9/20/2018
 
San Francisco Real Estate Housing Market 2016 Summary
San Francisco Real Estate Housing Market 2016 SummarySan Francisco Real Estate Housing Market 2016 Summary
San Francisco Real Estate Housing Market 2016 Summary
 
San Francisco Real Estate Housing Market 2016 Summary
San Francisco Real Estate Housing Market 2016 SummarySan Francisco Real Estate Housing Market 2016 Summary
San Francisco Real Estate Housing Market 2016 Summary
 
2017 Housing Market Forecast - Leslie Appleton Young
2017 Housing Market Forecast - Leslie Appleton Young2017 Housing Market Forecast - Leslie Appleton Young
2017 Housing Market Forecast - Leslie Appleton Young
 
Annie Williams Real Estate Report Nov-Dec 2015
Annie Williams Real Estate Report Nov-Dec 2015Annie Williams Real Estate Report Nov-Dec 2015
Annie Williams Real Estate Report Nov-Dec 2015
 
Annual report on sf county housing market
Annual report on sf county housing marketAnnual report on sf county housing market
Annual report on sf county housing market
 
September Realtor Report
September Realtor ReportSeptember Realtor Report
September Realtor Report
 
Physician Loans USA
Physician Loans USAPhysician Loans USA
Physician Loans USA
 
Annie Williams 2016 Annual Real Estate Report
Annie Williams 2016 Annual Real Estate ReportAnnie Williams 2016 Annual Real Estate Report
Annie Williams 2016 Annual Real Estate Report
 
Annie Williams Market Report May-June 2016
Annie Williams Market Report May-June 2016Annie Williams Market Report May-June 2016
Annie Williams Market Report May-June 2016
 
8
88
8
 
Monthly Market Report - April 2018 from Physicians Agent™ Network
Monthly Market Report - April 2018 from Physicians Agent™ NetworkMonthly Market Report - April 2018 from Physicians Agent™ Network
Monthly Market Report - April 2018 from Physicians Agent™ Network
 
Annie Williams Real Estate Report Sept-Oct 2016
Annie Williams Real Estate Report Sept-Oct 2016Annie Williams Real Estate Report Sept-Oct 2016
Annie Williams Real Estate Report Sept-Oct 2016
 
October 2014 Denver Metro Real Estate Report
October 2014 Denver Metro Real Estate ReportOctober 2014 Denver Metro Real Estate Report
October 2014 Denver Metro Real Estate Report
 
Monthly Market Report - March 2018 from Physicians Agent™ Network
Monthly Market Report - March 2018 from Physicians Agent™ NetworkMonthly Market Report - March 2018 from Physicians Agent™ Network
Monthly Market Report - March 2018 from Physicians Agent™ Network
 
Annie Williams Real Estate Report - April 2019
Annie Williams Real Estate Report - April 2019Annie Williams Real Estate Report - April 2019
Annie Williams Real Estate Report - April 2019
 
Zillow Sued Over Zestimates - June/July Real Estate Report
Zillow Sued Over Zestimates - June/July Real Estate ReportZillow Sued Over Zestimates - June/July Real Estate Report
Zillow Sued Over Zestimates - June/July Real Estate Report
 
July 2017 - Are we in a buyer's market?: Toronto real estate market charts
July 2017 - Are we in a buyer's market?: Toronto real estate market chartsJuly 2017 - Are we in a buyer's market?: Toronto real estate market charts
July 2017 - Are we in a buyer's market?: Toronto real estate market charts
 
Residential Property Indices_Lightstone_Sept 2017
Residential Property Indices_Lightstone_Sept 2017Residential Property Indices_Lightstone_Sept 2017
Residential Property Indices_Lightstone_Sept 2017
 
May 2014 Realtor Report
May 2014 Realtor ReportMay 2014 Realtor Report
May 2014 Realtor Report
 

More from chipwags

H W 2011 10 At
H W 2011 10 AtH W 2011 10 At
H W 2011 10 At
chipwags
 
H W 2011 10 De
H W 2011 10 DeH W 2011 10 De
H W 2011 10 De
chipwags
 
August 2011 Market Pulse - Attached Homes
August 2011 Market Pulse - Attached HomesAugust 2011 Market Pulse - Attached Homes
August 2011 Market Pulse - Attached Homes
chipwags
 
August 2011 Market Pulse - Detached Homes
August 2011 Market Pulse - Detached HomesAugust 2011 Market Pulse - Detached Homes
August 2011 Market Pulse - Detached Homes
chipwags
 
H W 2010 07 At
H W 2010 07 AtH W 2010 07 At
H W 2010 07 Atchipwags
 
H W 2010 Q3 De 12 Mo
H W 2010 Q3 De 12 MoH W 2010 Q3 De 12 Mo
H W 2010 Q3 De 12 Mochipwags
 
Chicagoland Monthly Maket Pulse -Feb 2010 Attached
Chicagoland Monthly Maket Pulse -Feb 2010 AttachedChicagoland Monthly Maket Pulse -Feb 2010 Attached
Chicagoland Monthly Maket Pulse -Feb 2010 Attached
chipwags
 
H W 2010 01 At
H W 2010 01 AtH W 2010 01 At
H W 2010 01 At
chipwags
 
H W 2010 01 De
H W 2010 01 DeH W 2010 01 De
H W 2010 01 De
chipwags
 
H W 2010 Q1 De 12 Mo
H W 2010 Q1 De 12 MoH W 2010 Q1 De 12 Mo
H W 2010 Q1 De 12 Mo
chipwags
 
Wag Report 2009 11 De
Wag Report 2009 11 DeWag Report 2009 11 De
Wag Report 2009 11 De
chipwags
 
Wag Report 2009 Q4 De 12 Mo
Wag Report 2009 Q4 De 12 MoWag Report 2009 Q4 De 12 Mo
Wag Report 2009 Q4 De 12 Mo
chipwags
 
Appraisal Foundation Presentation 2007
Appraisal Foundation Presentation 2007Appraisal Foundation Presentation 2007
Appraisal Foundation Presentation 2007
chipwags
 

More from chipwags (13)

H W 2011 10 At
H W 2011 10 AtH W 2011 10 At
H W 2011 10 At
 
H W 2011 10 De
H W 2011 10 DeH W 2011 10 De
H W 2011 10 De
 
August 2011 Market Pulse - Attached Homes
August 2011 Market Pulse - Attached HomesAugust 2011 Market Pulse - Attached Homes
August 2011 Market Pulse - Attached Homes
 
August 2011 Market Pulse - Detached Homes
August 2011 Market Pulse - Detached HomesAugust 2011 Market Pulse - Detached Homes
August 2011 Market Pulse - Detached Homes
 
H W 2010 07 At
H W 2010 07 AtH W 2010 07 At
H W 2010 07 At
 
H W 2010 Q3 De 12 Mo
H W 2010 Q3 De 12 MoH W 2010 Q3 De 12 Mo
H W 2010 Q3 De 12 Mo
 
Chicagoland Monthly Maket Pulse -Feb 2010 Attached
Chicagoland Monthly Maket Pulse -Feb 2010 AttachedChicagoland Monthly Maket Pulse -Feb 2010 Attached
Chicagoland Monthly Maket Pulse -Feb 2010 Attached
 
H W 2010 01 At
H W 2010 01 AtH W 2010 01 At
H W 2010 01 At
 
H W 2010 01 De
H W 2010 01 DeH W 2010 01 De
H W 2010 01 De
 
H W 2010 Q1 De 12 Mo
H W 2010 Q1 De 12 MoH W 2010 Q1 De 12 Mo
H W 2010 Q1 De 12 Mo
 
Wag Report 2009 11 De
Wag Report 2009 11 DeWag Report 2009 11 De
Wag Report 2009 11 De
 
Wag Report 2009 Q4 De 12 Mo
Wag Report 2009 Q4 De 12 MoWag Report 2009 Q4 De 12 Mo
Wag Report 2009 Q4 De 12 Mo
 
Appraisal Foundation Presentation 2007
Appraisal Foundation Presentation 2007Appraisal Foundation Presentation 2007
Appraisal Foundation Presentation 2007
 

E Newsletter7 2010

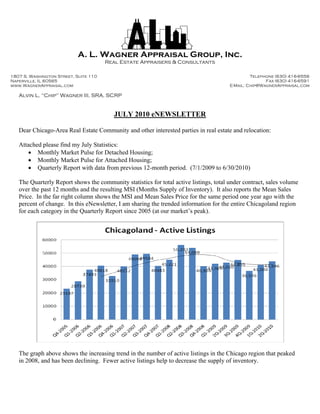
  • 1. A. L. Wagner Appraisal Group, Inc. Real Estate Appraisers & Consultants 1807 S. Washington Street, Suite 110 Telephone (630) 416-6556 Naperville, IL 60565 Fax (630) 416-6591 www.WagnerAppraisal.com E-Mail: Chip@WagnerAppraisal.com Alvin L. “Chip” Wagner III, SRA, SCRP JULY 2010 eNEWSLETTER Dear Chicago-Area Real Estate Community and other interested parties in real estate and relocation: Attached please find my July Statistics:  Monthly Market Pulse for Detached Housing;  Monthly Market Pulse for Attached Housing;  Quarterly Report with data from previous 12-month period. (7/1/2009 to 6/30/2010) The Quarterly Report shows the community statistics for total active listings, total under contract, sales volume over the past 12 months and the resulting MSI (Months Supply of Inventory). It also reports the Mean Sales Price. In the far right column shows the MSI and Mean Sales Price for the same period one year ago with the percent of change. In this eNewsletter, I am sharing the trended information for the entire Chicagoland region for each category in the Quarterly Report since 2005 (at our market’s peak). The graph above shows the increasing trend in the number of active listings in the Chicago region that peaked in 2008, and has been declining. Fewer active listings help to decrease the supply of inventory.
  • 2. The graph above shows the increasing trend in the number of contract pendings in the Chicago region that peaked at a low in the first quarter of 2009, and has steadily increased since then. The 2010 totals are the highest they have been since 2006, and the continued increase in contract pendings is a good sign of continued sales activity. This has been in part the market’s reaction to the $6,500 and $8,000 tax incentives that expired on April 30th. This tax credit was to help spur activity, and it succeeded. The graph above shows the increasing trend in the number of sales to take place in the Chicago region. This annualized stat shows the market bottomed in early 2009, and has been increasing ever since. From the end of 2005 to the beginning of 2009, the drop in sales volume was approximately 50%. Since fewer homes were selling, the inventory increased. The basic laws of Supply and Demand lead to the declining values our market has faced.
  • 3. The graph above shows the first three quarters of each year, the MSI increased, and the fourth quarter it decreased and then returned to the same trend the following year. In 2009, the MSI actually began decreasing between the 2nd quarter and 3rd quarter. It has remained somewhat stable over the past 3 quarters. The Months Supply of Inventory (MSI) is a calculation that measures the relationship between the number of active listings on the market as compared to the rate at which they are selling.  Less than 3 months of supply will place strong pressure on prices upward, which could result in as high as double digit appreciation.  3 to 4 Months of supply will place pressure on prices upward, resulting in appreciating values.  5 to 6 Months of supply is generally considered a balanced market with little to no fluctuation in value.  7 to 8 Months supply is going to result in downward pressure on prices, usually leading to declining values.  Over a 9 Month supply is an extreme oversupply, placing strong downward pressure on prices, potentially at a double digit annual rate. The good news is the continued downward trend in the Inventory Levels.
  • 4. At the end of the first quarter, in my April eNewsletter, I reported that there was “Finally Something Positive to Say.” I discussed the statistics in the quarterly report had shown 41% of the communities analyzed in the report showed either increasing, or stable mean sales prices from the previous quarter. This was important because it is the first period since 2007 that shows areas with increasing prices from the previous quarter. But the overall Chicagoland average was still in decline. At the end of the 2nd quarter of 2010, we see the first increase in Mean Sales Price since the middle of 2007. The graph above shows the Mean Sales Price as of the end of the 1st quarter to the end of the 2nd quarter increased 2.74%. This is after a 34% decrease over the previous 10 quarters. And of the 186 suburban communities profiled in the Quarterly Report, 96 communities (48.9%) showed a positive increase or barely negligible change of less than ½ % downward. There are continued concerns of the shadow inventory and the homes in pre-foreclosure and foreclosure that have not hit the market yet. It is difficult to measure the impact of this. The real concern is the economy and Unemployment. Once people have jobs, they can pay their mortgage. When they pay their mortgage, foreclosures go down. The following table shows local unemployment levels going back 10 years. Cook and DuPage Counties are seeing increasing levels, but the State and National averages are seeing a decline. Unemployment by County-Chicago Metro Area (Source: IDES) Cook DuPage Kane Lake McHenry Will State of IL National Jun-10 10.9% 9.0% 10.8% 10.3% 9.9% 11.0% 10.4% 9.5% Dec-09 10.8% 8.6% 11.2% 11.6% 10.4% 11.0% 11.0% 10.0% Dec-08 7.1% 5.4% 7.5% 8.3% 6.9% 7.2% 7.9% 7.6% Dec-07 5.1% 3.8% 4.8% 5.0% 4.3% 4.7% 5.0% 4.6% Dec-06 4.7% 3.4% 4.3% 4.2% 3.7% 4.3% 4.6% 4.6% Dec-05 6.5% 4.7% 5.7% 4.5% 5.1% 5.5% 5.7% 5.1% Dec-04 6.6% 5.0% 6.0% 5.3% 5.2% 5.9% 5.8% 5.7% Nov-03 7.3% 5.2% 7. 0% 6.2% 6.3% 6.9% 6.7% 6.0% Nov-02 7.4% 5.2% 6.6% 5.6% 5.7% 6.3% 6.5% 5.8% Nov-01 6.1% 3.9% 5.3% 4.5% 4.5% 5.1% 5.4% 4.7% Nov-00 4.9% 2.9% 4.3% 3.5% 3.4% 4.2% 4.4% 4.0% Thanks for your continued interest. I frequently post real estate and appraisal-related information on my Facebook page and blog at: http://chipwags.blogspot.com/. Follow my company Facebook page at: http://www.facebook.com/pages/Naperville-IL/AL-Wagner-Apprasial-Group/368919896256?v=wall Regards, Chip Alvin “Chip” Wagner III, SRA, SCRP (RAC Member) A. L. Wagner Appraisal Group, Inc. is proud to have been serving the Chicago metropolitan area since 1970 by its founder Alvin Wagner Jr. Currently lead by his son Alvin III, known as “Chip,” we specialize in corporate relocation appraisals and complete residential appraisals for all purposes including lending, REO/Foreclosure, Legal (divorce, estates, trusts, litigation support), market value appraisals for Realtors and individuals for both listing and selling purposes. Visit www.WagnerAppraisal.com for more information on our qualifications and services. Thank you for your referrals! If you know of someone who would benefit by this newsletter or our market studies, please feel free to pass them along. If you would like to be removed from my distribution list, please send an e-mail to: Chip@WagnerAppraisal.com. All information contained in this eNewsletter was created by Alvin L. “Chip” Wagner III, SRA, SCRP and is the opinion of the author. Market statistics were derived from the MRED, LLC and the former Multiple Listing Service of Northern Illinois.