Downloaded 123 times


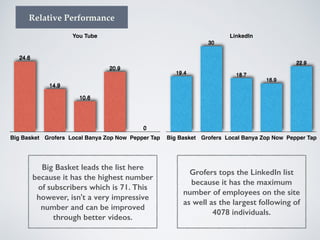
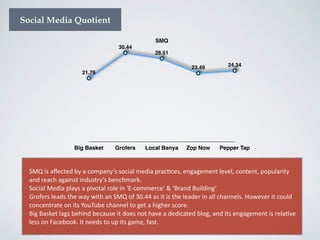


Grofers leads the online grocery industry in India in terms of social media presence and engagement. It has the highest scores on Twitter, Facebook, and LinkedIn compared to competitors like Big Basket and Local Banya. However, Grofers can improve its YouTube channel presence. Overall, Grofers has the highest Social Media Quotient of 30.44. For companies to succeed, they need to follow a crawl-walk-run approach to social media, starting with content creation and community building before moving to more advanced strategies.


