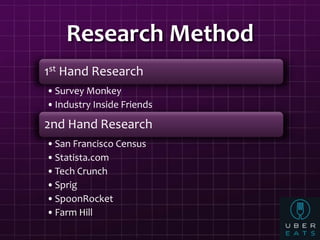
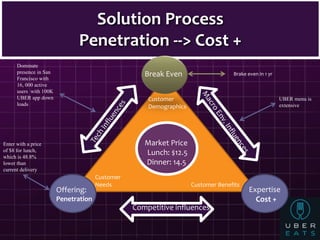
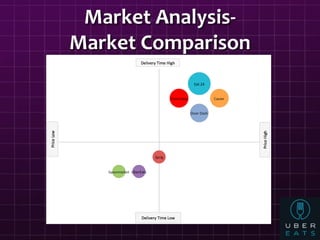
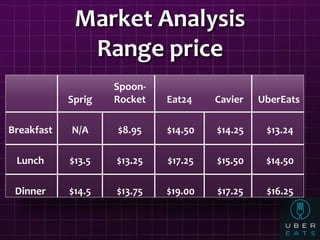
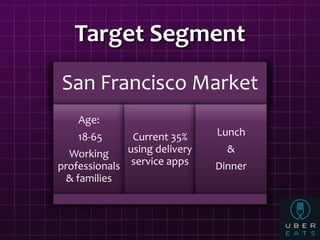
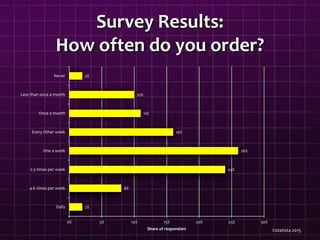
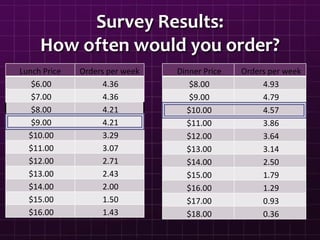
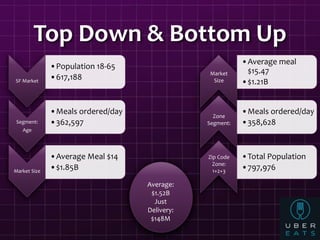
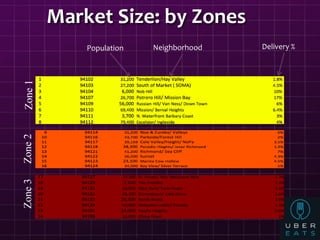
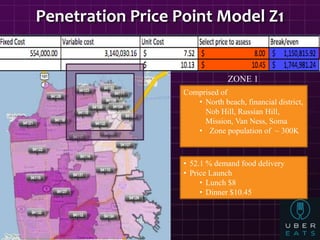
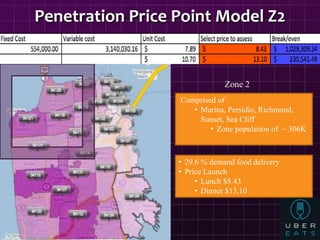
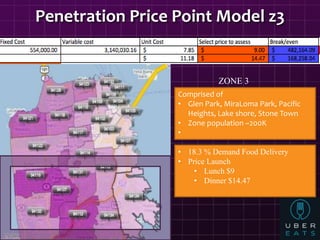
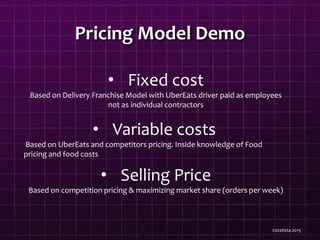
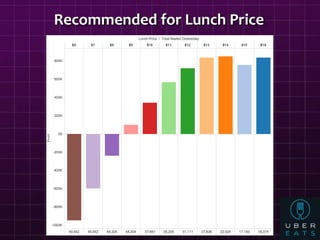
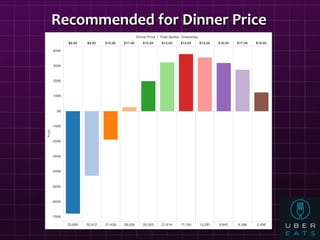
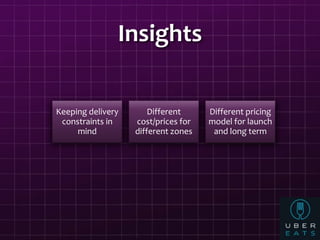
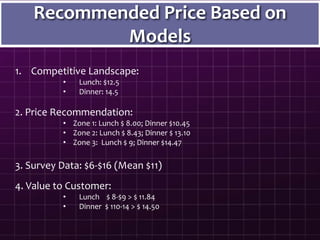
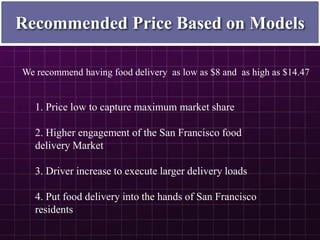
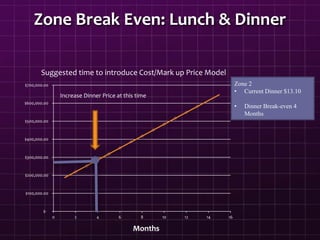
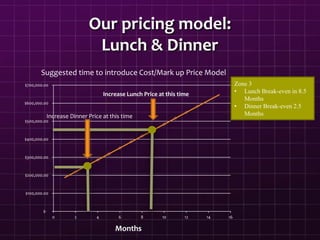
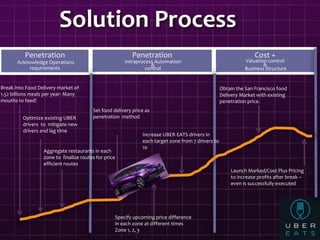
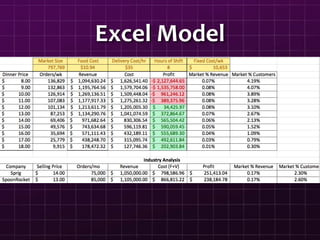
UberEats Pricing Strategy
in San Francisco
Jose E. Rodriguez
UberEats delivers the best of your city right when you want it. Our
curated menus feature dishes from the local spots you love. And the
ones you’ve always wanted to try. It’s same cashless payment as an
Uber ride. So just tap the app, meet your driver outside, and enjoy
What is the goal?
Goal
Access competitors pricing model & determine
selling price to maximize market share
Start with Penetration Model
Tasks
Research target market’s frequency and
wiliness to order delivery at different prices &
determine break even points.
Tools Internet Research, Excel, Tableau
Research Method
1st Hand Research
•Survey Monkey
•Industry Inside Friends
2nd Hand Research
•San Francisco Census
•Statista.com
•Tech Crunch
•Sprig
•SpoonRocket
•Farm Hill
Solution Process
Penetration --> Cost +
Customer
Needs
Customer
Demographics
Break Even
Customer Benefits
Offering:
Penetration
Expertise
Cost +
Market Price
Lunch: $12.5
Dinner: 14.5
Competitive influences
Enter with a price
of $8 for lunch,
which is 48.8%
lower than
current delivery
Brake even in 1 yr
Dominate
presence in San
Francisco with
16, 000 active
users with 100K
UBER app down
loads
UBER menu is
extensive
CanUber Eats enter the Food
Delivery Market at a delivery price
comparable to its competitors to
obtain favorable market share in
order to later introduce a slight
higher price to gain more profit
Market
Share
• 5% Of Market
Share
Price Point
Average –
• $ 20% under
competition
Break Even
• Break even in
year one
Problem Statement
Criteria of success?
Industry growth: .35%/month
Market Analysis
Growth
Direct
Competitor
Growth:
30%/mo
Market Analysis-
Market Comparison
Market Analysis
Range price
Sprig
Spoon-
Rocket Eat24 Cavier UberEats
Breakfast N/A $8.95 $14.50 $14.25 $13.24
Lunch $13.5 $13.25 $17.25 $15.50 $14.50
Dinner $14.5 $13.75 $19.00 $17.25 $16.25
Target Segment
San Francisco Market
Age:
18-65
Working
professionals
& families
Current 35%
using delivery
service apps
Lunch
&
Dinner
Survey Results:
How often do you order?
2%
8%
24%
26%
16%
11%
10%
2%
0% 5% 10% 15% 20% 25% 30%
Daily
4-6 times per week
2-3 times per week
One a week
Every Other week
Once a month
Less than once a month
Never
Share of respondant ©statista 2015
Survey Results:
How often would you order?
Lunch Price Orders per week
$6.00 4.36
$7.00 4.36
$8.00 4.21
$9.00 4.21
$10.00 3.29
$11.00 3.07
$12.00 2.71
$13.00 2.43
$14.00 2.00
$15.00 1.50
$16.00 1.43
Dinner Price Orders per week
$8.00 4.93
$9.00 4.79
$10.00 4.57
$11.00 3.86
$12.00 3.64
$13.00 3.14
$14.00 2.50
$15.00 1.79
$16.00 1.29
$17.00 0.93
$18.00 0.36
Top Down & Bottom Up
SF Market
•Population 18-65
•617,188
Segment:
Age
•Meals ordered/day
•362,597
Market Size
•Average Meal $14
•$1.85B
•Average meal
$15.47
•$1.21B
•Meals ordered/day
•358,628
•Total Population
•797,976
Zip Code
Zone:
1+2+3
Zone
Segment:
Market
Size
Average:
$1.52B
Just
Delivery:
$148M
Market Size: by ZonesZone1Zone2Zone3
Delivery %NeighborhoodPopulation
Penetration Price Point Model Z1
• 52.1 % demand food delivery
• Price Launch
• Lunch $8
• Dinner $10.45
Comprised of
• North beach, financial district,
Nob Hill, Russian Hill,
Mission, Van Ness, Soma
• Zone population of ~ 300K
ZONE 1
Penetration Price Point Model Z2
• 29.6 % demand food delivery
• Price Launch
• Lunch $8.43
• Dinner $13.10
Comprised of
• Marina, Persidio, Richmond,
Sunset, Sea Cliff
• Zone population of ~ 306K
Zone 2
Penetration Price Point Model z3
ZONE 3
Comprised of
• Glen Park, MiraLoma Park, Pacific
Heights, Lake shore, Stone Town
• Zone population ~200K
•
• 18.3 % Demand Food Delivery
• Price Launch
• Lunch $9
• Dinner $14.47
Pricing Model Demo
©statista 2015
• Fixed cost
Based on Delivery Franchise Model with UberEats driver paid as employees
not as individual contractors
• Variable costs
Based on UberEats and competitors pricing. Inside knowledge of Food
pricing and food costs
• Selling Price
Based on competition pricing & maximizing market share (orders per week)
Recommended for Lunch Price
Recommended for Dinner Price
Insights
Keeping delivery
constraints in
mind
Different
cost/prices for
different zones
Different pricing
model for launch
and long term
Recommended Price Based on
Models
2. Price Recommendation:
• Zone 1: Lunch $ 8.00; Dinner $10.45
• Zone 2: Lunch $ 8.43; Dinner $ 13.10
• Zone 3: Lunch $ 9; Dinner $14.47
4. Value to Customer:
• Lunch $ 8-$9 > $ 11.84
• Dinner $ 110-14 > $ 14.50
1. Competitive Landscape:
• Lunch: $12.5
• Dinner: 14.5
3. Survey Data: $6-$16 (Mean $11)
Recommended Price Based on Models
We recommend having food delivery as low as $8 and as high as $14.47
1. Price low to capture maximum market share
2. Higher engagement of the San Francisco food
delivery Market
3. Driver increase to execute larger delivery loads
4. Put food delivery into the hands of San Francisco
residents
Who wants to order UberEats?
©statista 2015
Appendix
Zone Break Even: Lunch & Dinner
$-
$100,000.00
$200,000.00
$300,000.00
$400,000.00
$500,000.00
$600,000.00
$700,000.00
0 2 4 6 8 10 12 14 16
Increase Dinner Price at this time
Months
Zone 2
• Current Dinner $13.10
• Dinner Break-even 4
Months
Suggested time to introduce Cost/Mark up Price Model
Our pricing model:
Lunch & Dinner
$-
$100,000.00
$200,000.00
$300,000.00
$400,000.00
$500,000.00
$600,000.00
$700,000.00
0 2 4 6 8 10 12 14 16
Increase Lunch Price at this time
Increase Dinner Price at this time
Zone 3
• Lunch Break-even in 8.5
Months
• Dinner Break-even 2.5
Months
Suggested time to introduce Cost/Mark up Price Model
Months
Solution Process
Penetration
Acknowledge Operations
requirements
Penetration
Intraprocess Automation
&
control
Cost +
Valuation control
&
Business Structure
Break into Food Delivery market of
1.52 billions meals per year- Many
mouths to feed!
Optimize existing UBER
drivers to mitigate new
drivers and lag time
Aggregate restaurants in each
zone to finalize routes for price
efficient routes
Set food delivery price as
penetration method
Specify upcoming price difference
in each zone at different times
Zone 1, 2, 3
Increase UBER EATS drivers in
each target zone from 7 drivers to
10
Obtain the San Francisco food
Delivery Market with existing
penetration price.
Launch Marked/Cost Plus Pricing
to increase profits after break –
even is successfully executed
Excel Model

Uber Eats Launch & Pricing Strategy

  • 1.
    UberEats Pricing Strategy inSan Francisco Jose E. Rodriguez
  • 2.
    UberEats delivers thebest of your city right when you want it. Our curated menus feature dishes from the local spots you love. And the ones you’ve always wanted to try. It’s same cashless payment as an Uber ride. So just tap the app, meet your driver outside, and enjoy
  • 3.
    What is thegoal? Goal Access competitors pricing model & determine selling price to maximize market share Start with Penetration Model Tasks Research target market’s frequency and wiliness to order delivery at different prices & determine break even points. Tools Internet Research, Excel, Tableau
  • 4.
    Research Method 1st HandResearch •Survey Monkey •Industry Inside Friends 2nd Hand Research •San Francisco Census •Statista.com •Tech Crunch •Sprig •SpoonRocket •Farm Hill
  • 5.
    Solution Process Penetration -->Cost + Customer Needs Customer Demographics Break Even Customer Benefits Offering: Penetration Expertise Cost + Market Price Lunch: $12.5 Dinner: 14.5 Competitive influences Enter with a price of $8 for lunch, which is 48.8% lower than current delivery Brake even in 1 yr Dominate presence in San Francisco with 16, 000 active users with 100K UBER app down loads UBER menu is extensive
  • 6.
    CanUber Eats enterthe Food Delivery Market at a delivery price comparable to its competitors to obtain favorable market share in order to later introduce a slight higher price to gain more profit Market Share • 5% Of Market Share Price Point Average – • $ 20% under competition Break Even • Break even in year one Problem Statement Criteria of success?
  • 7.
    Industry growth: .35%/month MarketAnalysis Growth Direct Competitor Growth: 30%/mo
  • 8.
  • 9.
    Market Analysis Range price Sprig Spoon- RocketEat24 Cavier UberEats Breakfast N/A $8.95 $14.50 $14.25 $13.24 Lunch $13.5 $13.25 $17.25 $15.50 $14.50 Dinner $14.5 $13.75 $19.00 $17.25 $16.25
  • 10.
    Target Segment San FranciscoMarket Age: 18-65 Working professionals & families Current 35% using delivery service apps Lunch & Dinner
  • 11.
    Survey Results: How oftendo you order? 2% 8% 24% 26% 16% 11% 10% 2% 0% 5% 10% 15% 20% 25% 30% Daily 4-6 times per week 2-3 times per week One a week Every Other week Once a month Less than once a month Never Share of respondant ©statista 2015
  • 12.
    Survey Results: How oftenwould you order? Lunch Price Orders per week $6.00 4.36 $7.00 4.36 $8.00 4.21 $9.00 4.21 $10.00 3.29 $11.00 3.07 $12.00 2.71 $13.00 2.43 $14.00 2.00 $15.00 1.50 $16.00 1.43 Dinner Price Orders per week $8.00 4.93 $9.00 4.79 $10.00 4.57 $11.00 3.86 $12.00 3.64 $13.00 3.14 $14.00 2.50 $15.00 1.79 $16.00 1.29 $17.00 0.93 $18.00 0.36
  • 13.
    Top Down &Bottom Up SF Market •Population 18-65 •617,188 Segment: Age •Meals ordered/day •362,597 Market Size •Average Meal $14 •$1.85B •Average meal $15.47 •$1.21B •Meals ordered/day •358,628 •Total Population •797,976 Zip Code Zone: 1+2+3 Zone Segment: Market Size Average: $1.52B Just Delivery: $148M
  • 14.
    Market Size: byZonesZone1Zone2Zone3 Delivery %NeighborhoodPopulation
  • 15.
    Penetration Price PointModel Z1 • 52.1 % demand food delivery • Price Launch • Lunch $8 • Dinner $10.45 Comprised of • North beach, financial district, Nob Hill, Russian Hill, Mission, Van Ness, Soma • Zone population of ~ 300K ZONE 1
  • 16.
    Penetration Price PointModel Z2 • 29.6 % demand food delivery • Price Launch • Lunch $8.43 • Dinner $13.10 Comprised of • Marina, Persidio, Richmond, Sunset, Sea Cliff • Zone population of ~ 306K Zone 2
  • 17.
    Penetration Price PointModel z3 ZONE 3 Comprised of • Glen Park, MiraLoma Park, Pacific Heights, Lake shore, Stone Town • Zone population ~200K • • 18.3 % Demand Food Delivery • Price Launch • Lunch $9 • Dinner $14.47
  • 18.
    Pricing Model Demo ©statista2015 • Fixed cost Based on Delivery Franchise Model with UberEats driver paid as employees not as individual contractors • Variable costs Based on UberEats and competitors pricing. Inside knowledge of Food pricing and food costs • Selling Price Based on competition pricing & maximizing market share (orders per week)
  • 19.
  • 20.
  • 21.
    Insights Keeping delivery constraints in mind Different cost/pricesfor different zones Different pricing model for launch and long term
  • 22.
    Recommended Price Basedon Models 2. Price Recommendation: • Zone 1: Lunch $ 8.00; Dinner $10.45 • Zone 2: Lunch $ 8.43; Dinner $ 13.10 • Zone 3: Lunch $ 9; Dinner $14.47 4. Value to Customer: • Lunch $ 8-$9 > $ 11.84 • Dinner $ 110-14 > $ 14.50 1. Competitive Landscape: • Lunch: $12.5 • Dinner: 14.5 3. Survey Data: $6-$16 (Mean $11)
  • 23.
    Recommended Price Basedon Models We recommend having food delivery as low as $8 and as high as $14.47 1. Price low to capture maximum market share 2. Higher engagement of the San Francisco food delivery Market 3. Driver increase to execute larger delivery loads 4. Put food delivery into the hands of San Francisco residents
  • 24.
    Who wants toorder UberEats?
  • 25.
  • 26.
    Zone Break Even:Lunch & Dinner $- $100,000.00 $200,000.00 $300,000.00 $400,000.00 $500,000.00 $600,000.00 $700,000.00 0 2 4 6 8 10 12 14 16 Increase Dinner Price at this time Months Zone 2 • Current Dinner $13.10 • Dinner Break-even 4 Months Suggested time to introduce Cost/Mark up Price Model
  • 27.
    Our pricing model: Lunch& Dinner $- $100,000.00 $200,000.00 $300,000.00 $400,000.00 $500,000.00 $600,000.00 $700,000.00 0 2 4 6 8 10 12 14 16 Increase Lunch Price at this time Increase Dinner Price at this time Zone 3 • Lunch Break-even in 8.5 Months • Dinner Break-even 2.5 Months Suggested time to introduce Cost/Mark up Price Model Months
  • 28.
    Solution Process Penetration Acknowledge Operations requirements Penetration IntraprocessAutomation & control Cost + Valuation control & Business Structure Break into Food Delivery market of 1.52 billions meals per year- Many mouths to feed! Optimize existing UBER drivers to mitigate new drivers and lag time Aggregate restaurants in each zone to finalize routes for price efficient routes Set food delivery price as penetration method Specify upcoming price difference in each zone at different times Zone 1, 2, 3 Increase UBER EATS drivers in each target zone from 7 drivers to 10 Obtain the San Francisco food Delivery Market with existing penetration price. Launch Marked/Cost Plus Pricing to increase profits after break – even is successfully executed
  • 29.

Editor's Notes

  • #6 Active users of UBER: http://www.washingtonpost.com/news/wonkblog/wp/2015/01/22/now-we-know-many-drivers-uber-has-and-how-much-money-theyre-making%E2%80%8B/
  • #7 Market Share Price Point Average $12 Value or Profits
  • #12 If I have time I will do the graph
  • #19 If I have time I will do the graph
  • #26 If I have time I will do the graph
  • #29 5. Demo: Demonstration of model in class goes smoothly, no problems 1 2 3 4 5 ____ Comments: ______________________________________________ 16. Procedure: Spreadsheet describes how to use model 1 2 3 4 5 ____ Comments: ______________________________________________ 17. Inputs: Spreadsheet indicates user input area(s) 1 2 3 4 5 ____ Comments: ______________________________________________ 18. Outputs: Spreadsheet indicates model output area(s) 1 2 3 4 5 ____ Comments: ______________________________________________ 19. Calibration: Spreadsheet indicates calibration procedure, if any 1 2 3 4 5 ____ Comments: ______________________________________________ 20. Structure: Spreadsheet is logically laid out for ease of use 1 2 3 4 5 ____ Comments: ______________________________________________