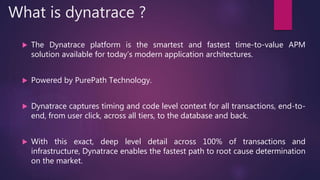
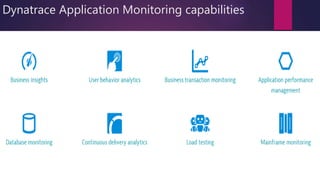
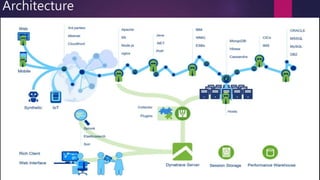
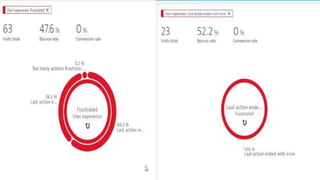
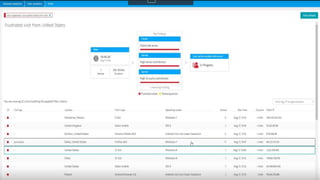
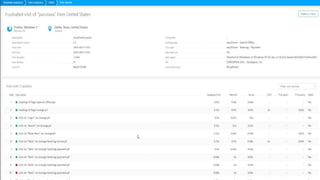
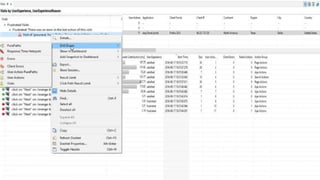
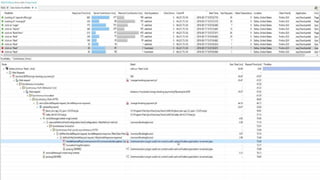
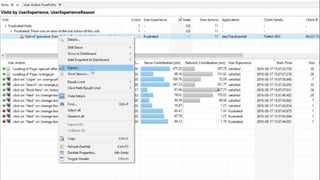
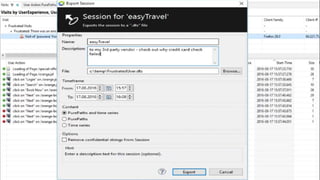
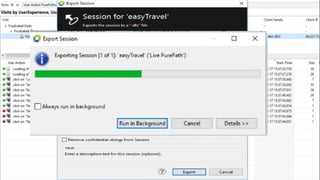
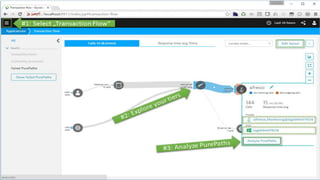
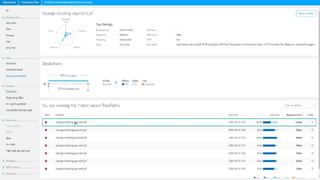
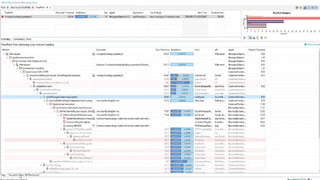
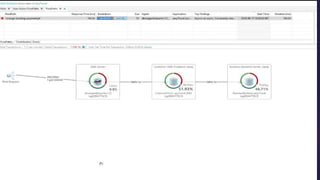
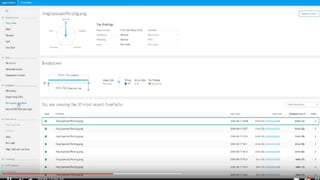
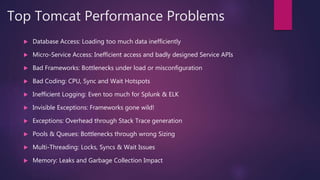
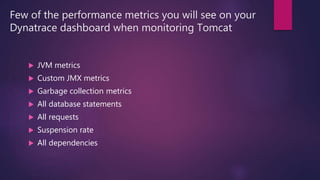
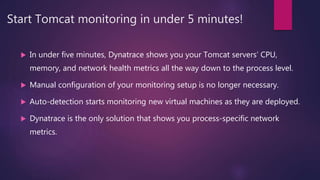
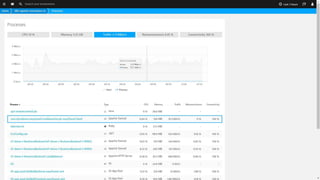
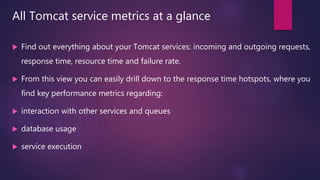
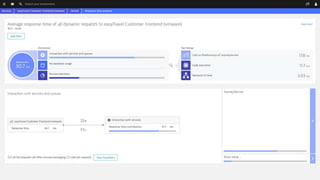
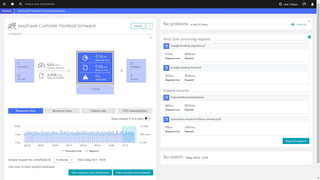
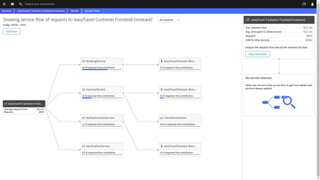
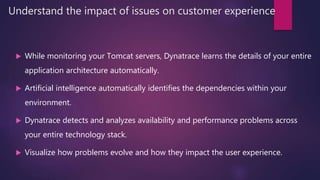
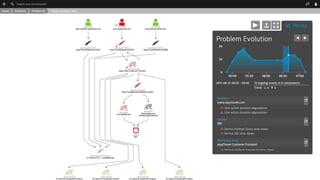
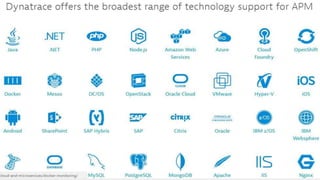
DYNATRACE
By
Purnima Kurella
Agenda
 What is APM, Dynatrace and its capabilities ?
 Architecture
 Pure path technology
 Unique keywords
 Few Dashboards and its monitoring
 Tomcat monitoring
 Technologies and Customers Dyantrace support for
APM
 Applications today are more complex and distributed than ever and user
expectations have been higher.
 Performance monitoring tools can help organizations meet the expectations
by continually identifying issues and prioritizing fixes in order to minimize the
impact on users.
 By proactively looking for potential problems and resolving them before they
have a chance to affect the user experience.
 Everyone who uses an application expects that it will work flawlessly and
respond quickly to every click.
What is dynatrace ?
 The Dynatrace platform is the smartest and fastest time-to-value APM
solution available for today’s modern application architectures.
 Powered by PurePath Technology.
 Dynatrace captures timing and code level context for all transactions, end-to-
end, from user click, across all tiers, to the database and back.
 With this exact, deep level detail across 100% of transactions and
infrastructure, Dynatrace enables the fastest path to root cause determination
on the market.
Dynatrace Application Monitoring capabilities
Architecture
The Magic of PurePath Technology
 No more guessing, no more finger-pointing – the facts are at your fingertips all the time
 Become proactive with production proven, always-on transaction detail
 Get the deepest, most accurate, granular visibility of applications from a single pane of glass
 Get to root-cause fast, no matter how complex your application or distributed your
environment
 No more cobbling together different tools and timings that are prone to error and resort to
guessing
 For the fastest time-to-value and lowest cost to own
 Collaborate across the lifecycle and see productivity improve dramatically
Unique dynaTrace keywords
 Pure Path
 DynaTrace byte code instrumentation
 Sensors
 Discovery Run
 System Profile
 Dashboard and Dashlets
 Sessions
Tomcat monitoring and performance
management
 Apache Tomcat is an open-source web server developed by the Apache
Software Foundation (ASF) and one of the most popular servlet containers
available today. It’s an incredibly lightweight, flexible and extremely stable
platform to build on.
 Dynatrace monitors and analyzes the activity of your Tomcat servers,
providing visibility down to individual database statements.
Top Tomcat Performance Problems
 Database Access: Loading too much data inefficiently
 Micro-Service Access: Inefficient access and badly designed Service APIs
 Bad Frameworks: Bottlenecks under load or misconfiguration
 Bad Coding: CPU, Sync and Wait Hotspots
 Inefficient Logging: Even too much for Splunk & ELK
 Invisible Exceptions: Frameworks gone wild!
 Exceptions: Overhead through Stack Trace generation
 Pools & Queues: Bottlenecks through wrong Sizing
 Multi-Threading: Locks, Syncs & Wait Issues
 Memory: Leaks and Garbage Collection Impact
Few of the performance metrics you will see on your
Dynatrace dashboard when monitoring Tomcat
 JVM metrics
 Custom JMX metrics
 Garbage collection metrics
 All database statements
 All requests
 Suspension rate
 All dependencies
Start Tomcat monitoring in under 5 minutes!
 In under five minutes, Dynatrace shows you your Tomcat servers’ CPU,
memory, and network health metrics all the way down to the process level.
 Manual configuration of your monitoring setup is no longer necessary.
 Auto-detection starts monitoring new virtual machines as they are deployed.
 Dynatrace is the only solution that shows you process-specific network
metrics.
All Tomcat service metrics at a glance
 Find out everything about your Tomcat services: incoming and outgoing requests,
response time, resource time and failure rate.
 From this view you can easily drill down to the response time hotspots, where you
find key performance metrics regarding:
 interaction with other services and queues
 database usage
 service execution
All Tomcat service metrics at a glance
 Find out everything about your Tomcat services: incoming and outgoing requests,
response time, resource time and failure rate.
 From this view you can easily drill down to the response time hotspots, where you
find key performance metrics.
 Interaction with other services and queues.
 Database usage
 Service execution
Visualize Tomcat service requests end-to-end
 Dynatrace understands your applications’ transactions from end-to-end.
 Service flow shows the actual execution of each individual service and service-
request type.
 While Smartscape shows you your overall environment topology, Service flow
provides you with the view point of a single service or service-request type.
 From this view you can easily drill down to the PurePaths and analyze the requests
that execute the selected call chain.
Understand the impact of issues on customer experience
 While monitoring your Tomcat servers, Dynatrace learns the details of your entire
application architecture automatically.
 Artificial intelligence automatically identifies the dependencies within your
environment.
 Dynatrace detects and analyzes availability and performance problems across
your entire technology stack.
 Visualize how problems evolve and how they impact the user experience.
Thank you
References :
https://community.dynatrace.com/community/display/DOCDT65/AppMon+6.5+Documentation
https://www.youtube.com/watch?v=wExU-AQ0ydk

Dynatrace

  • 1.
  • 2.
    Agenda  What isAPM, Dynatrace and its capabilities ?  Architecture  Pure path technology  Unique keywords  Few Dashboards and its monitoring  Tomcat monitoring  Technologies and Customers Dyantrace support for
  • 3.
    APM  Applications todayare more complex and distributed than ever and user expectations have been higher.  Performance monitoring tools can help organizations meet the expectations by continually identifying issues and prioritizing fixes in order to minimize the impact on users.  By proactively looking for potential problems and resolving them before they have a chance to affect the user experience.  Everyone who uses an application expects that it will work flawlessly and respond quickly to every click.
  • 4.
    What is dynatrace?  The Dynatrace platform is the smartest and fastest time-to-value APM solution available for today’s modern application architectures.  Powered by PurePath Technology.  Dynatrace captures timing and code level context for all transactions, end-to- end, from user click, across all tiers, to the database and back.  With this exact, deep level detail across 100% of transactions and infrastructure, Dynatrace enables the fastest path to root cause determination on the market.
  • 6.
  • 7.
  • 9.
    The Magic ofPurePath Technology  No more guessing, no more finger-pointing – the facts are at your fingertips all the time  Become proactive with production proven, always-on transaction detail  Get the deepest, most accurate, granular visibility of applications from a single pane of glass  Get to root-cause fast, no matter how complex your application or distributed your environment  No more cobbling together different tools and timings that are prone to error and resort to guessing  For the fastest time-to-value and lowest cost to own  Collaborate across the lifecycle and see productivity improve dramatically
  • 10.
    Unique dynaTrace keywords Pure Path  DynaTrace byte code instrumentation  Sensors  Discovery Run  System Profile  Dashboard and Dashlets  Sessions
  • 36.
    Tomcat monitoring andperformance management  Apache Tomcat is an open-source web server developed by the Apache Software Foundation (ASF) and one of the most popular servlet containers available today. It’s an incredibly lightweight, flexible and extremely stable platform to build on.  Dynatrace monitors and analyzes the activity of your Tomcat servers, providing visibility down to individual database statements.
  • 37.
    Top Tomcat PerformanceProblems  Database Access: Loading too much data inefficiently  Micro-Service Access: Inefficient access and badly designed Service APIs  Bad Frameworks: Bottlenecks under load or misconfiguration  Bad Coding: CPU, Sync and Wait Hotspots  Inefficient Logging: Even too much for Splunk & ELK  Invisible Exceptions: Frameworks gone wild!  Exceptions: Overhead through Stack Trace generation  Pools & Queues: Bottlenecks through wrong Sizing  Multi-Threading: Locks, Syncs & Wait Issues  Memory: Leaks and Garbage Collection Impact
  • 38.
    Few of theperformance metrics you will see on your Dynatrace dashboard when monitoring Tomcat  JVM metrics  Custom JMX metrics  Garbage collection metrics  All database statements  All requests  Suspension rate  All dependencies
  • 39.
    Start Tomcat monitoringin under 5 minutes!  In under five minutes, Dynatrace shows you your Tomcat servers’ CPU, memory, and network health metrics all the way down to the process level.  Manual configuration of your monitoring setup is no longer necessary.  Auto-detection starts monitoring new virtual machines as they are deployed.  Dynatrace is the only solution that shows you process-specific network metrics.
  • 41.
    All Tomcat servicemetrics at a glance  Find out everything about your Tomcat services: incoming and outgoing requests, response time, resource time and failure rate.  From this view you can easily drill down to the response time hotspots, where you find key performance metrics regarding:  interaction with other services and queues  database usage  service execution
  • 43.
    All Tomcat servicemetrics at a glance  Find out everything about your Tomcat services: incoming and outgoing requests, response time, resource time and failure rate.  From this view you can easily drill down to the response time hotspots, where you find key performance metrics.  Interaction with other services and queues.  Database usage  Service execution
  • 44.
    Visualize Tomcat servicerequests end-to-end  Dynatrace understands your applications’ transactions from end-to-end.  Service flow shows the actual execution of each individual service and service- request type.  While Smartscape shows you your overall environment topology, Service flow provides you with the view point of a single service or service-request type.  From this view you can easily drill down to the PurePaths and analyze the requests that execute the selected call chain.
  • 46.
    Understand the impactof issues on customer experience  While monitoring your Tomcat servers, Dynatrace learns the details of your entire application architecture automatically.  Artificial intelligence automatically identifies the dependencies within your environment.  Dynatrace detects and analyzes availability and performance problems across your entire technology stack.  Visualize how problems evolve and how they impact the user experience.
  • 50.