Download to read offline

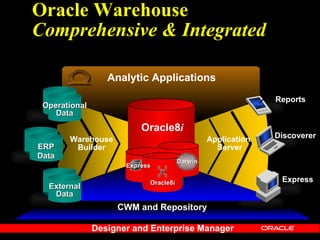
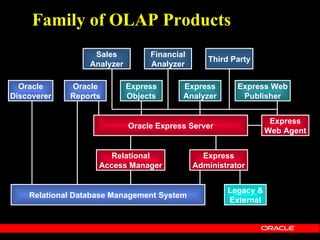
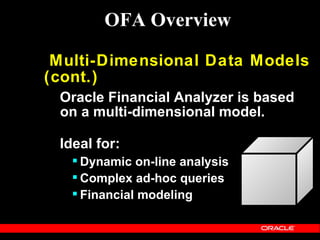
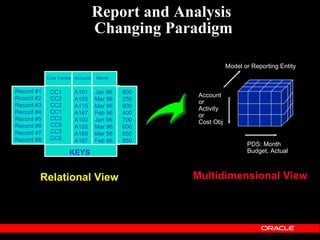
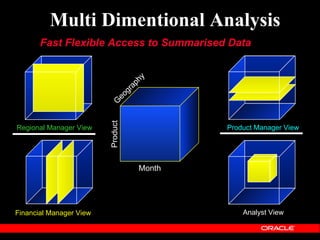
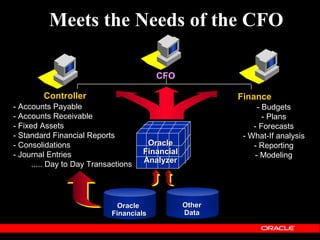
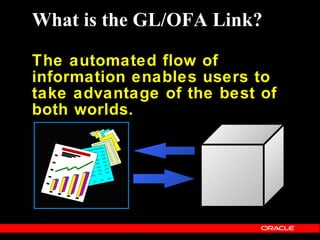
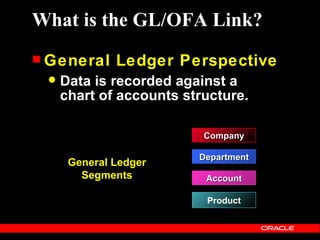
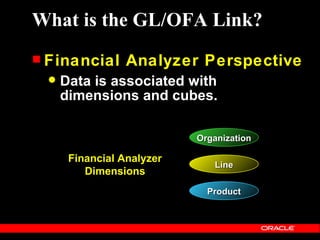
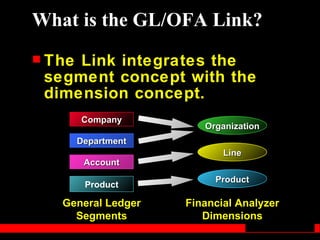
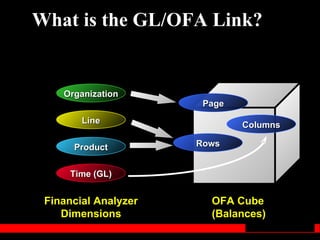
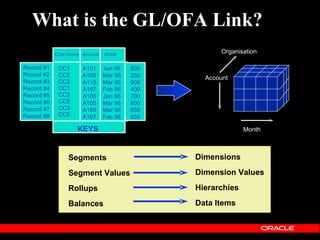
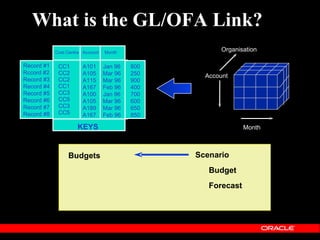
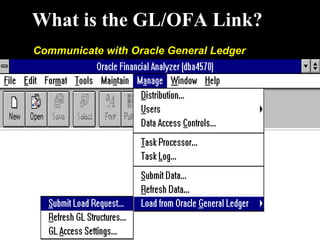
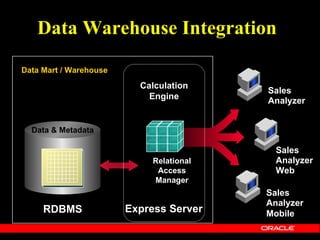
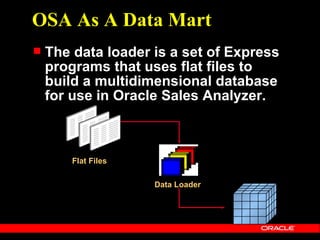
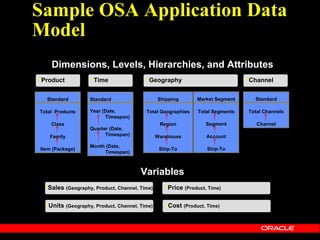

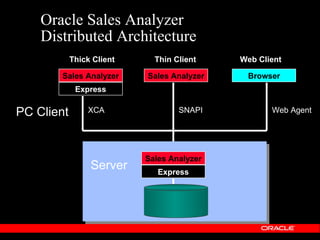
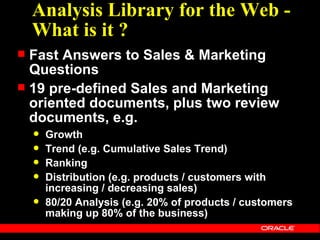


The document discusses Oracle Financial Analyzer, a tool for financial reporting, analysis, budgeting and planning that integrates transactional data from ERP systems into a multidimensional data model for flexible analysis. It provides an overview of Oracle Financial Analyzer's features and how it can be used by financial analysts, business managers, and CFOs. Additionally, it explains how Oracle Financial Analyzer is integrated with the general ledger to provide a link between transactional and analytical data.


![5G Explained! A High Level Overview [Introduction]](https://cdn.slidesharecdn.com/ss_thumbnails/5gexplainedahighleveloverview-260119165306-cc137a3e-thumbnail.jpg?width=640&height=640&fit=bounds)


