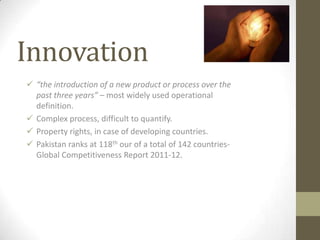
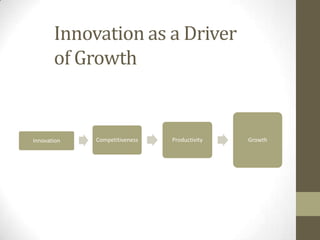
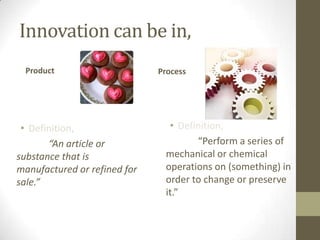
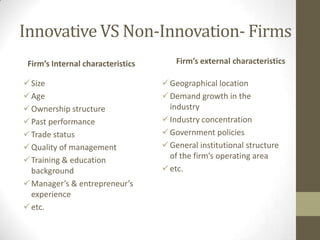
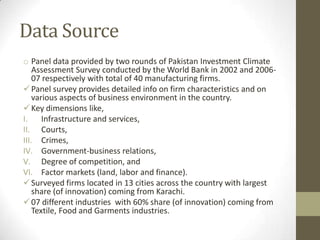
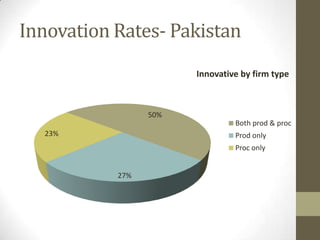
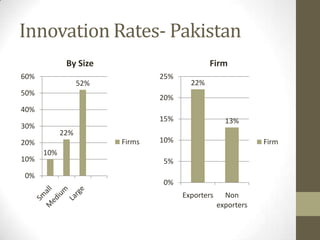
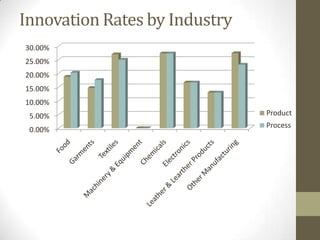
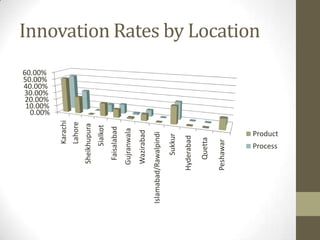
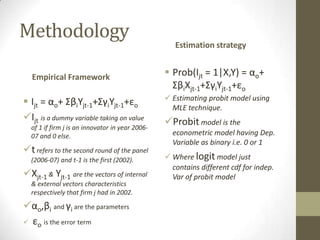
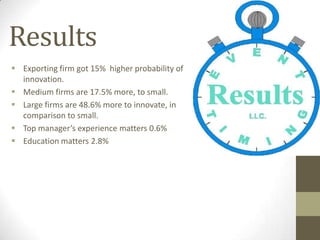
Here I begin….
Dummy Variables (Binary
variables)
References for my Presentation
Lecture!
      Books Literature             Research Paper Reference
• Elements of Econometrics-
  Jan Kmenta                     • “What Determines Innovation
• Applied Econometrics-            in Manufacturing Sector?
  Dimitrios Asteriou & Stephen     Evidence from Pakistan”, By
  G. Hall
                                   Mahreen Mahmud and
• Theory of Econometrics- A.
  Koutsoyiannis
                                   Hamna Ahmed
• Basic Econometrics- Damodar
  Gujarati
• Econometric Methods- Jack
  Johnston & John DiNardo
DUMMY VARIABLE
International Literature i.e. Books    Research Paper


• Elements of Econometrics – • What Determines
  Jan Kamenta                  Innovation in the
• Theory of Econometrics – A.  Manufacturing Sector?
  Koutsoyiannis                Evidence from Pakistan,
• Econometric Methods –        By Mahreen Mahmud
  Jack Johston & John          (Lahore School of
  DiNardo                      economics) and Hamna
• Basic Econometrics -         Ahmed
  Damodar N. Gujarati
• Applied Econometrics-
  Dimitrios Asteriou &
  Stephen g. Hall
Introduction
 Key ingredients in developing country’s growth strategy to
  catch up with Developed one’s.
 The World economics forum considers it one of the twelve
  pillars of Global competitiveness Index.
 Positive relation b/w innovation and productivity.
 Some European-industrialized countries review shows that
  the elasticity of innovation w.r.t. growth ranges b/w 0.035
  and 0.29
Innovation
 “the introduction of a new product or process over the
  past three years” – most widely used operational
  definition.
 Complex process, difficult to quantify.
 Property rights, in case of developing countries.
 Pakistan ranks at 118th our of a total of 142 countries-
  Global Competitiveness Report 2011-12.
Innovation as a Driver
       of Growth


Innovation   Competitiveness   Productivity   Growth
Innovation can be in,
 Product                      Process


 • Definition,                  • Definition,
       “An article or                 “Perform a series of
substance that is              mechanical or chemical
manufactured or refined for    operations on (something) in
sale.”                         order to change or preserve
                               it.”
Innovative VS Non-Innovation- Firms
 Firm’s Internal characteristics       Firm’s external characteristics

 Size                              Geographical location
 Age                               Demand growth in the
 Ownership structure                industry
 Past performance                  Industry concentration
 Trade status                      Government policies
 Quality of management             General institutional structure
 Training & education               of the firm’s operating area
  background                        etc.
 Manager’s & entrepreneur’s
  experience
 etc.
Firm’s size
and
innovation

 Positive link b/w size of firms, innovation and
  productivity.
Data Source
o Panel data provided by two rounds of Pakistan Investment Climate
    Assessment Survey conducted by the World Bank in 2002 and 2006-
    07 respectively with total of 40 manufacturing firms.
 Panel survey provides detailed info on firm characteristics and on
    various aspects of business environment in the country.
 Key dimensions like,
I.     Infrastructure and services,
II. Courts,
III. Crimes,
IV. Government-business relations,
V. Degree of competition, and
VI. Factor markets (land, labor and finance).
 Surveyed firms located in 13 cities across the country with largest
    share (of innovation) coming from Karachi.
 07 different industries with 60% share (of innovation) coming from
    Textile, Food and Garments industries.
Innovation Rates- Pakistan
                       Innovative by firm type


                 50%
                                Both prod & proc
  23%                           Prod only
                                Proc only


           27%
Innovation Rates- Pakistan
             By Size                          Firm
60%                             25%
                  52%                   22%
50%
                                20%
40%
                                15%                 13%
30%
            22%
20%                     Firms   10%                           Firm
      10%
10%                             5%
0%
                                0%
                                      Exporters     Non
                                                  exporters
Innovation Rates by Industry
30.00%
25.00%
20.00%
15.00%
10.00%
 5.00%                         Product
                               Process
 0.00%
60.00%
                                  50.00%
                                  40.00%
                                  30.00%
                                   20.00%
                                   10.00%
                                    0.00%
                   Karachi
                   Lahore
           Sheikhupura
                 Sialkot
           Faisalabad
          Gujranwala
          Wazirabad
Islamabad/Rawalpindi
             Sukkur
         Hyderabad

            Quetta

         Peshawar
                                            Innovation Rates by Location


              Process
                        Product
Methodology
                                                    Estimation strategy


  Empirical Framework                             Prob(Ijt = 1|X,Y) = αo+
                                                   ΣβiXjt-1+ΣγiYjt-1+εo
                                                  Estimating probit model using
 Ijt = αo+ ΣβiYjt-1+ΣγiYjt-1+εo                   MLE technique.
Ijt is a dummy variable taking on value         Probit model is the
  of 1 if firm j is an innovator in year 2006-
  07 and 0 else.                                   econometric model having Dep.
                                                   Variable as binary i.e. 0 or 1
t refers to the second round of the panel
  (2006-07) and t-1 is the first (2002).          Where logit model just
                                                   contains different cdf for indep.
Xjt-1 & Yjt-1 are the vectors of internal         Var of probit model
  & external vectors characteristics
  respectively that firm j had in 2002.

αo,βi and γi are the parameters
 εo is the error term
Modified Dep. Var. Technique
       Product equation             Process equation

Prob(Prodjt = 1|X,Y) =        • Prob(Procjt = 1|X,Y) = αo+
 αo+ ΣβiXjt-1+ΣγiYjt-1+εo        ΣβiXjt-1+ΣγiYjt-1+εo
 Prod refers to product       • Proc refers to process
  innovation in the 2006-07      innovation in the 2006-07
  period, respectively.          period, respectively.
 In this way, through this    • In this way, through this
  equation estimates on the      equation estimates on the
  determinants of innovation     determinants of innovation
  are separate for product       are separate for product
  innovators.                    innovators.
Results
 Exporting firm got 15% higher probability of
  innovation.
 Medium firms are 17.5% more, to small.
 Large firms are 48.6% more to innovate, in
  comparison to small.
 Top manager’s experience matters 0.6%
 Education matters 2.8%
Equation 2, 2(augmented) 3, 4
             Table 3                              Table 4

• Shows the result of estimated       • Shows the results of
  equation 2 and augmented              estimated equation 3
  equation by involving the             (product) and equation 4
  effect of firms in clusters, with     (process) , with their
  their parameters and t                parameters and t statistics
  statistics values along with          values along with marginal
  marginal effects.                     effects.
Policy implication and conclusion
Who are they?
 Summary
  •   Conclusion
Questions & Answers
The Presentation Ends, But not my
Time
Dedication of this Presentation and my
motivation!

 1.   You can’t connect the dots looking forward, you can only
      connect them looking backward.
 2.   The heaviness of being successful was replaced by the lightness
      of being a beginner again, less sure about everything.
 3.   I loved what I did. You have got to find what you love.
 4.   ‘Keep looking, Dun Settle’
 5.   Every morning I looked in the morning and say, If today were
      the last day of my lyf, what I want to do, what I am about to do
      today. And when the answer is no for too many days in a row, I
      know I need to change something.
 6.   ‘Stay hungry, stay foolish’
Steve Jobs
                      Born: February 24, 1955
                      San Francisco, California
American business executive, computer programmer, and entrepreneur
Motivational Speech
  Steve Jobs Stanford Commencement Speech 2005

Dummy variable’

  • 1.
  • 2.
  • 3.
    References for myPresentation Lecture! Books Literature Research Paper Reference • Elements of Econometrics- Jan Kmenta • “What Determines Innovation • Applied Econometrics- in Manufacturing Sector? Dimitrios Asteriou & Stephen Evidence from Pakistan”, By G. Hall Mahreen Mahmud and • Theory of Econometrics- A. Koutsoyiannis Hamna Ahmed • Basic Econometrics- Damodar Gujarati • Econometric Methods- Jack Johnston & John DiNardo
  • 5.
    DUMMY VARIABLE International Literaturei.e. Books Research Paper • Elements of Econometrics – • What Determines Jan Kamenta Innovation in the • Theory of Econometrics – A. Manufacturing Sector? Koutsoyiannis Evidence from Pakistan, • Econometric Methods – By Mahreen Mahmud Jack Johston & John (Lahore School of DiNardo economics) and Hamna • Basic Econometrics - Ahmed Damodar N. Gujarati • Applied Econometrics- Dimitrios Asteriou & Stephen g. Hall
  • 6.
    Introduction  Key ingredientsin developing country’s growth strategy to catch up with Developed one’s.  The World economics forum considers it one of the twelve pillars of Global competitiveness Index.  Positive relation b/w innovation and productivity.  Some European-industrialized countries review shows that the elasticity of innovation w.r.t. growth ranges b/w 0.035 and 0.29
  • 7.
    Innovation  “the introductionof a new product or process over the past three years” – most widely used operational definition.  Complex process, difficult to quantify.  Property rights, in case of developing countries.  Pakistan ranks at 118th our of a total of 142 countries- Global Competitiveness Report 2011-12.
  • 8.
    Innovation as aDriver of Growth Innovation Competitiveness Productivity Growth
  • 9.
    Innovation can bein, Product Process • Definition, • Definition, “An article or “Perform a series of substance that is mechanical or chemical manufactured or refined for operations on (something) in sale.” order to change or preserve it.”
  • 10.
    Innovative VS Non-Innovation-Firms Firm’s Internal characteristics Firm’s external characteristics  Size  Geographical location  Age  Demand growth in the  Ownership structure industry  Past performance  Industry concentration  Trade status  Government policies  Quality of management  General institutional structure  Training & education of the firm’s operating area background  etc.  Manager’s & entrepreneur’s experience  etc.
  • 12.
    Firm’s size and innovation  Positivelink b/w size of firms, innovation and productivity.
  • 13.
    Data Source o Paneldata provided by two rounds of Pakistan Investment Climate Assessment Survey conducted by the World Bank in 2002 and 2006- 07 respectively with total of 40 manufacturing firms.  Panel survey provides detailed info on firm characteristics and on various aspects of business environment in the country.  Key dimensions like, I. Infrastructure and services, II. Courts, III. Crimes, IV. Government-business relations, V. Degree of competition, and VI. Factor markets (land, labor and finance).  Surveyed firms located in 13 cities across the country with largest share (of innovation) coming from Karachi.  07 different industries with 60% share (of innovation) coming from Textile, Food and Garments industries.
  • 14.
    Innovation Rates- Pakistan Innovative by firm type 50% Both prod & proc 23% Prod only Proc only 27%
  • 15.
    Innovation Rates- Pakistan By Size Firm 60% 25% 52% 22% 50% 20% 40% 15% 13% 30% 22% 20% Firms 10% Firm 10% 10% 5% 0% 0% Exporters Non exporters
  • 16.
    Innovation Rates byIndustry 30.00% 25.00% 20.00% 15.00% 10.00% 5.00% Product Process 0.00%
  • 17.
    60.00% 50.00% 40.00% 30.00% 20.00% 10.00% 0.00% Karachi Lahore Sheikhupura Sialkot Faisalabad Gujranwala Wazirabad Islamabad/Rawalpindi Sukkur Hyderabad Quetta Peshawar Innovation Rates by Location Process Product
  • 18.
    Methodology Estimation strategy Empirical Framework  Prob(Ijt = 1|X,Y) = αo+ ΣβiXjt-1+ΣγiYjt-1+εo  Estimating probit model using  Ijt = αo+ ΣβiYjt-1+ΣγiYjt-1+εo MLE technique. Ijt is a dummy variable taking on value Probit model is the of 1 if firm j is an innovator in year 2006- 07 and 0 else. econometric model having Dep. Variable as binary i.e. 0 or 1 t refers to the second round of the panel (2006-07) and t-1 is the first (2002).  Where logit model just contains different cdf for indep. Xjt-1 & Yjt-1 are the vectors of internal Var of probit model & external vectors characteristics respectively that firm j had in 2002. αo,βi and γi are the parameters  εo is the error term
  • 19.
    Modified Dep. Var.Technique Product equation Process equation Prob(Prodjt = 1|X,Y) = • Prob(Procjt = 1|X,Y) = αo+ αo+ ΣβiXjt-1+ΣγiYjt-1+εo ΣβiXjt-1+ΣγiYjt-1+εo  Prod refers to product • Proc refers to process innovation in the 2006-07 innovation in the 2006-07 period, respectively. period, respectively.  In this way, through this • In this way, through this equation estimates on the equation estimates on the determinants of innovation determinants of innovation are separate for product are separate for product innovators. innovators.
  • 20.
    Results  Exporting firmgot 15% higher probability of innovation.  Medium firms are 17.5% more, to small.  Large firms are 48.6% more to innovate, in comparison to small.  Top manager’s experience matters 0.6%  Education matters 2.8%
  • 21.
    Equation 2, 2(augmented)3, 4 Table 3 Table 4 • Shows the result of estimated • Shows the results of equation 2 and augmented estimated equation 3 equation by involving the (product) and equation 4 effect of firms in clusters, with (process) , with their their parameters and t parameters and t statistics statistics values along with values along with marginal marginal effects. effects.
  • 22.
  • 24.
  • 25.
     Summary • Conclusion
  • 26.
  • 27.
    The Presentation Ends,But not my Time
  • 28.
    Dedication of thisPresentation and my motivation! 1. You can’t connect the dots looking forward, you can only connect them looking backward. 2. The heaviness of being successful was replaced by the lightness of being a beginner again, less sure about everything. 3. I loved what I did. You have got to find what you love. 4. ‘Keep looking, Dun Settle’ 5. Every morning I looked in the morning and say, If today were the last day of my lyf, what I want to do, what I am about to do today. And when the answer is no for too many days in a row, I know I need to change something. 6. ‘Stay hungry, stay foolish’
  • 29.
    Steve Jobs Born: February 24, 1955 San Francisco, California American business executive, computer programmer, and entrepreneur
  • 30.
    Motivational Speech Steve Jobs Stanford Commencement Speech 2005