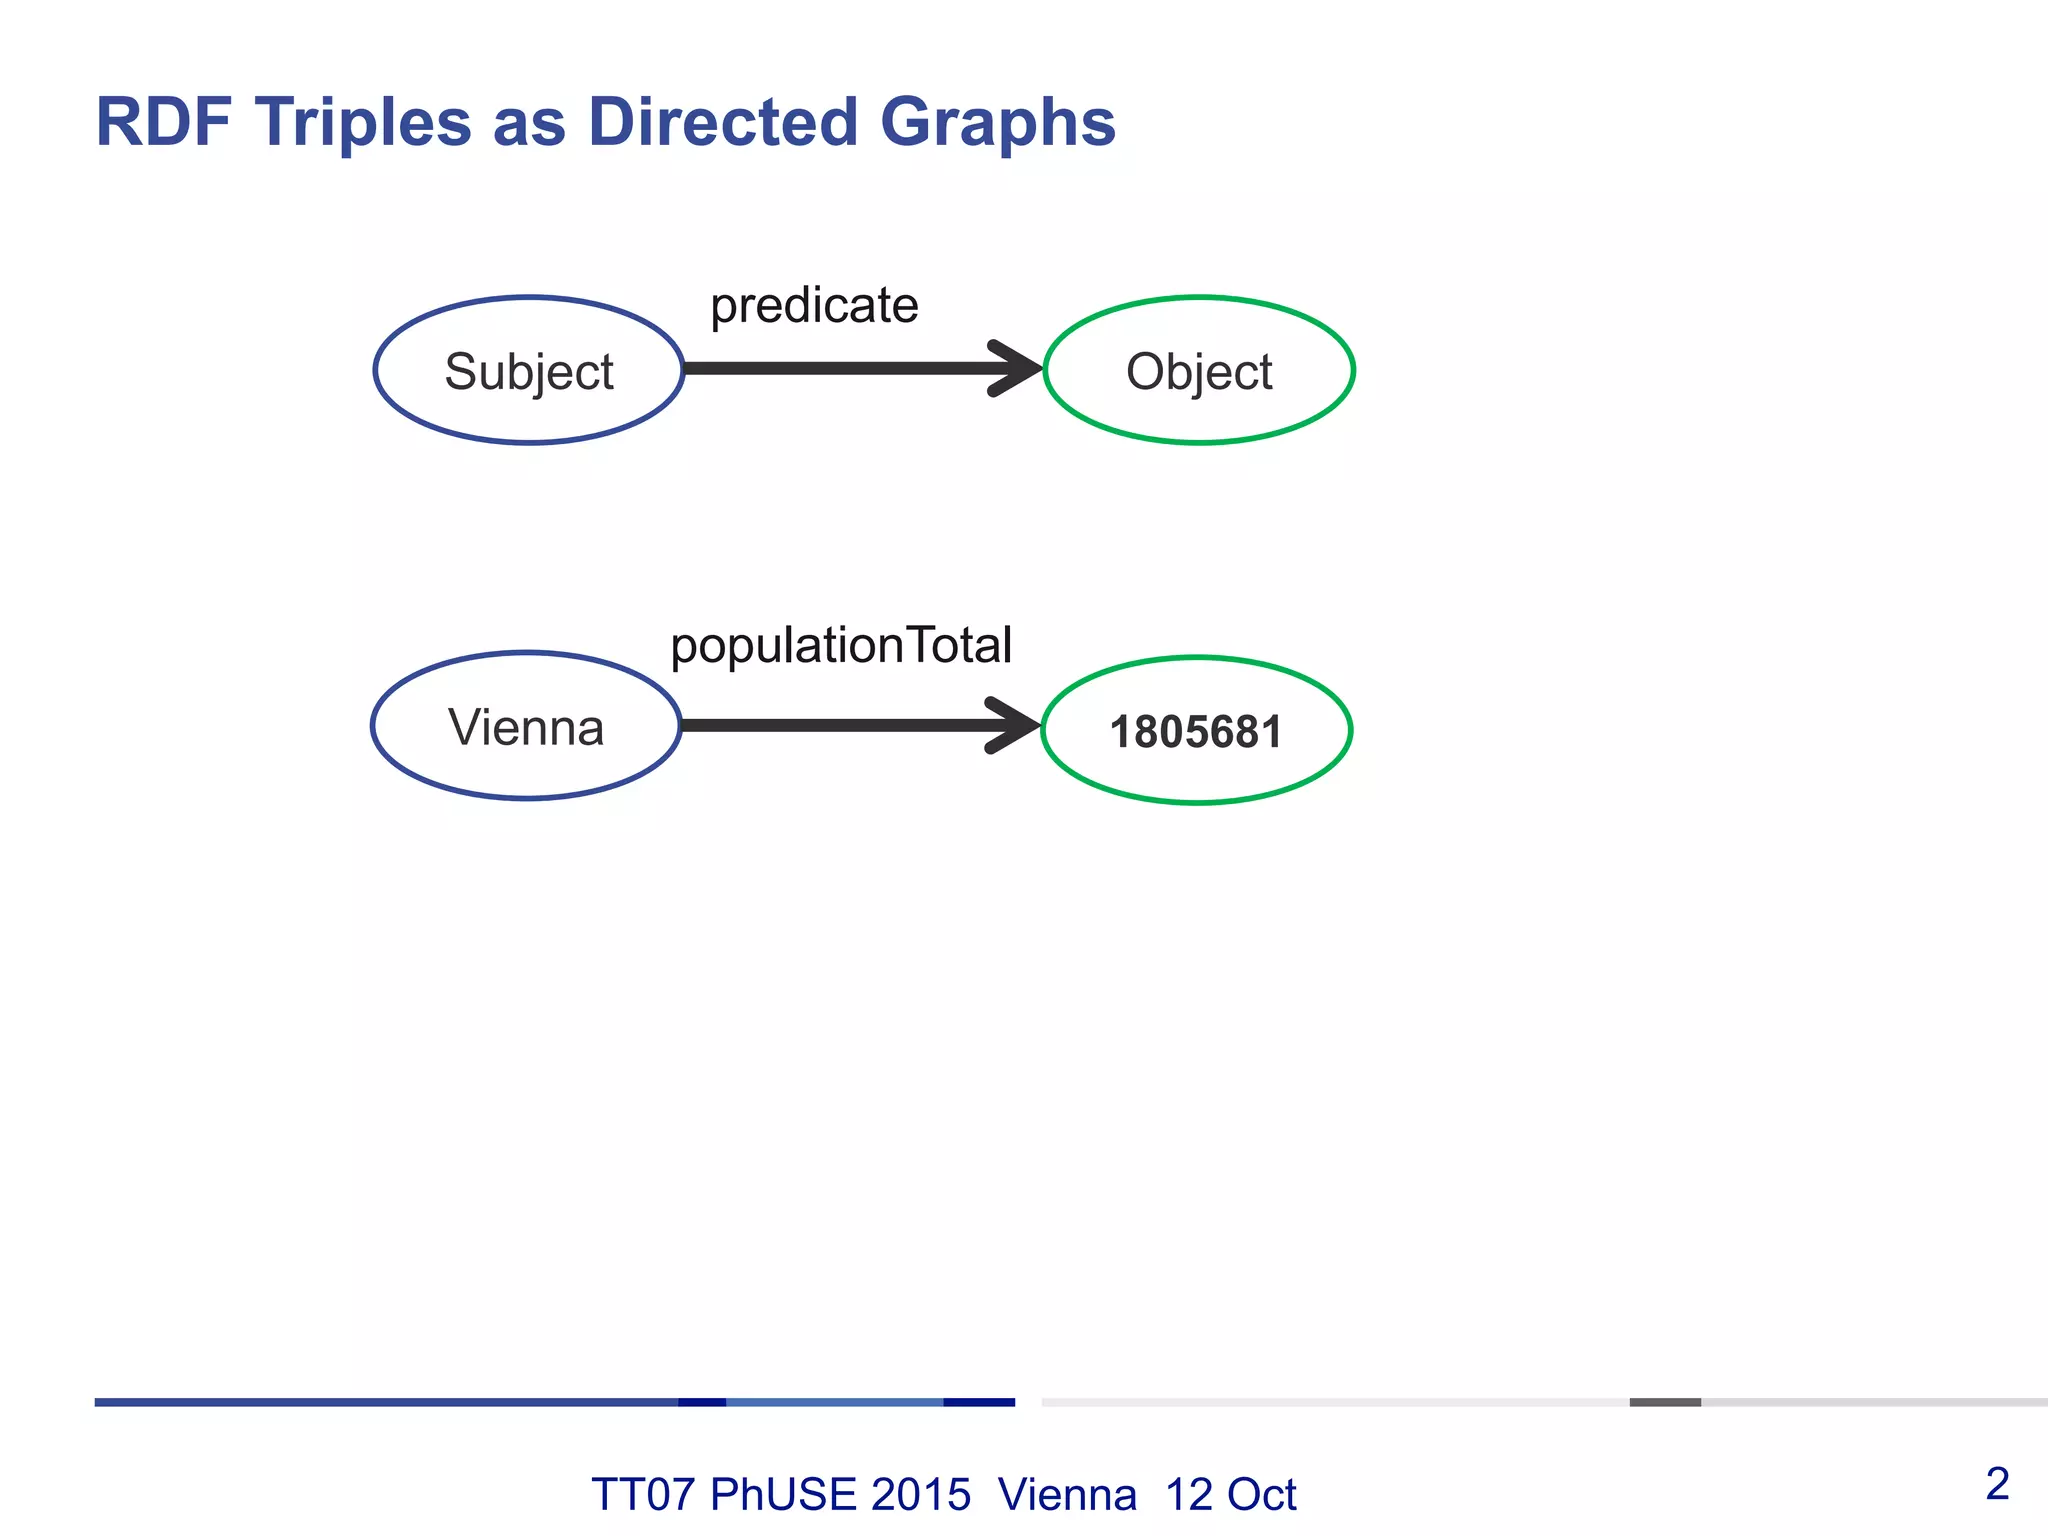
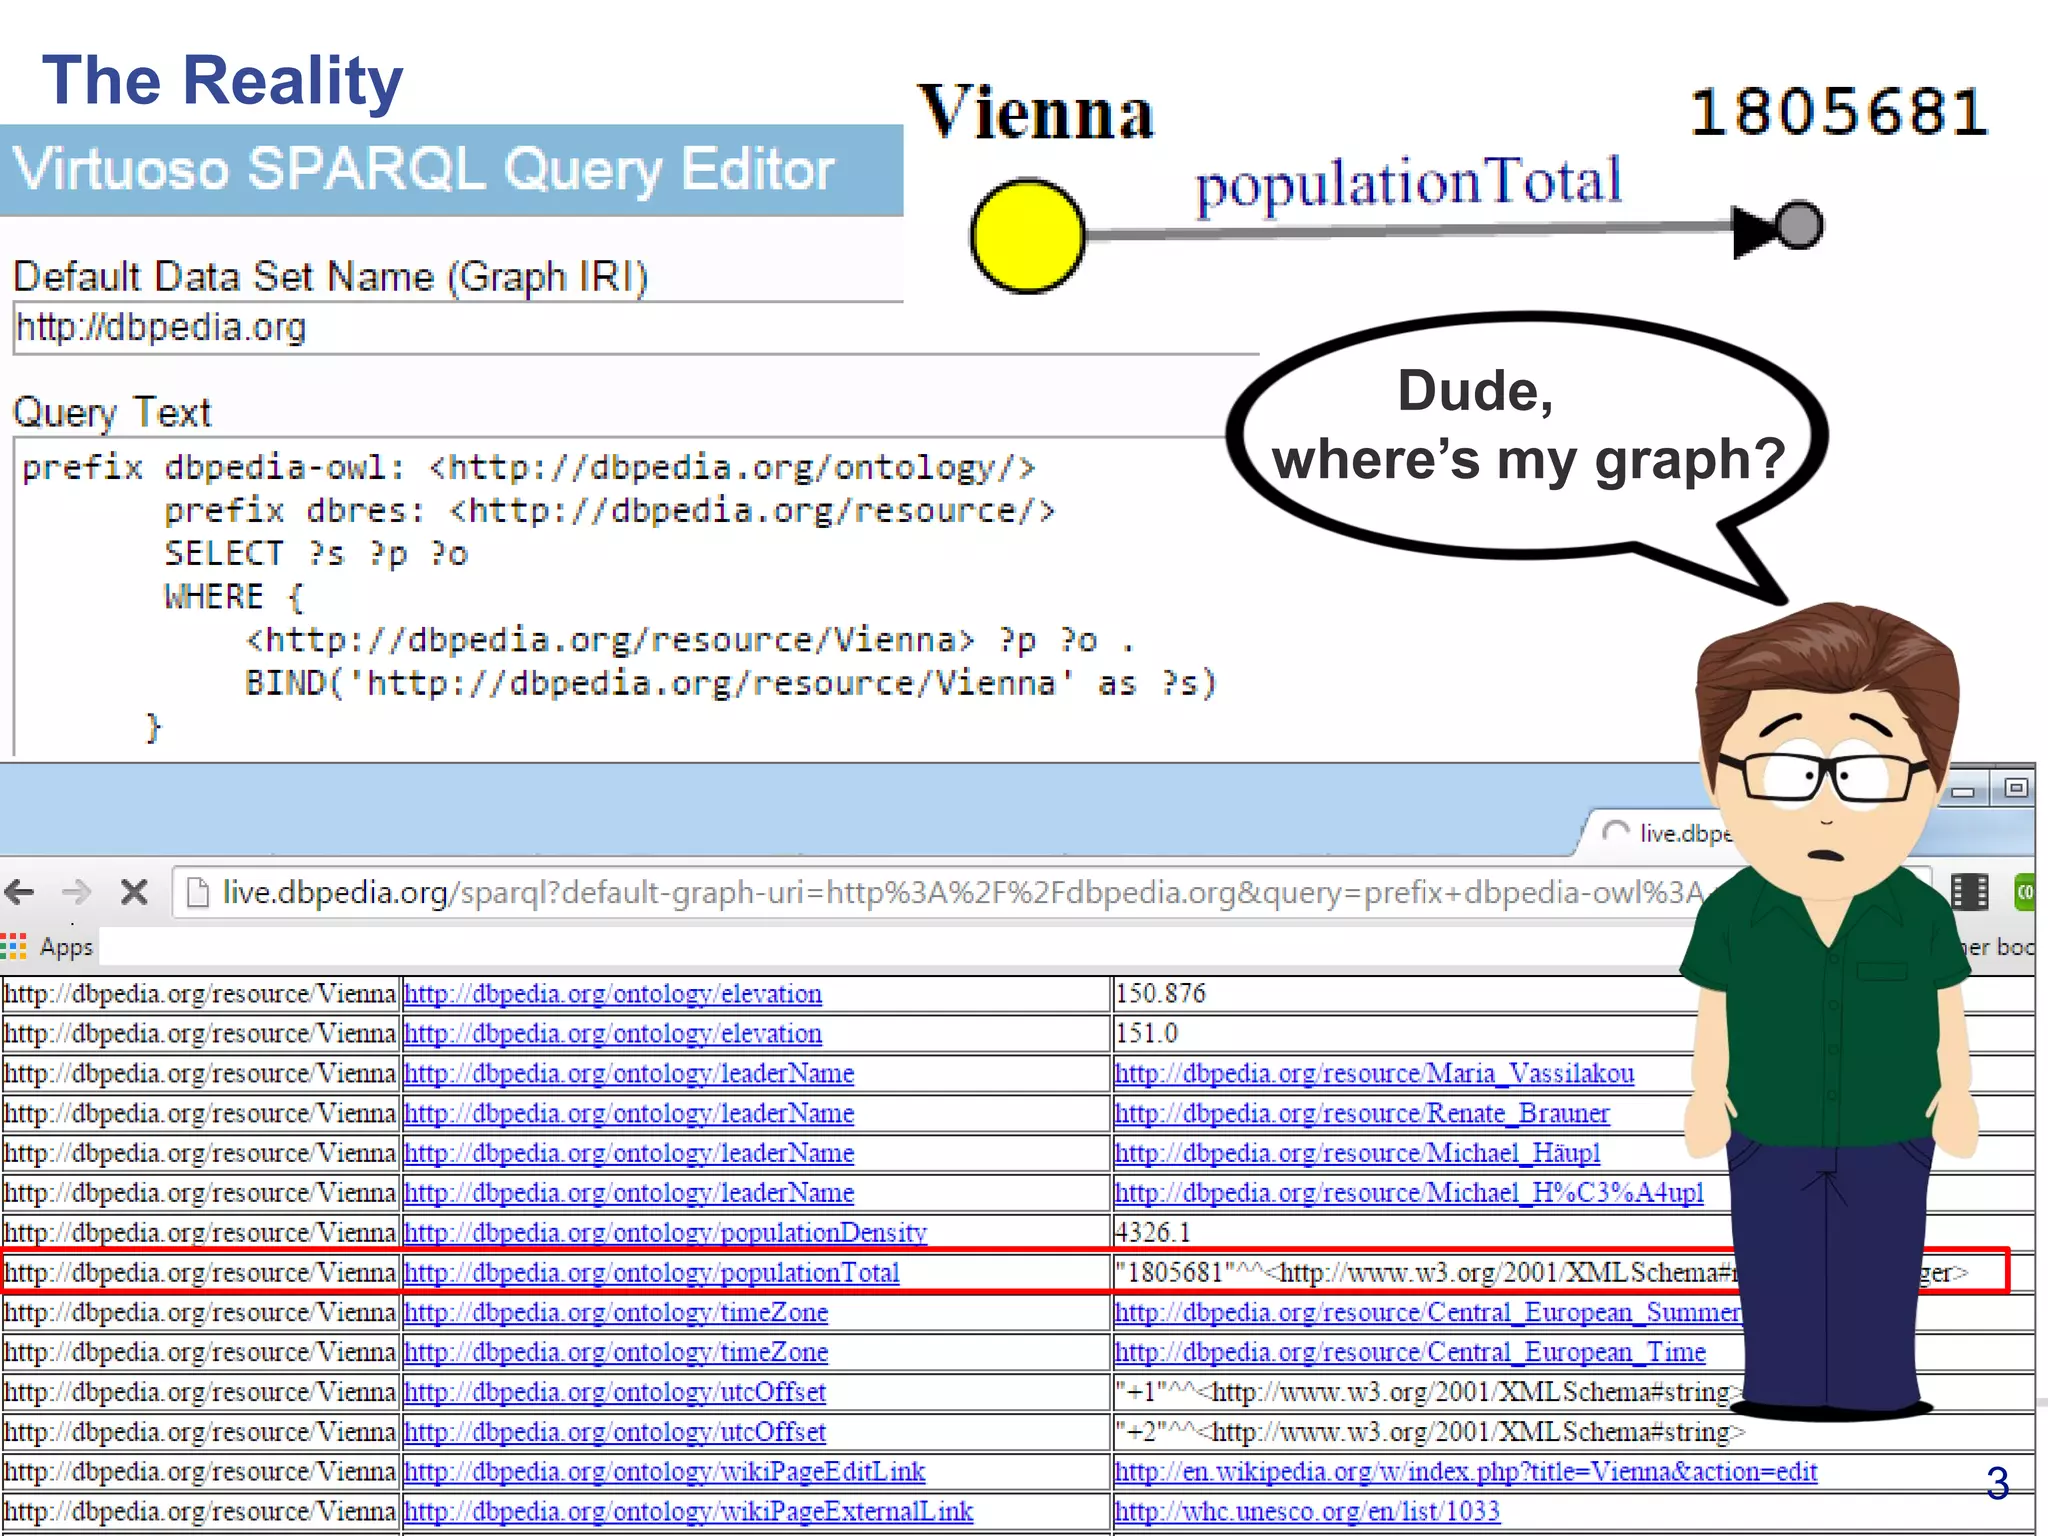
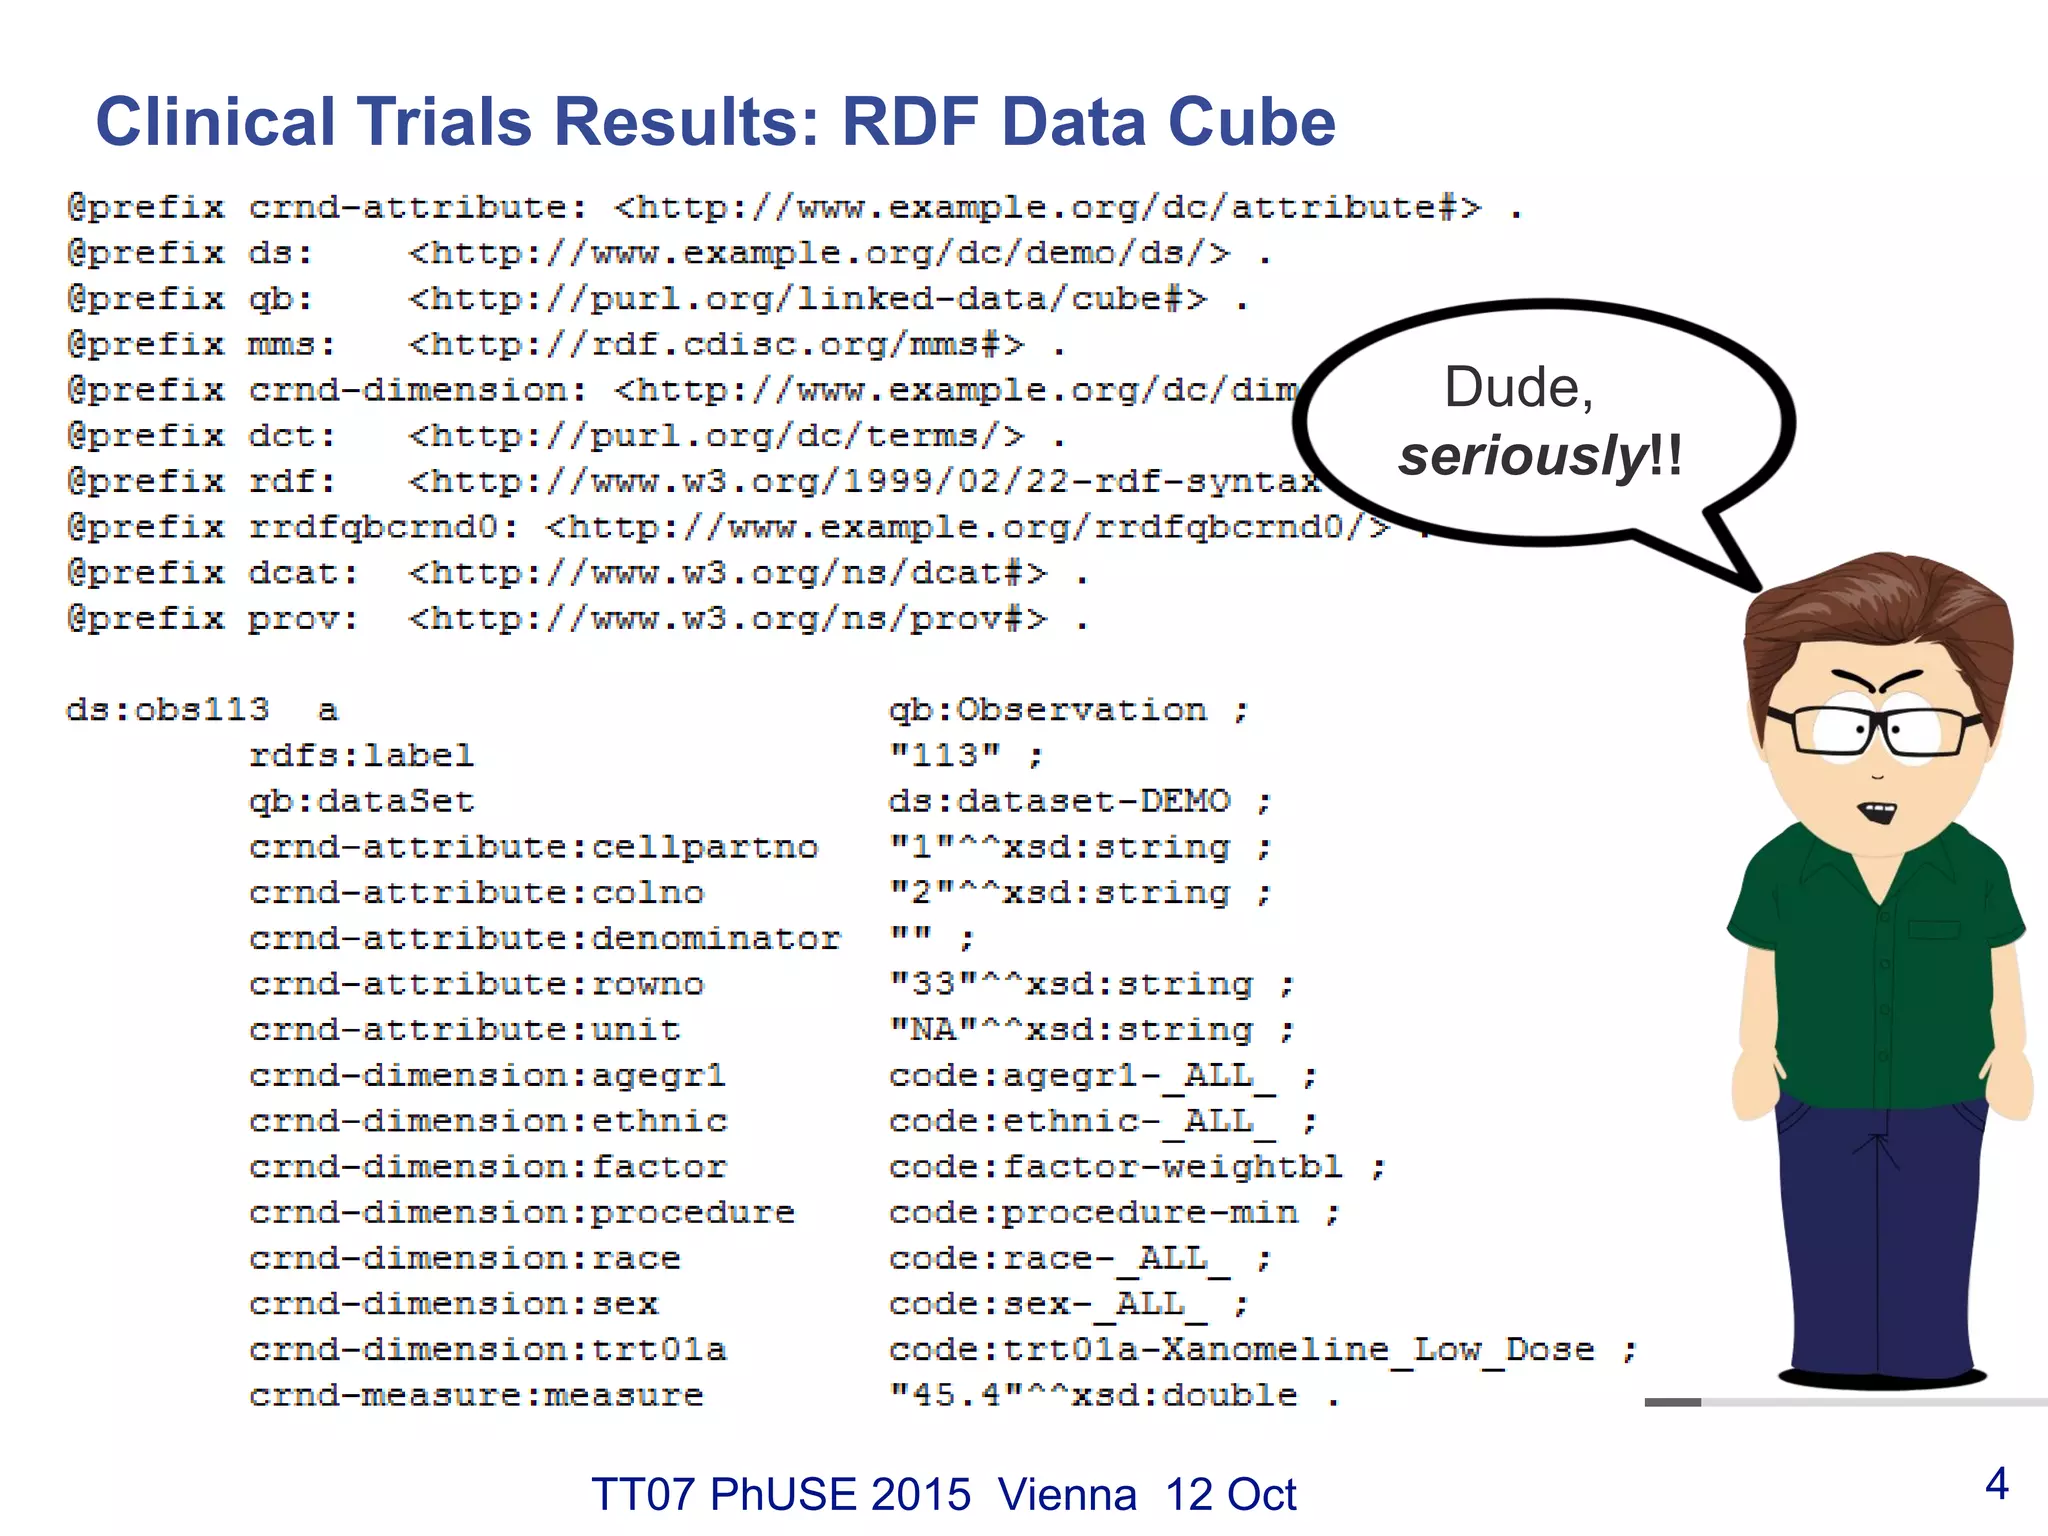
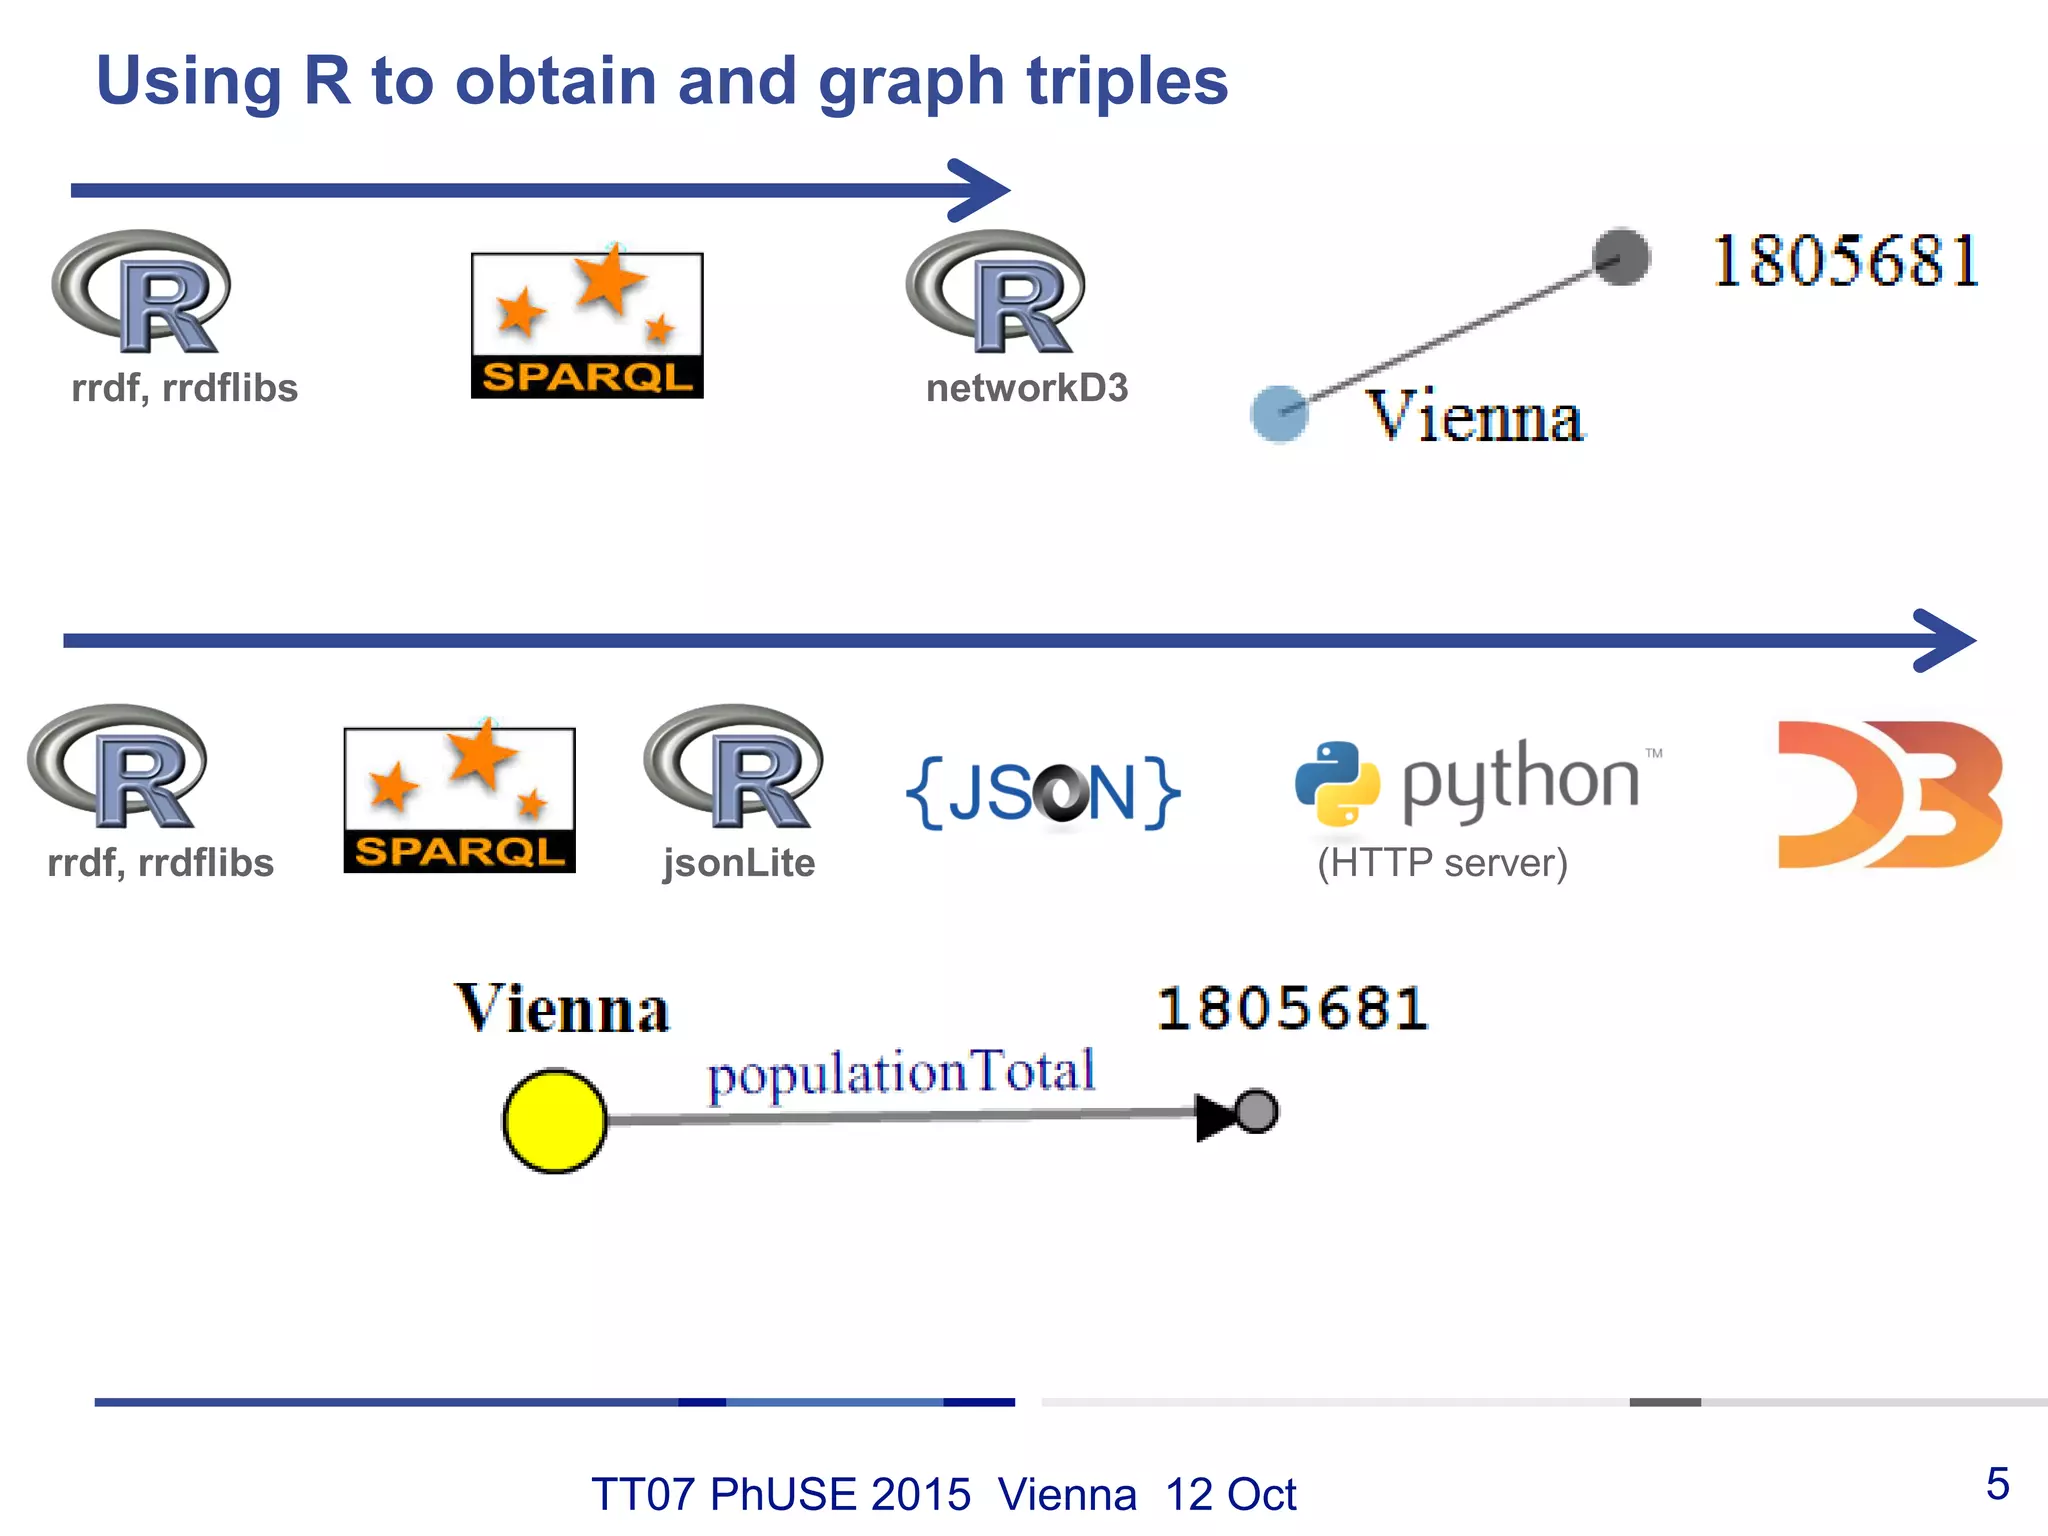
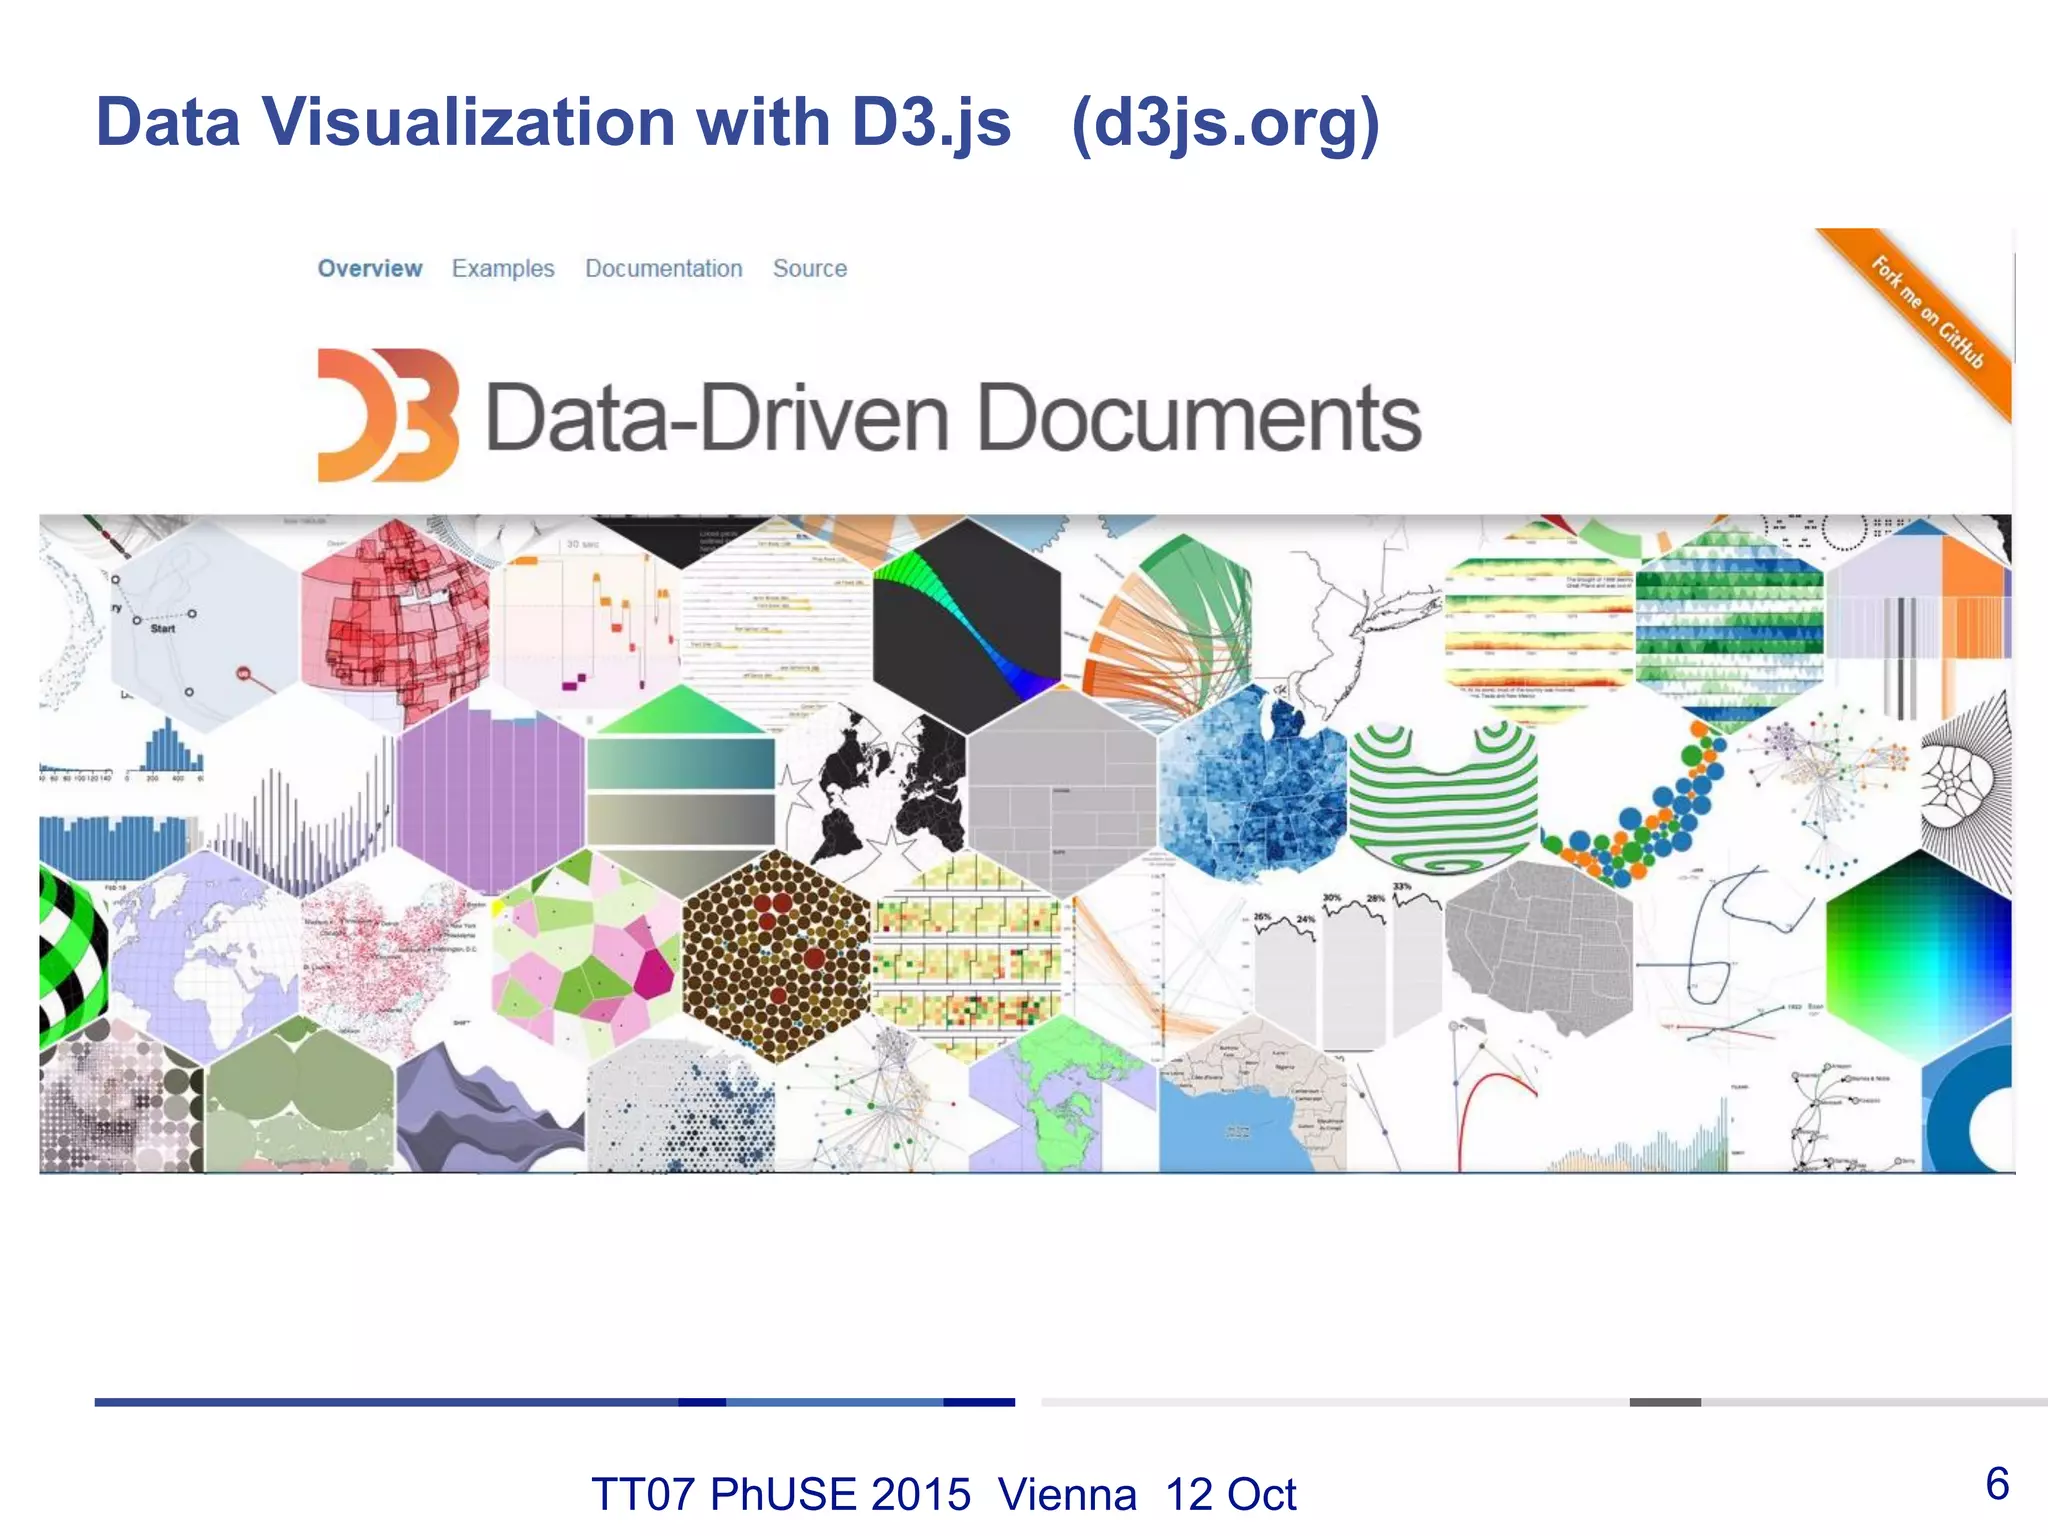
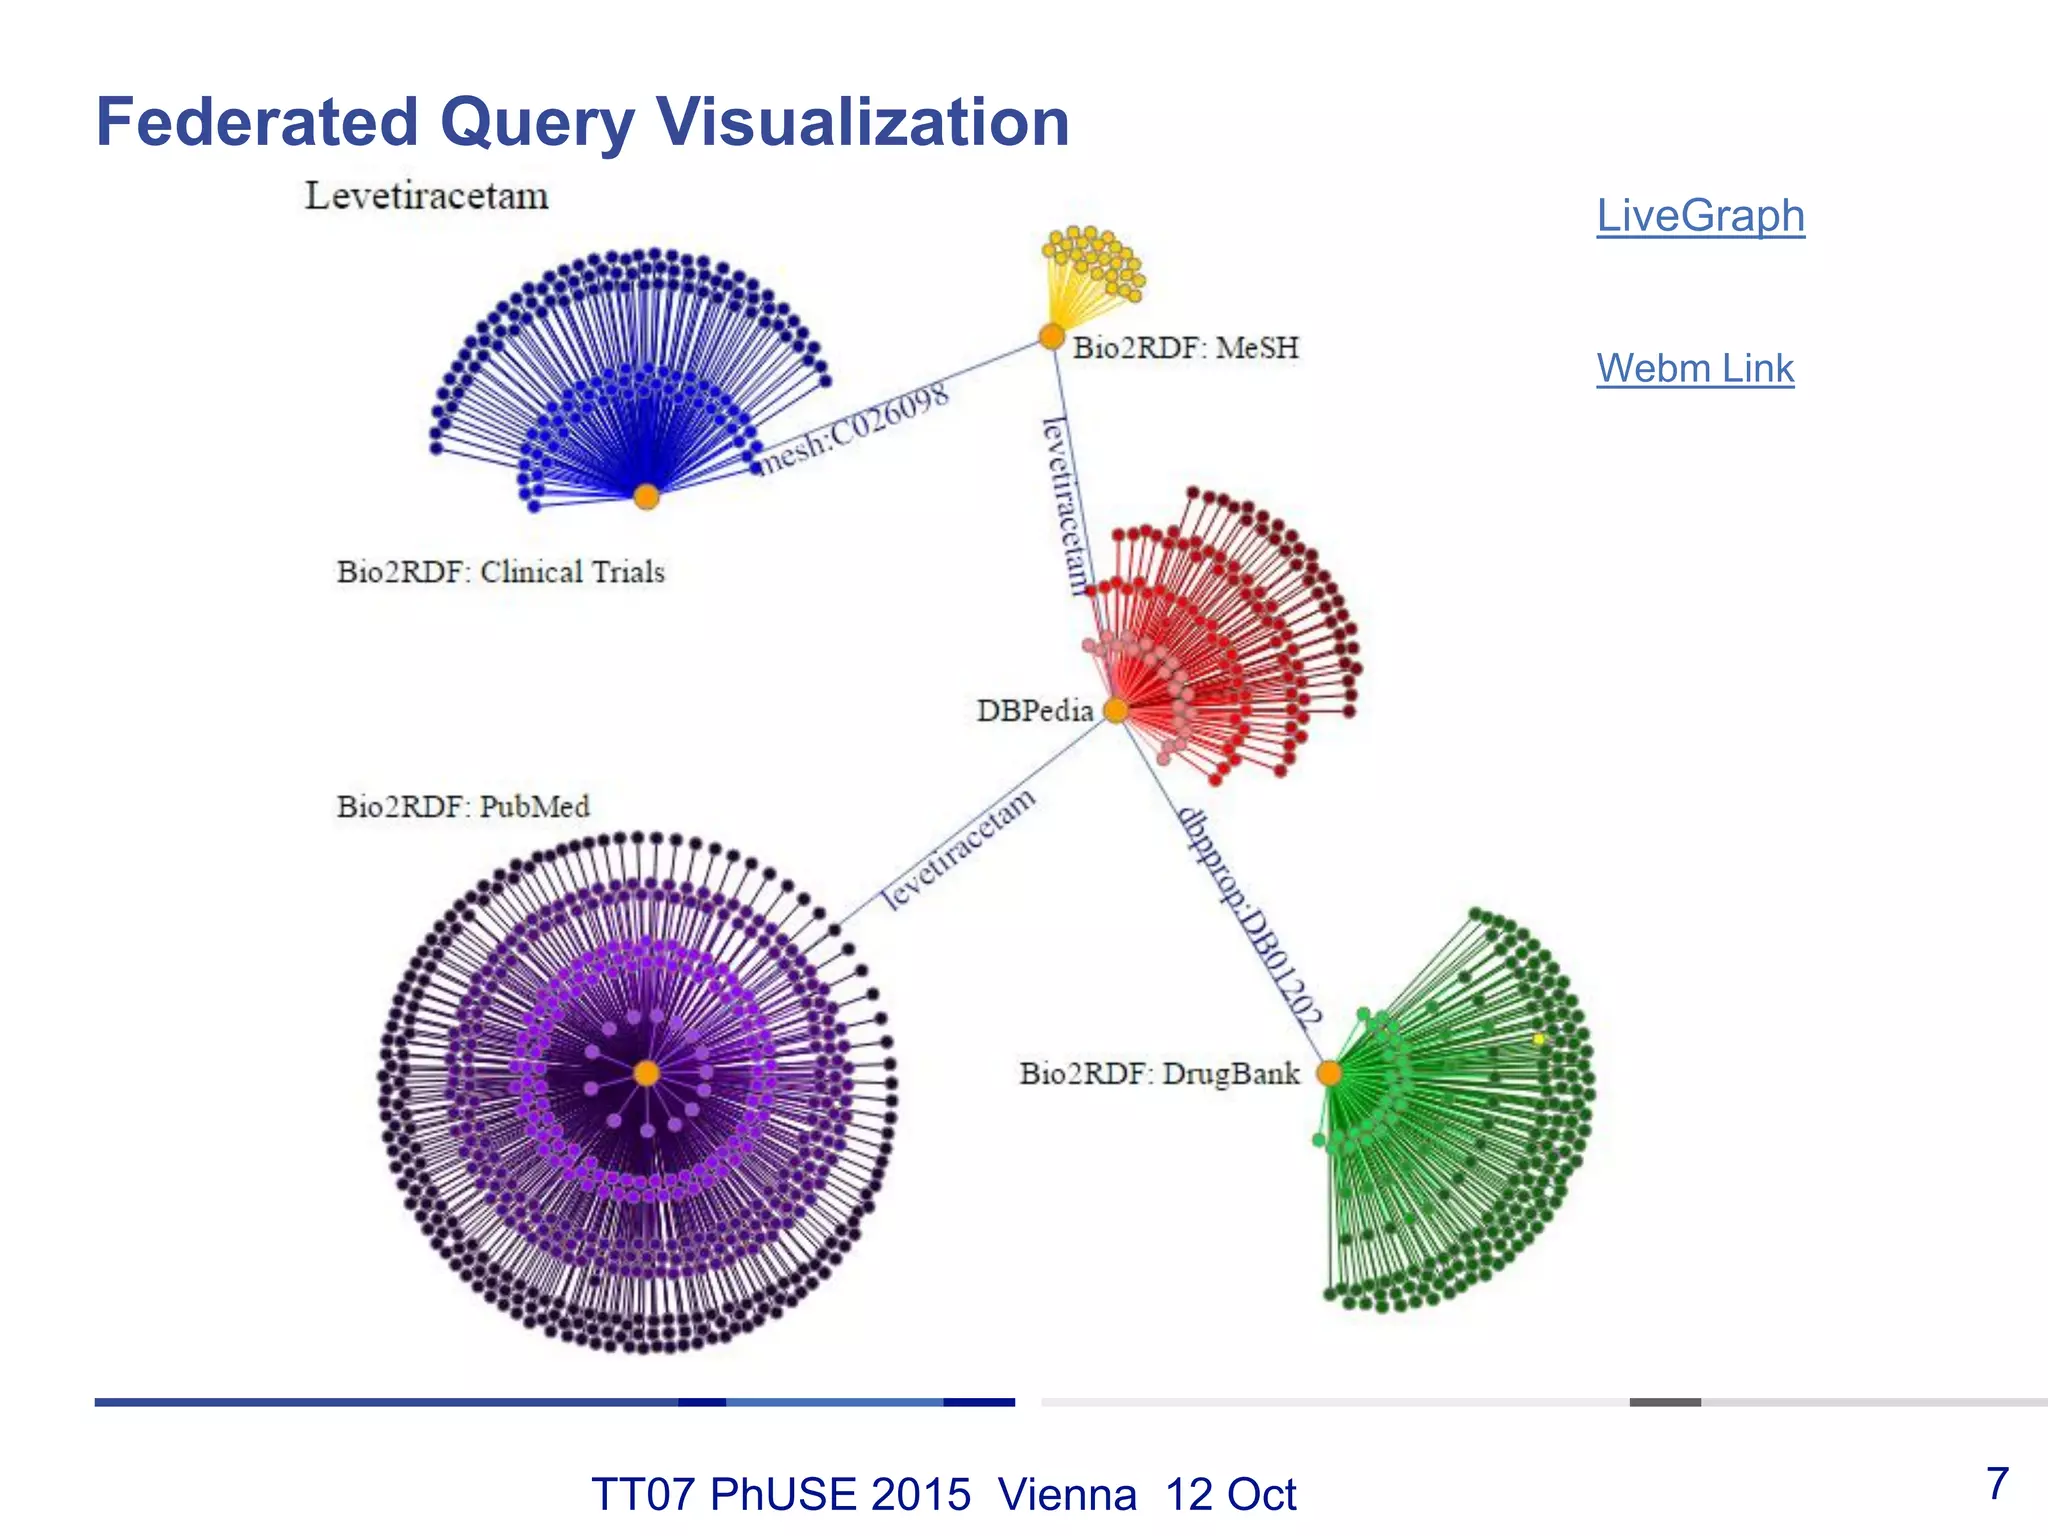
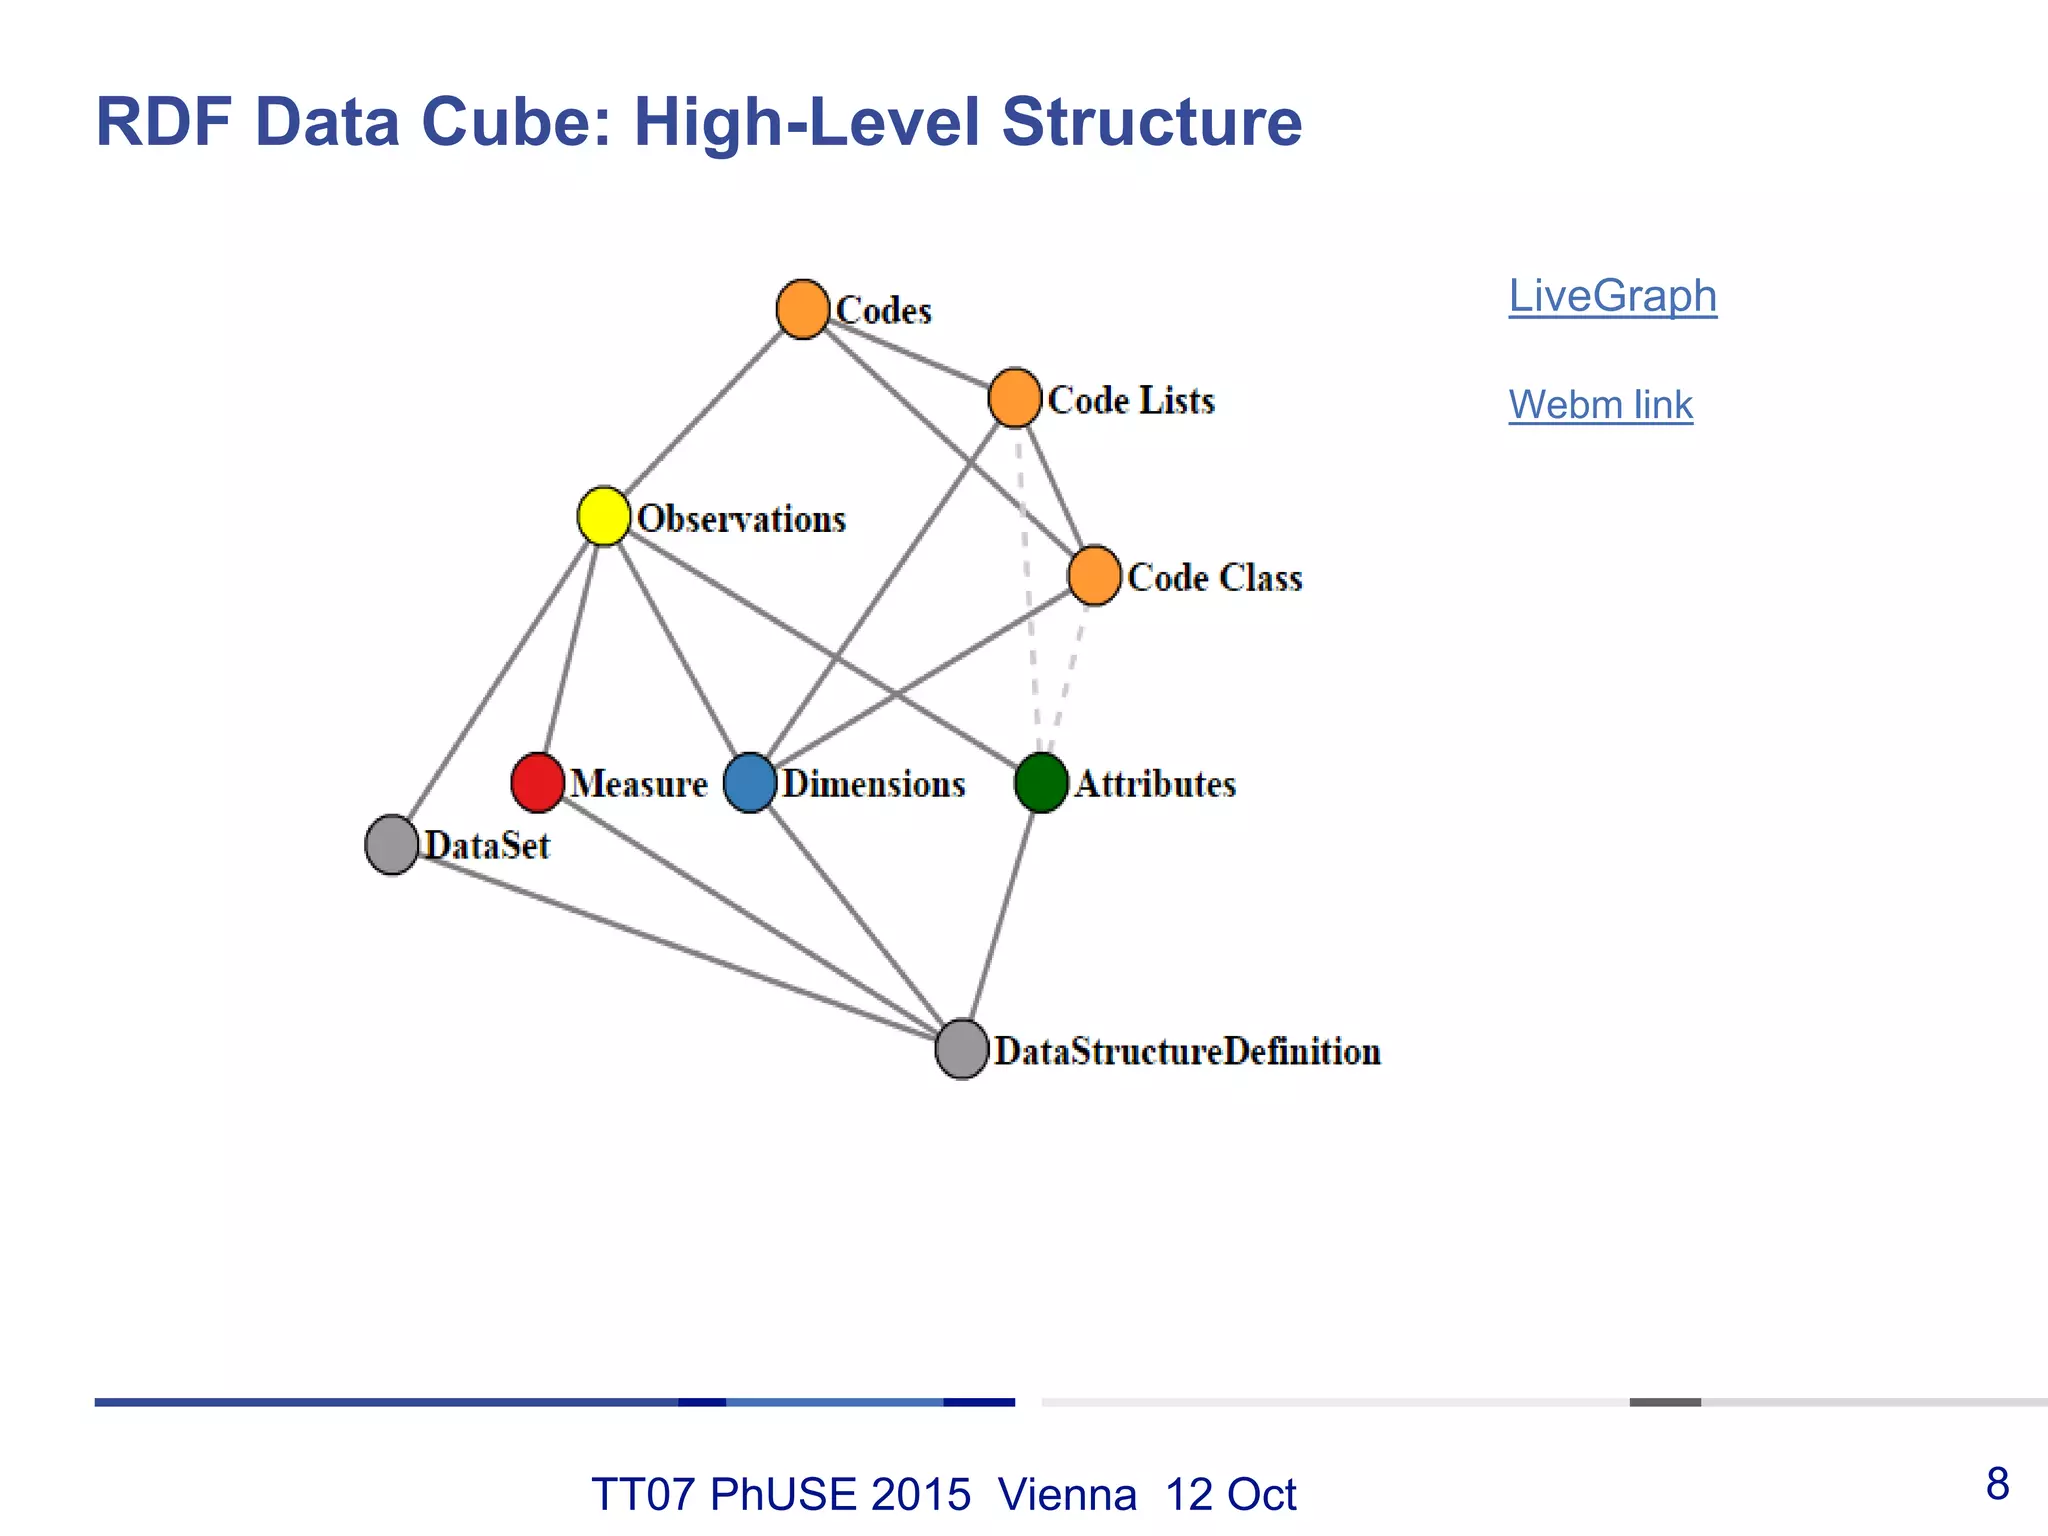
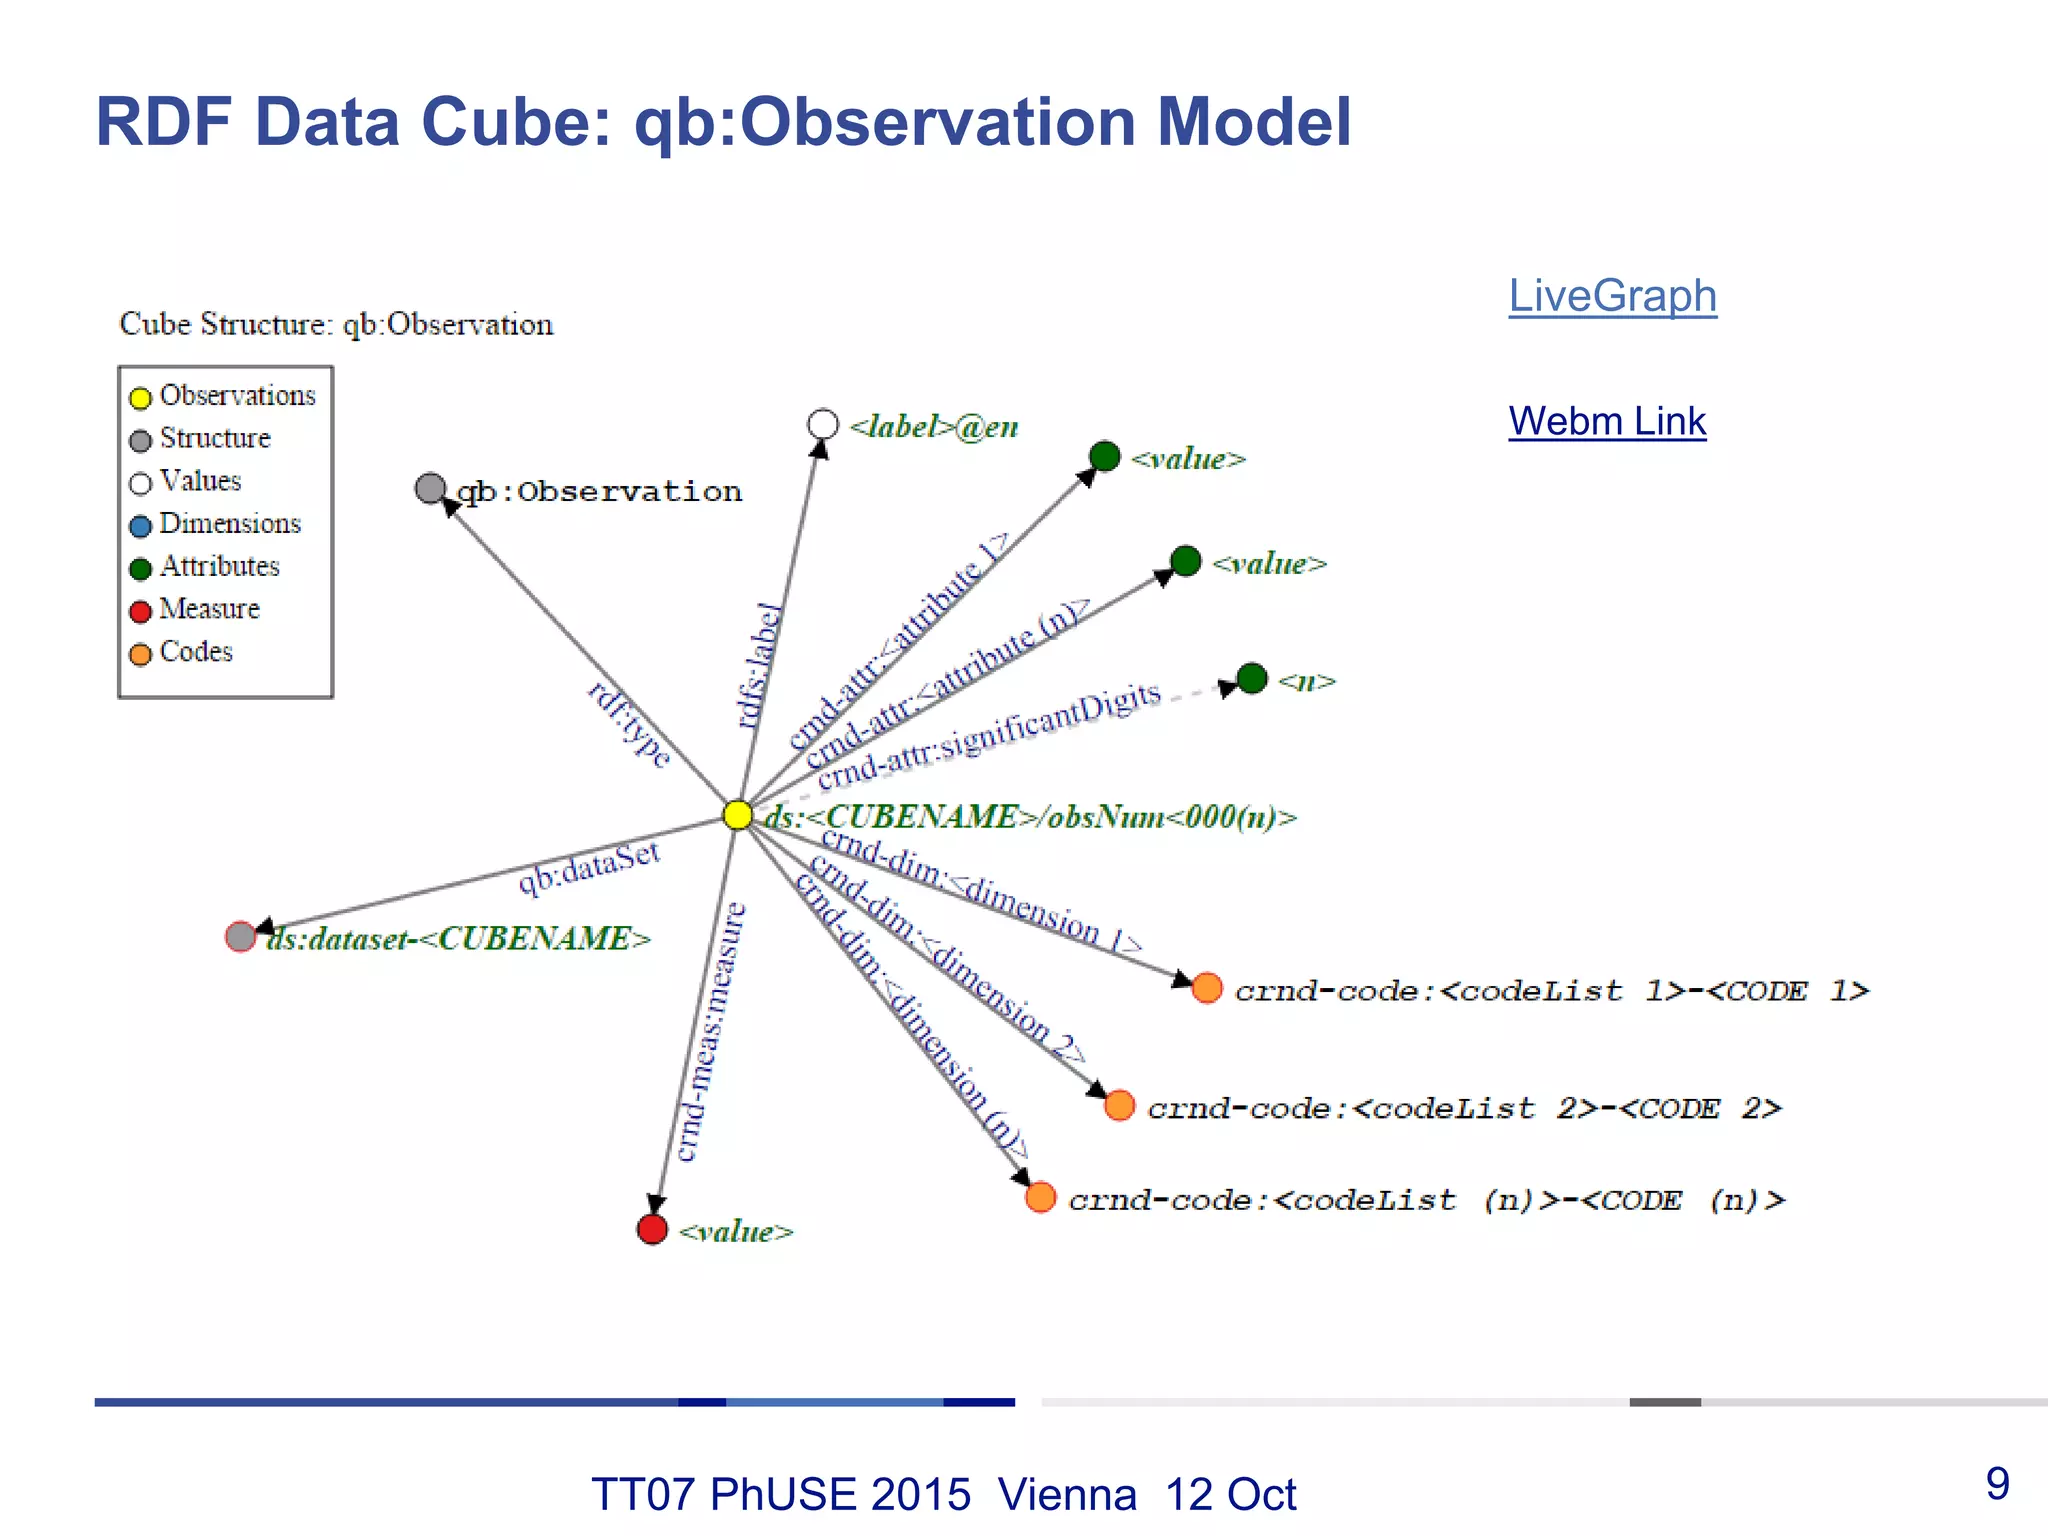
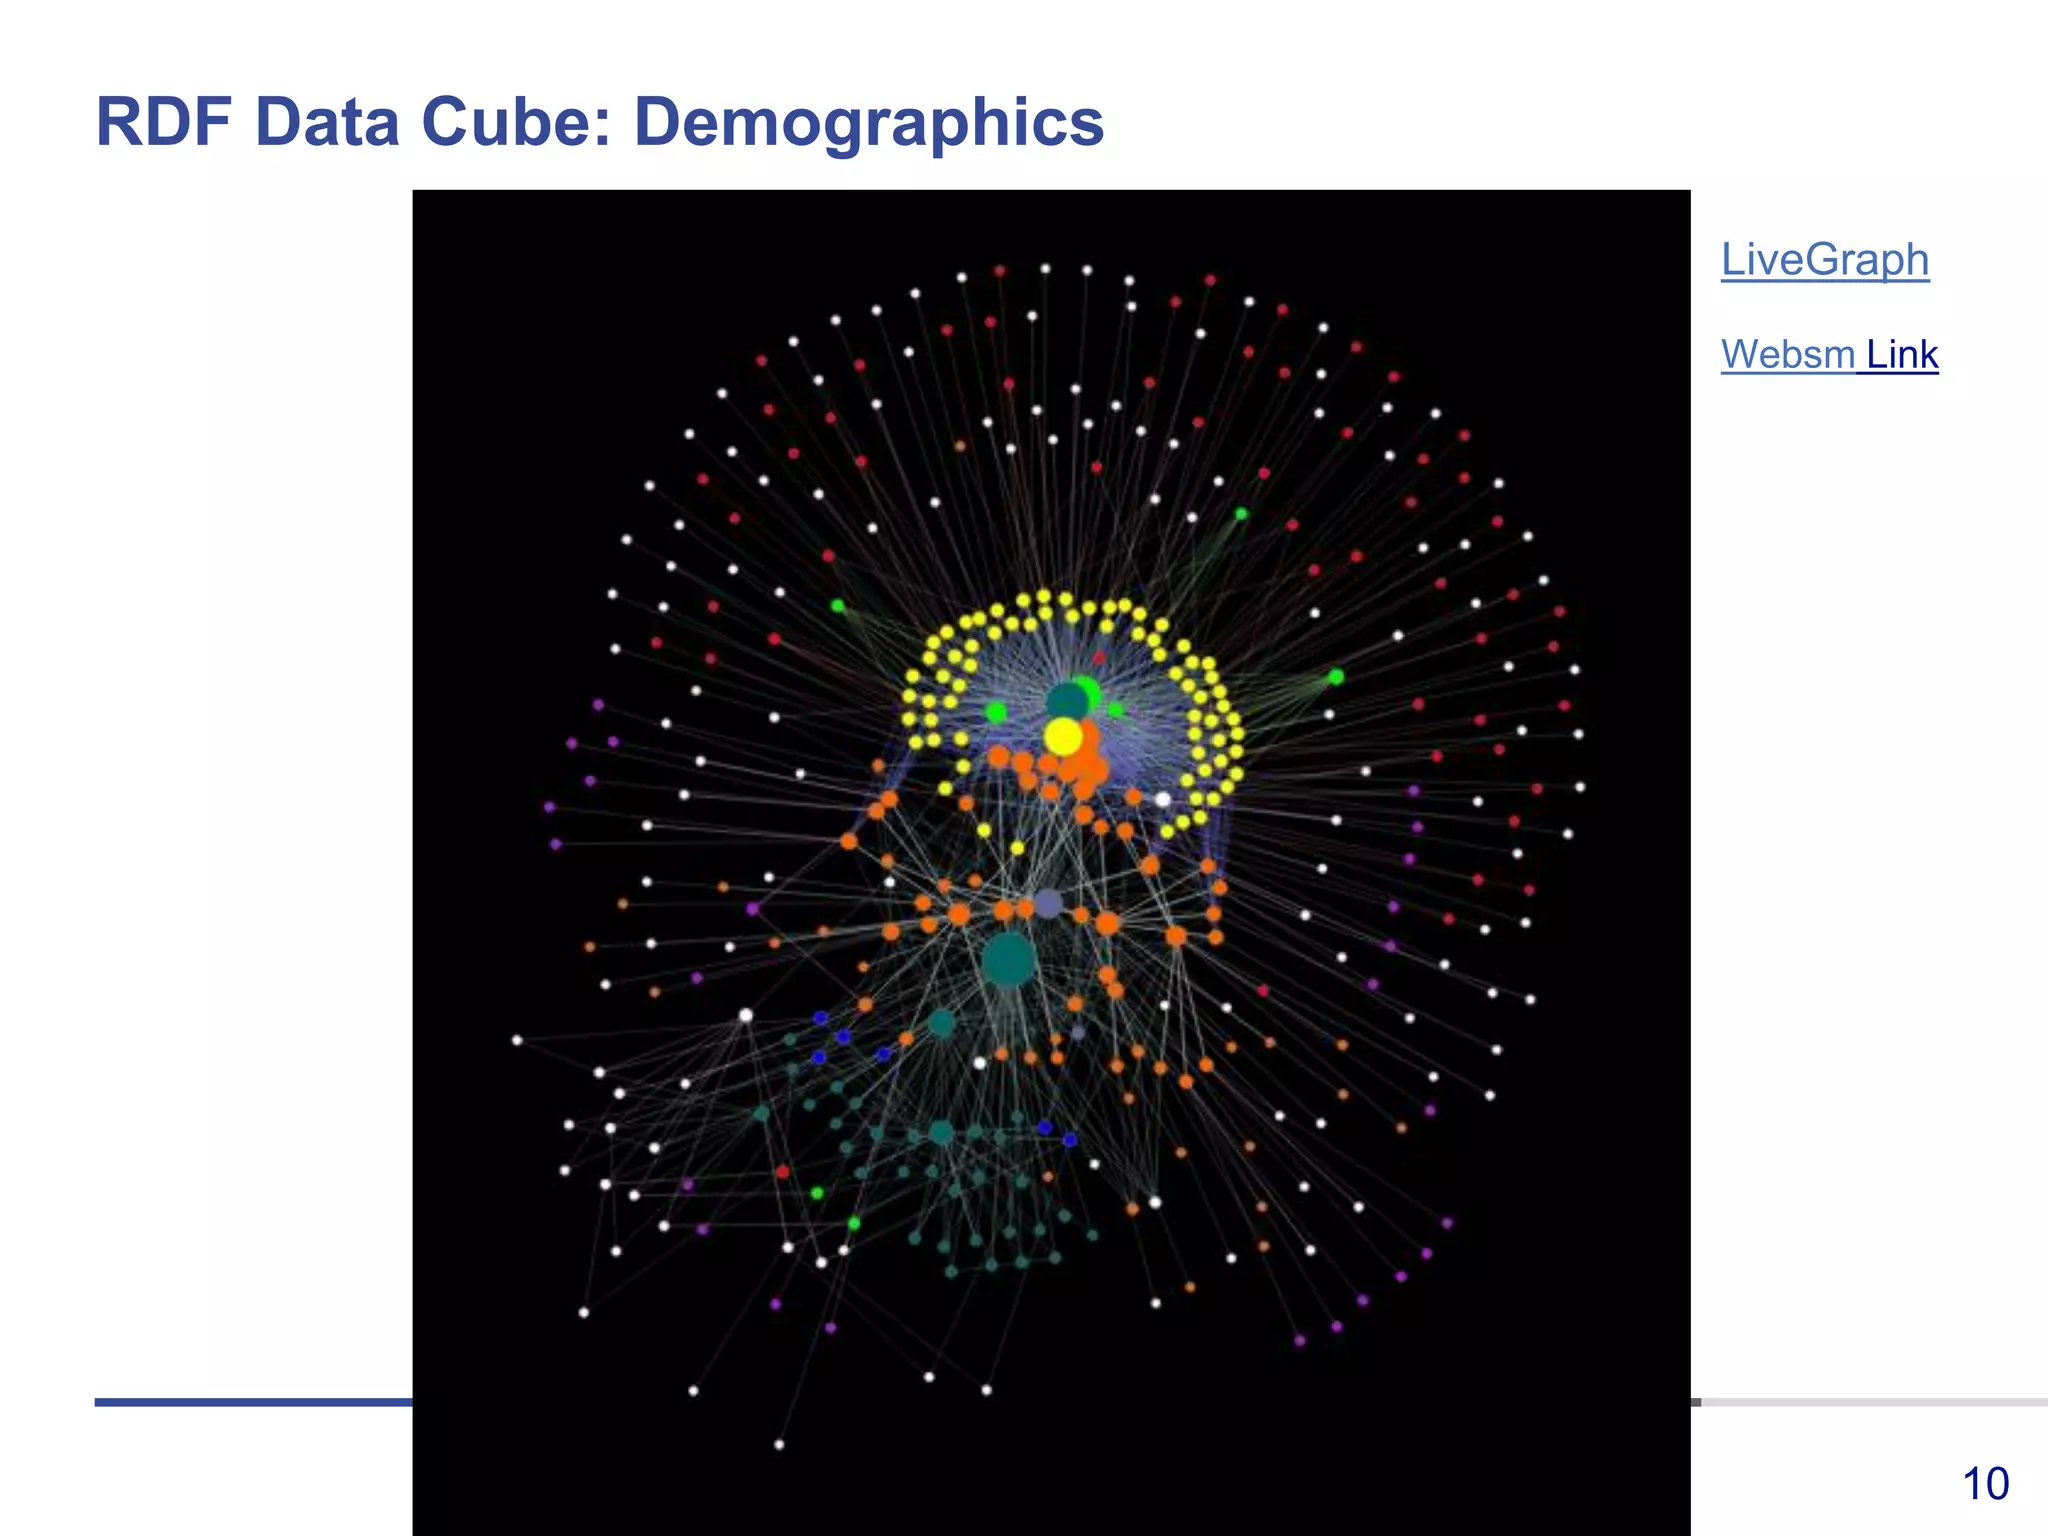
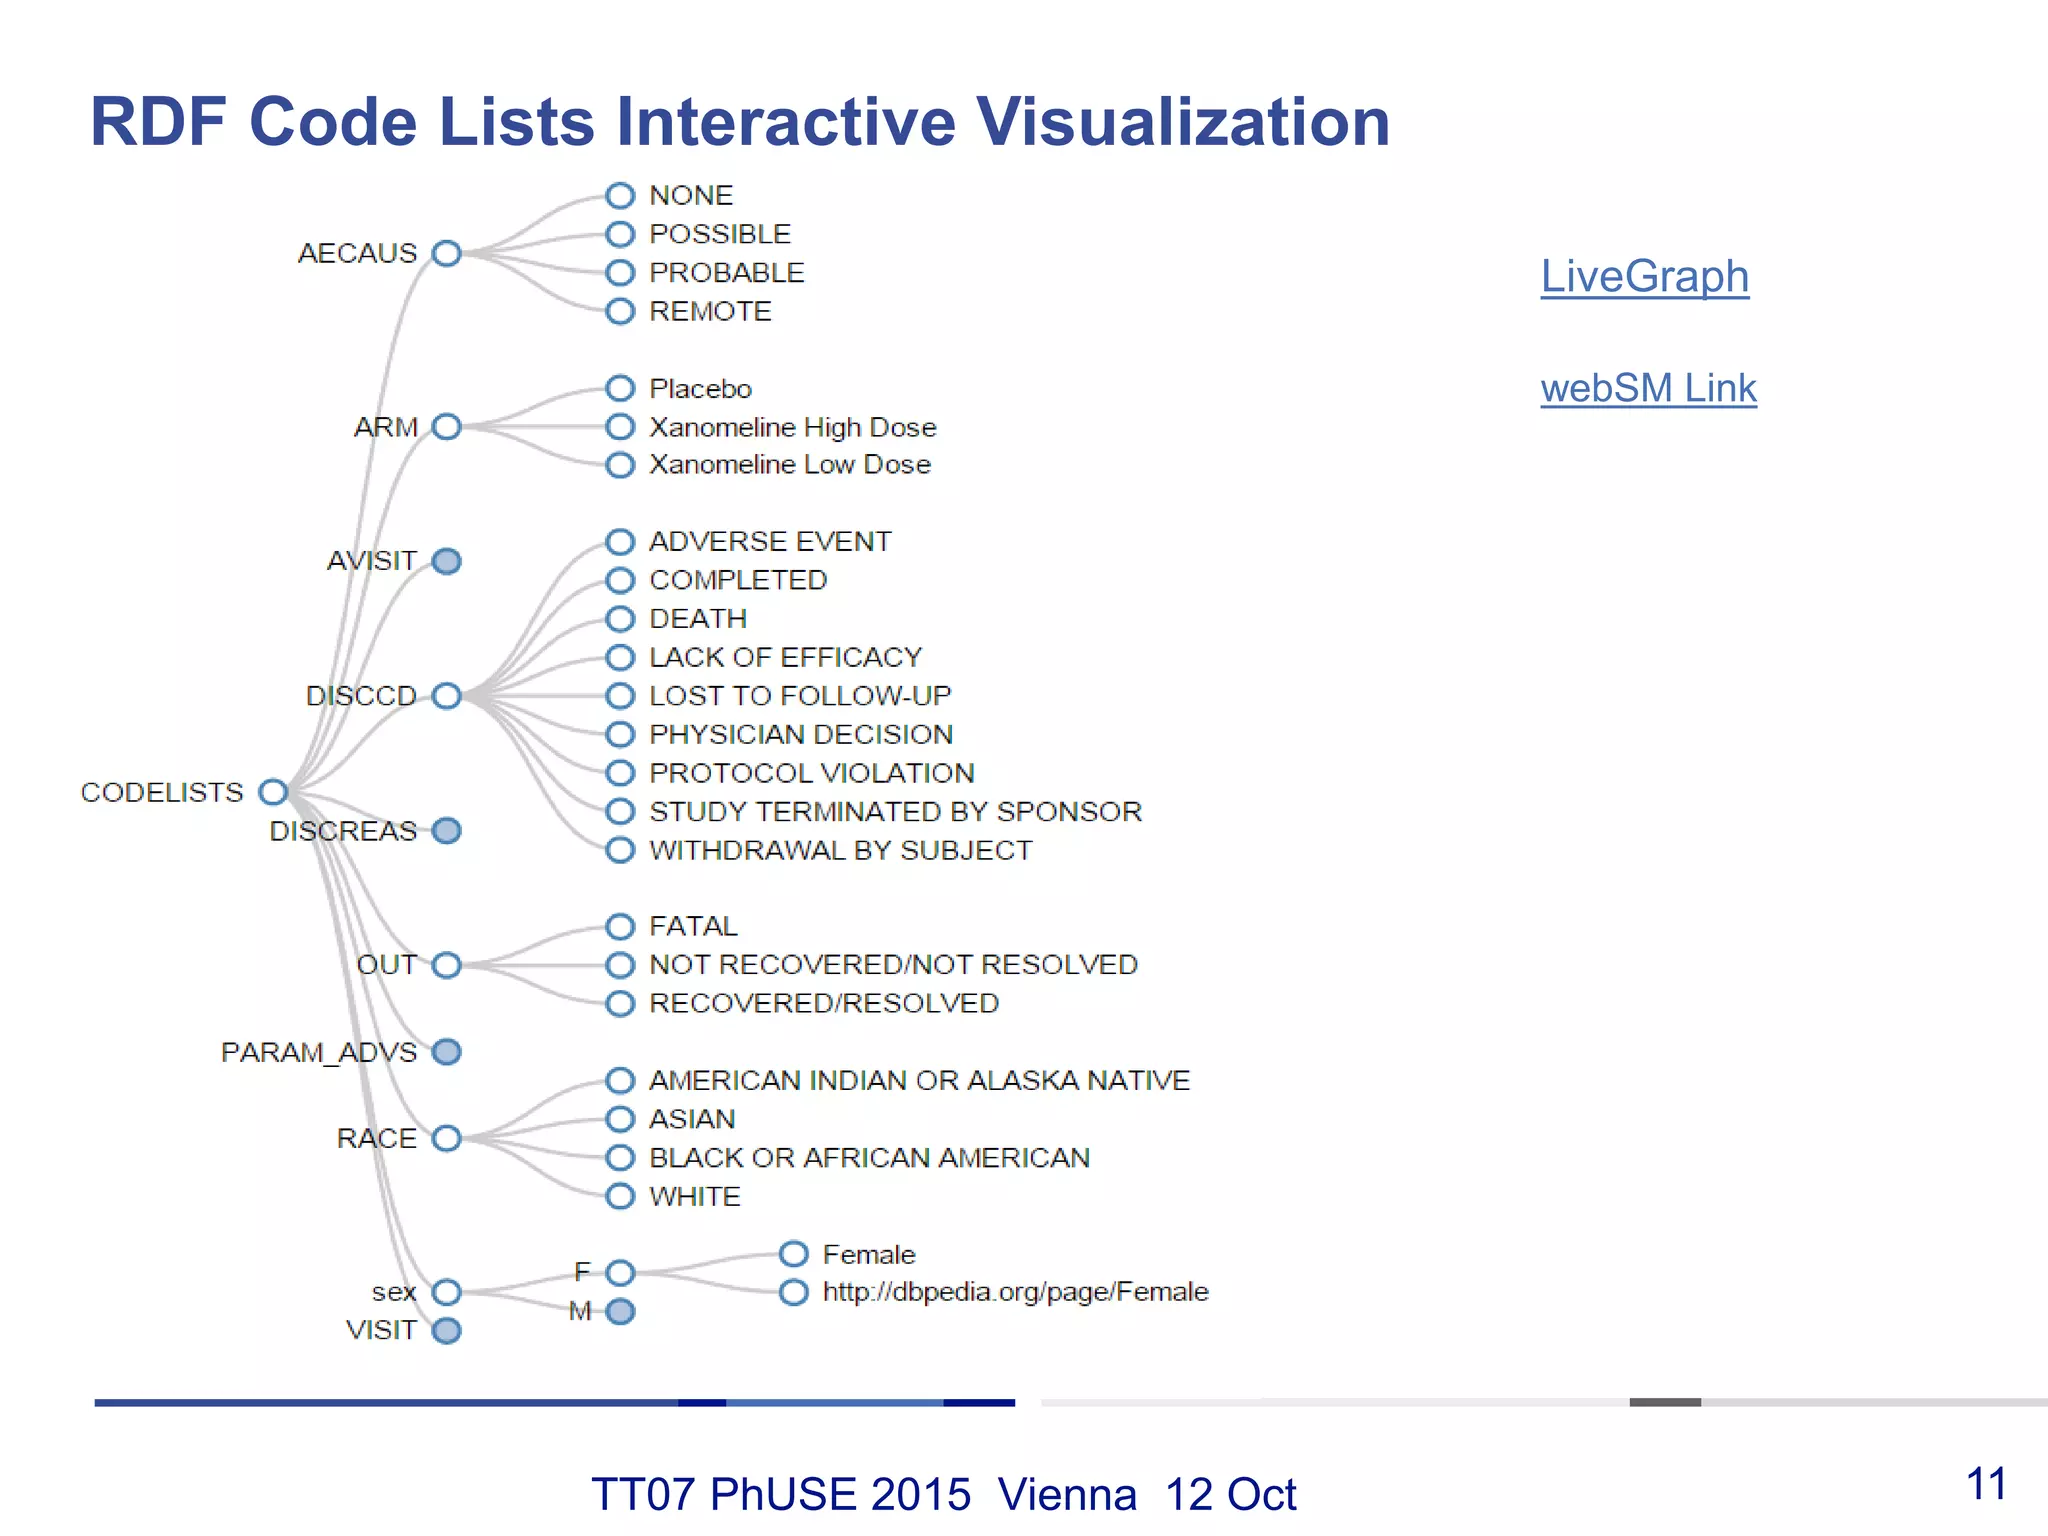
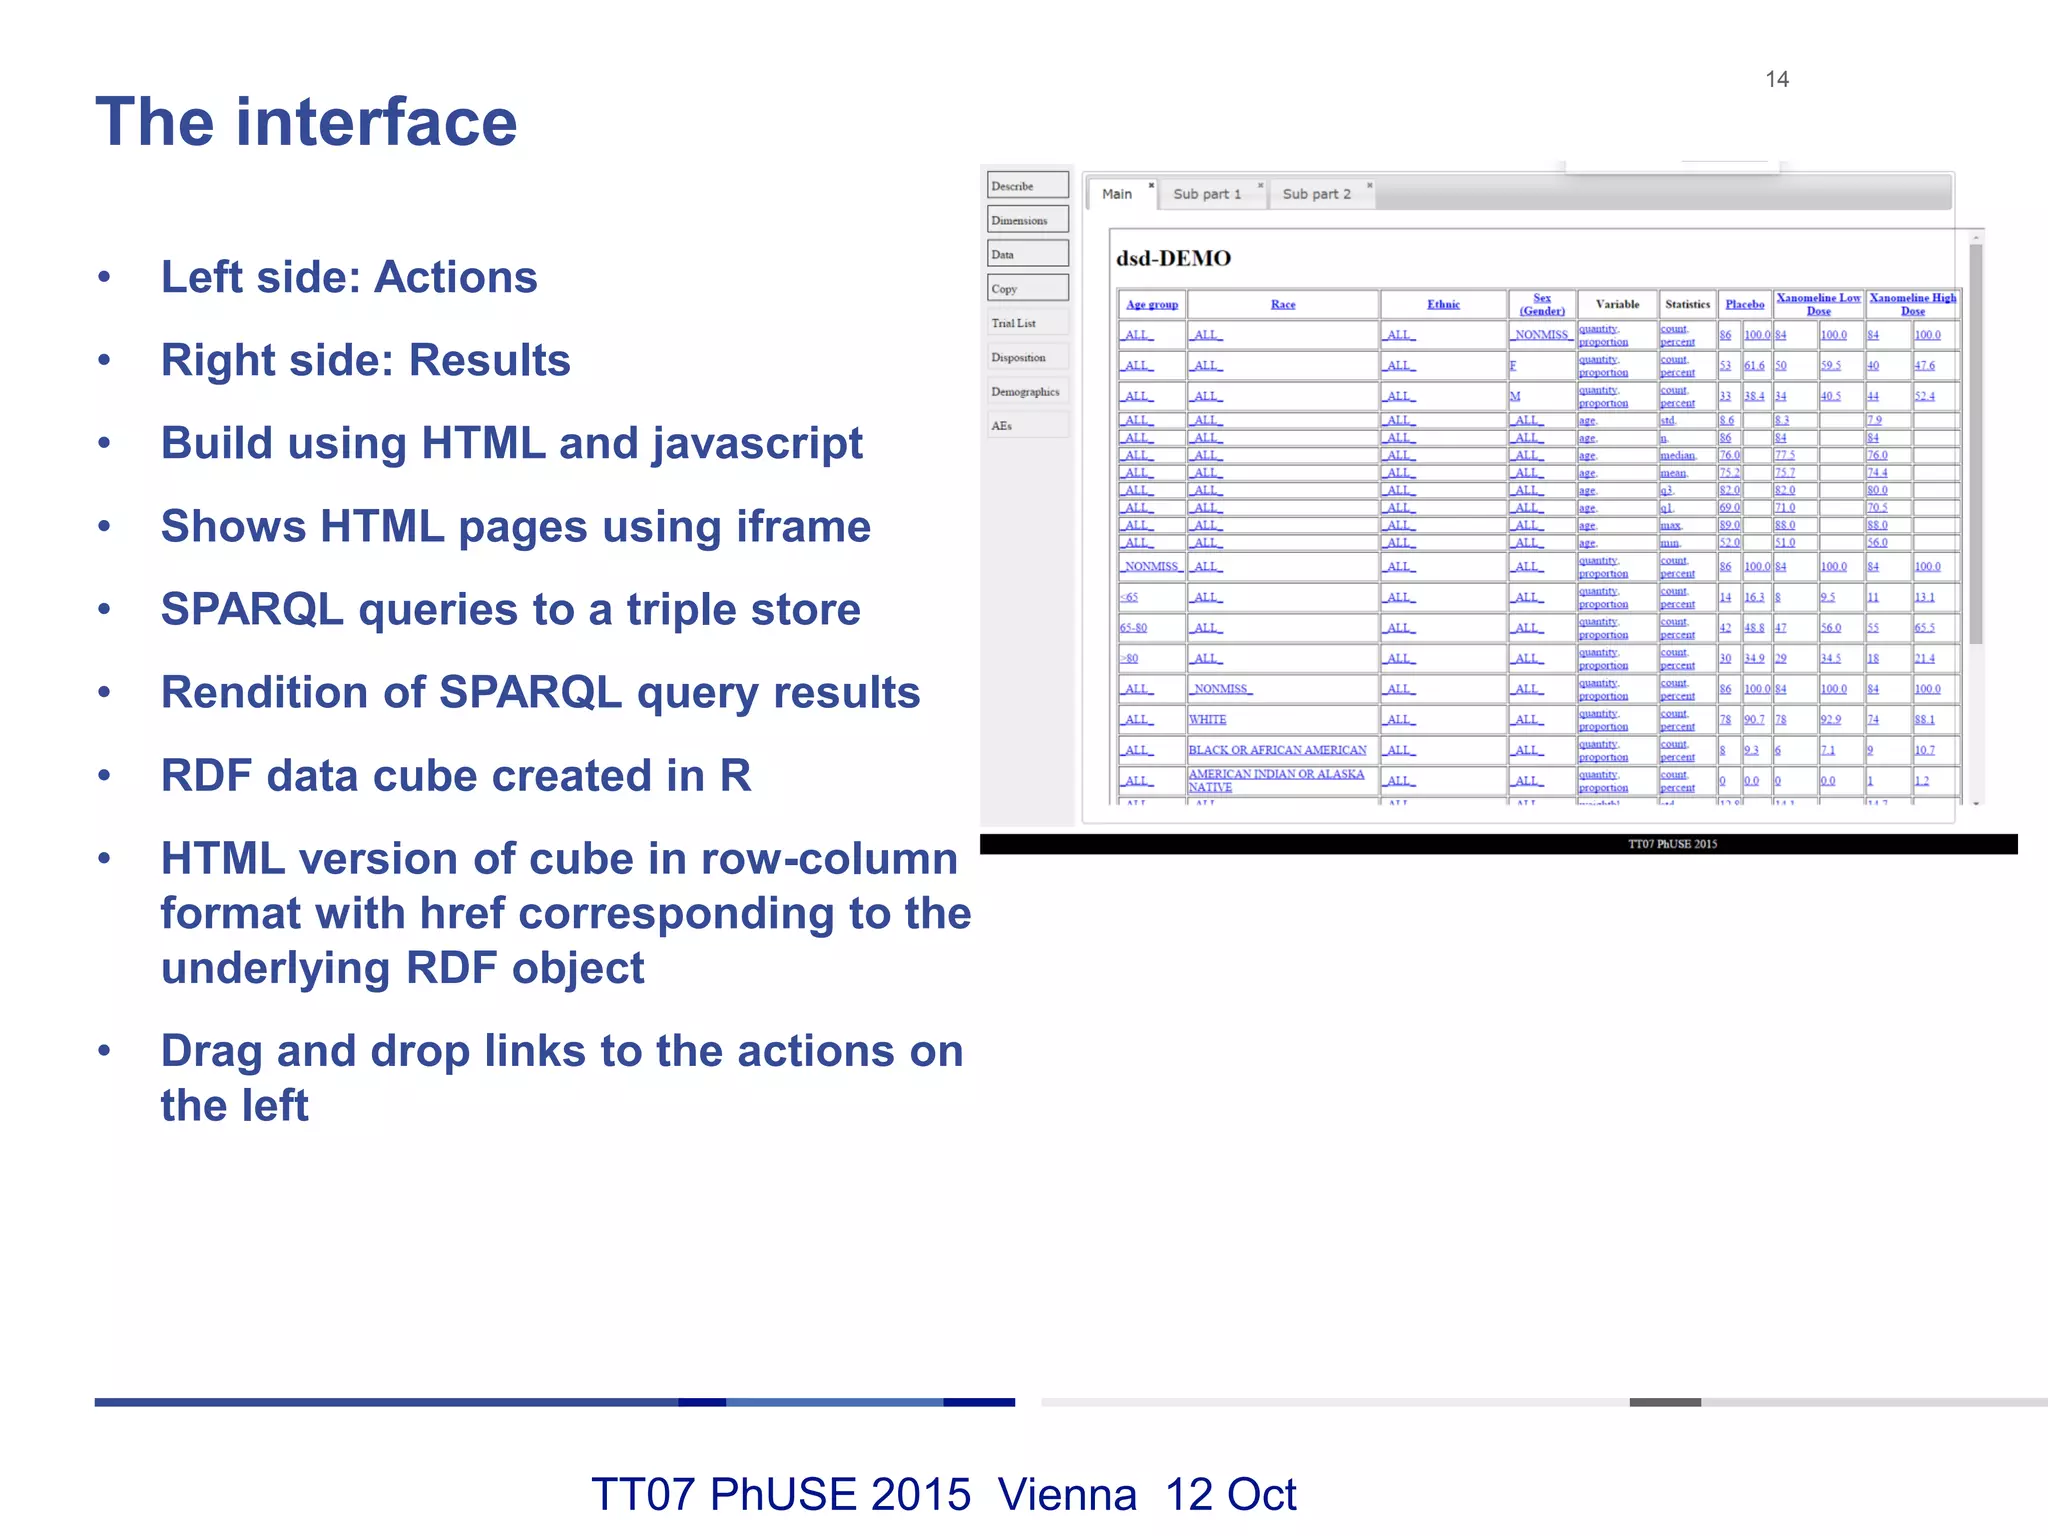
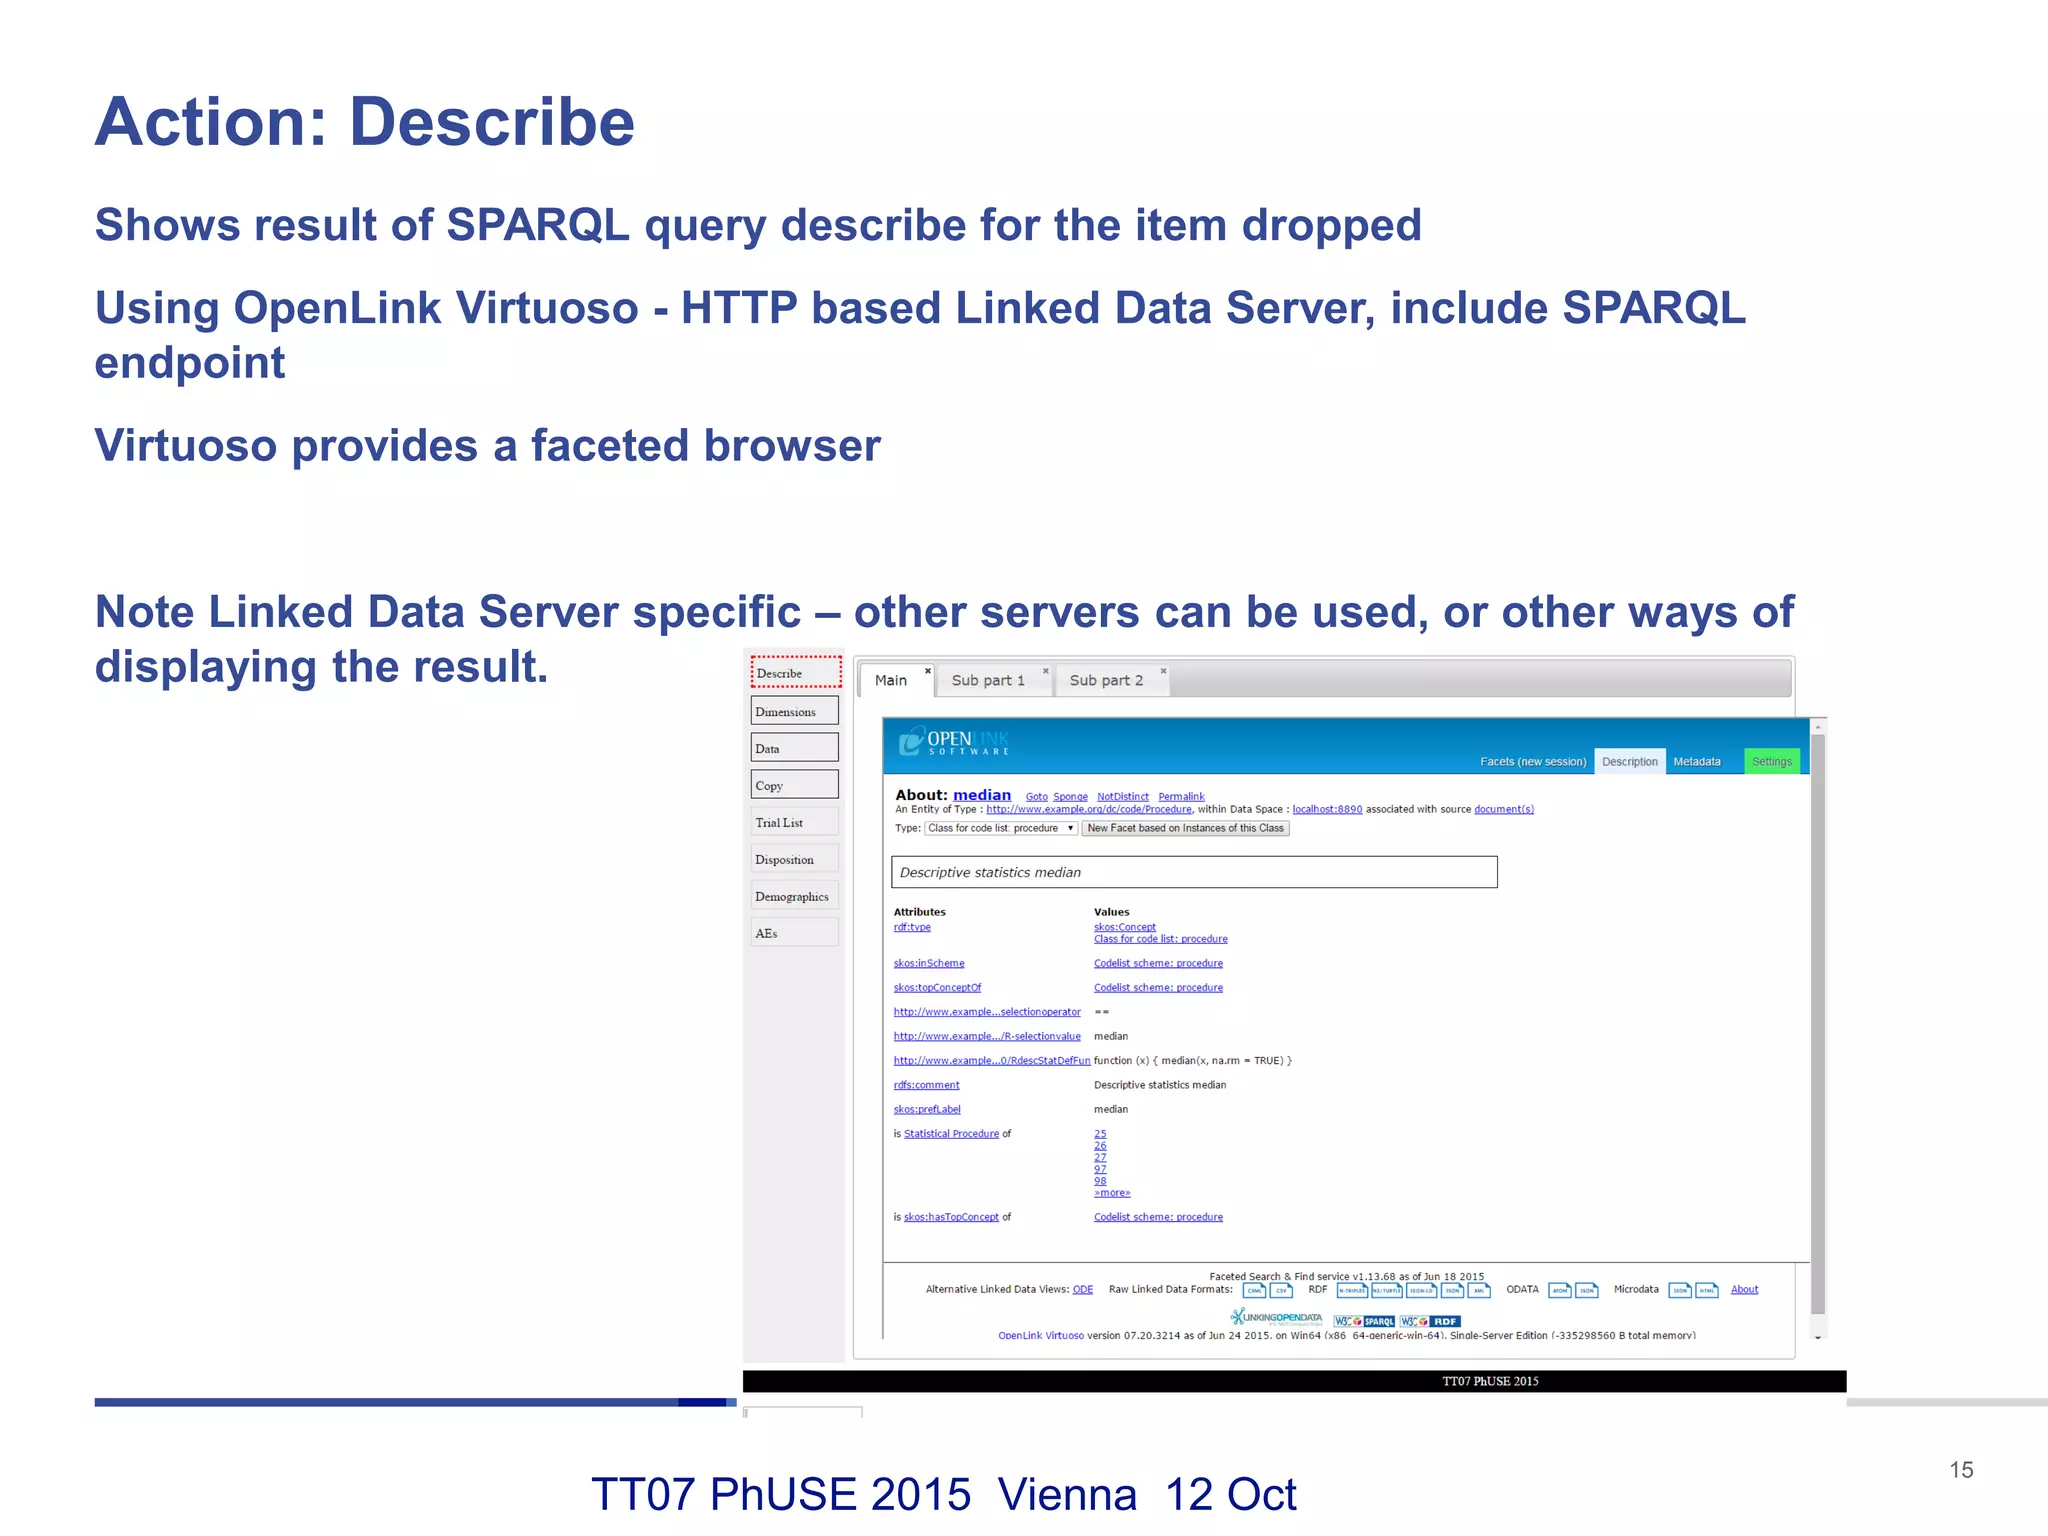
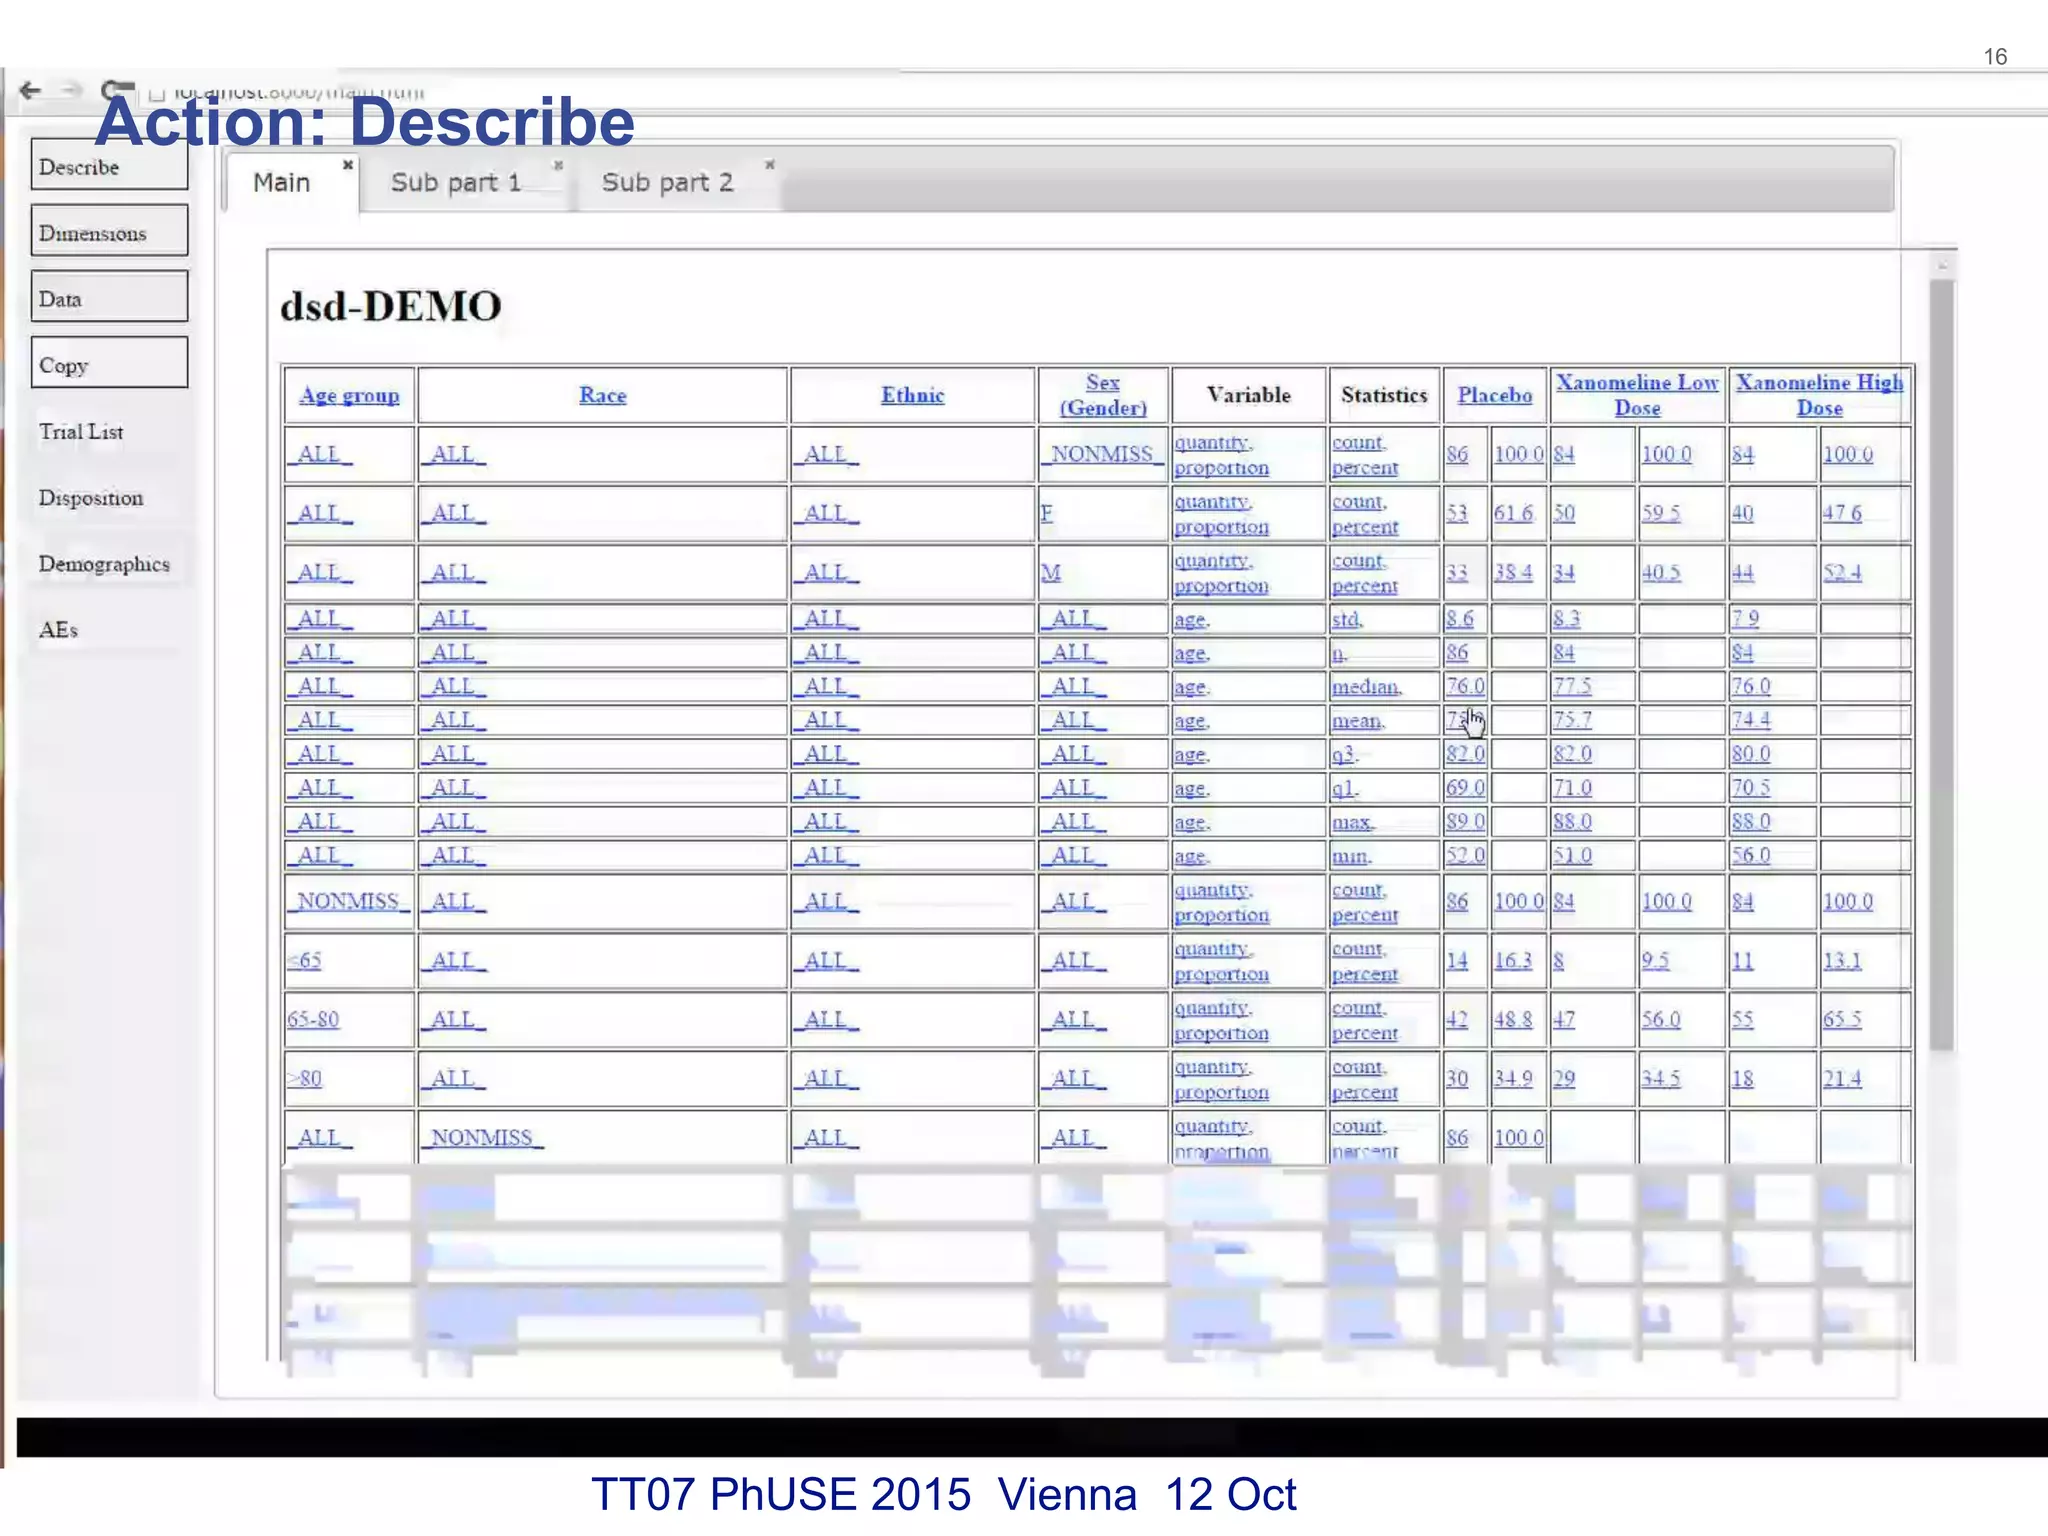
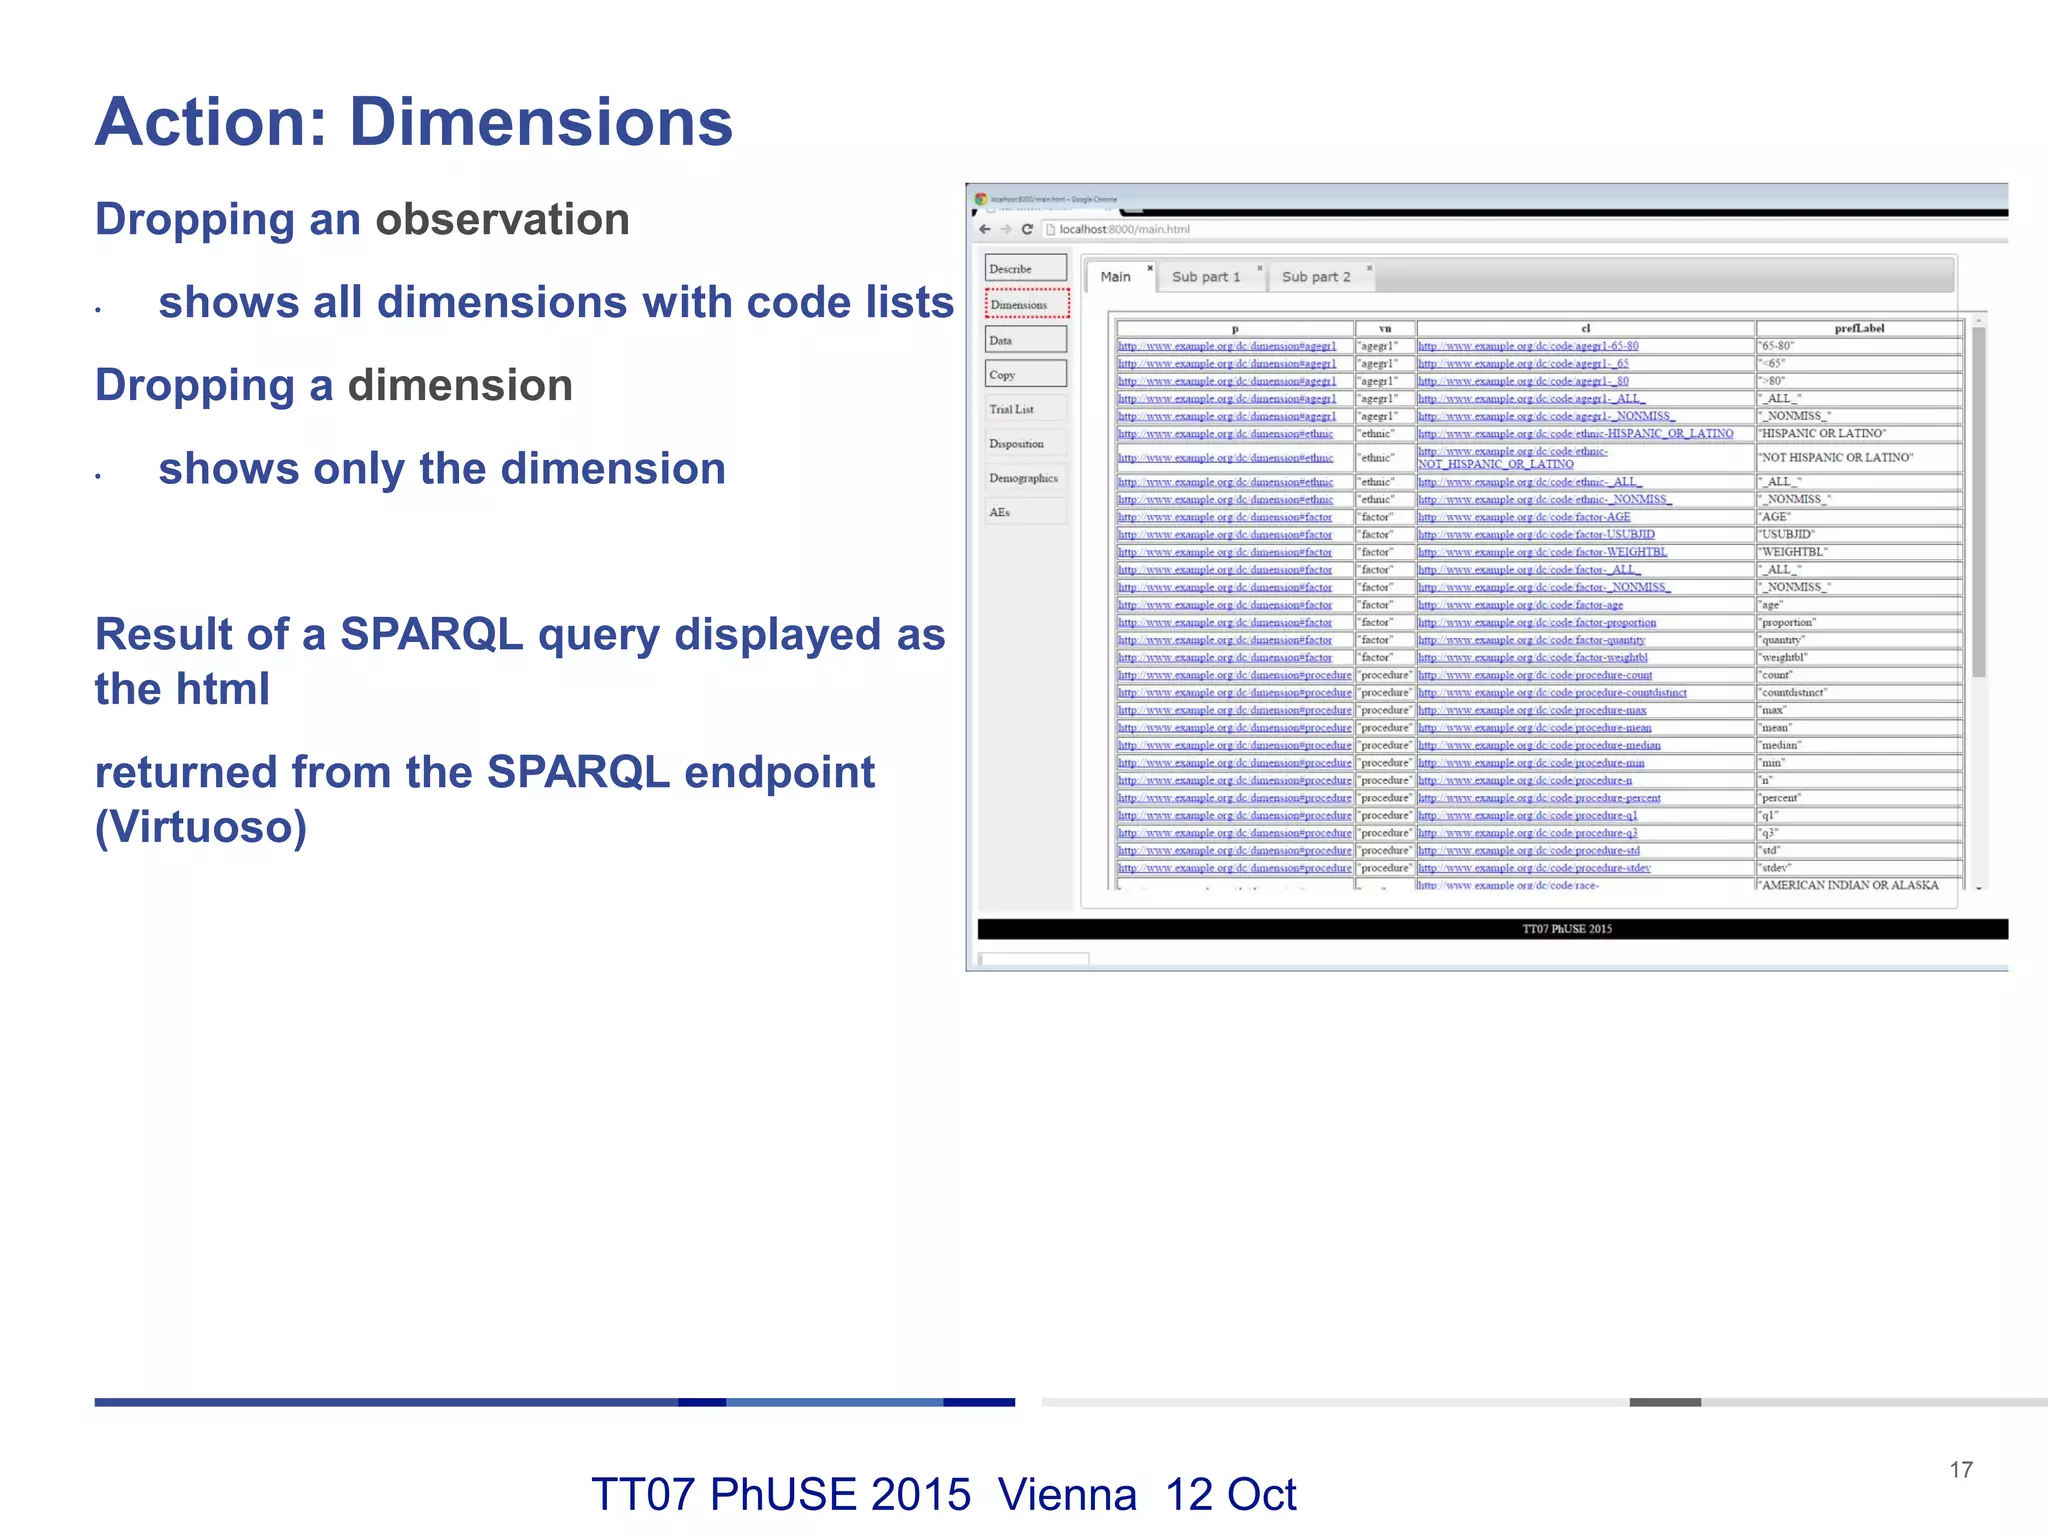
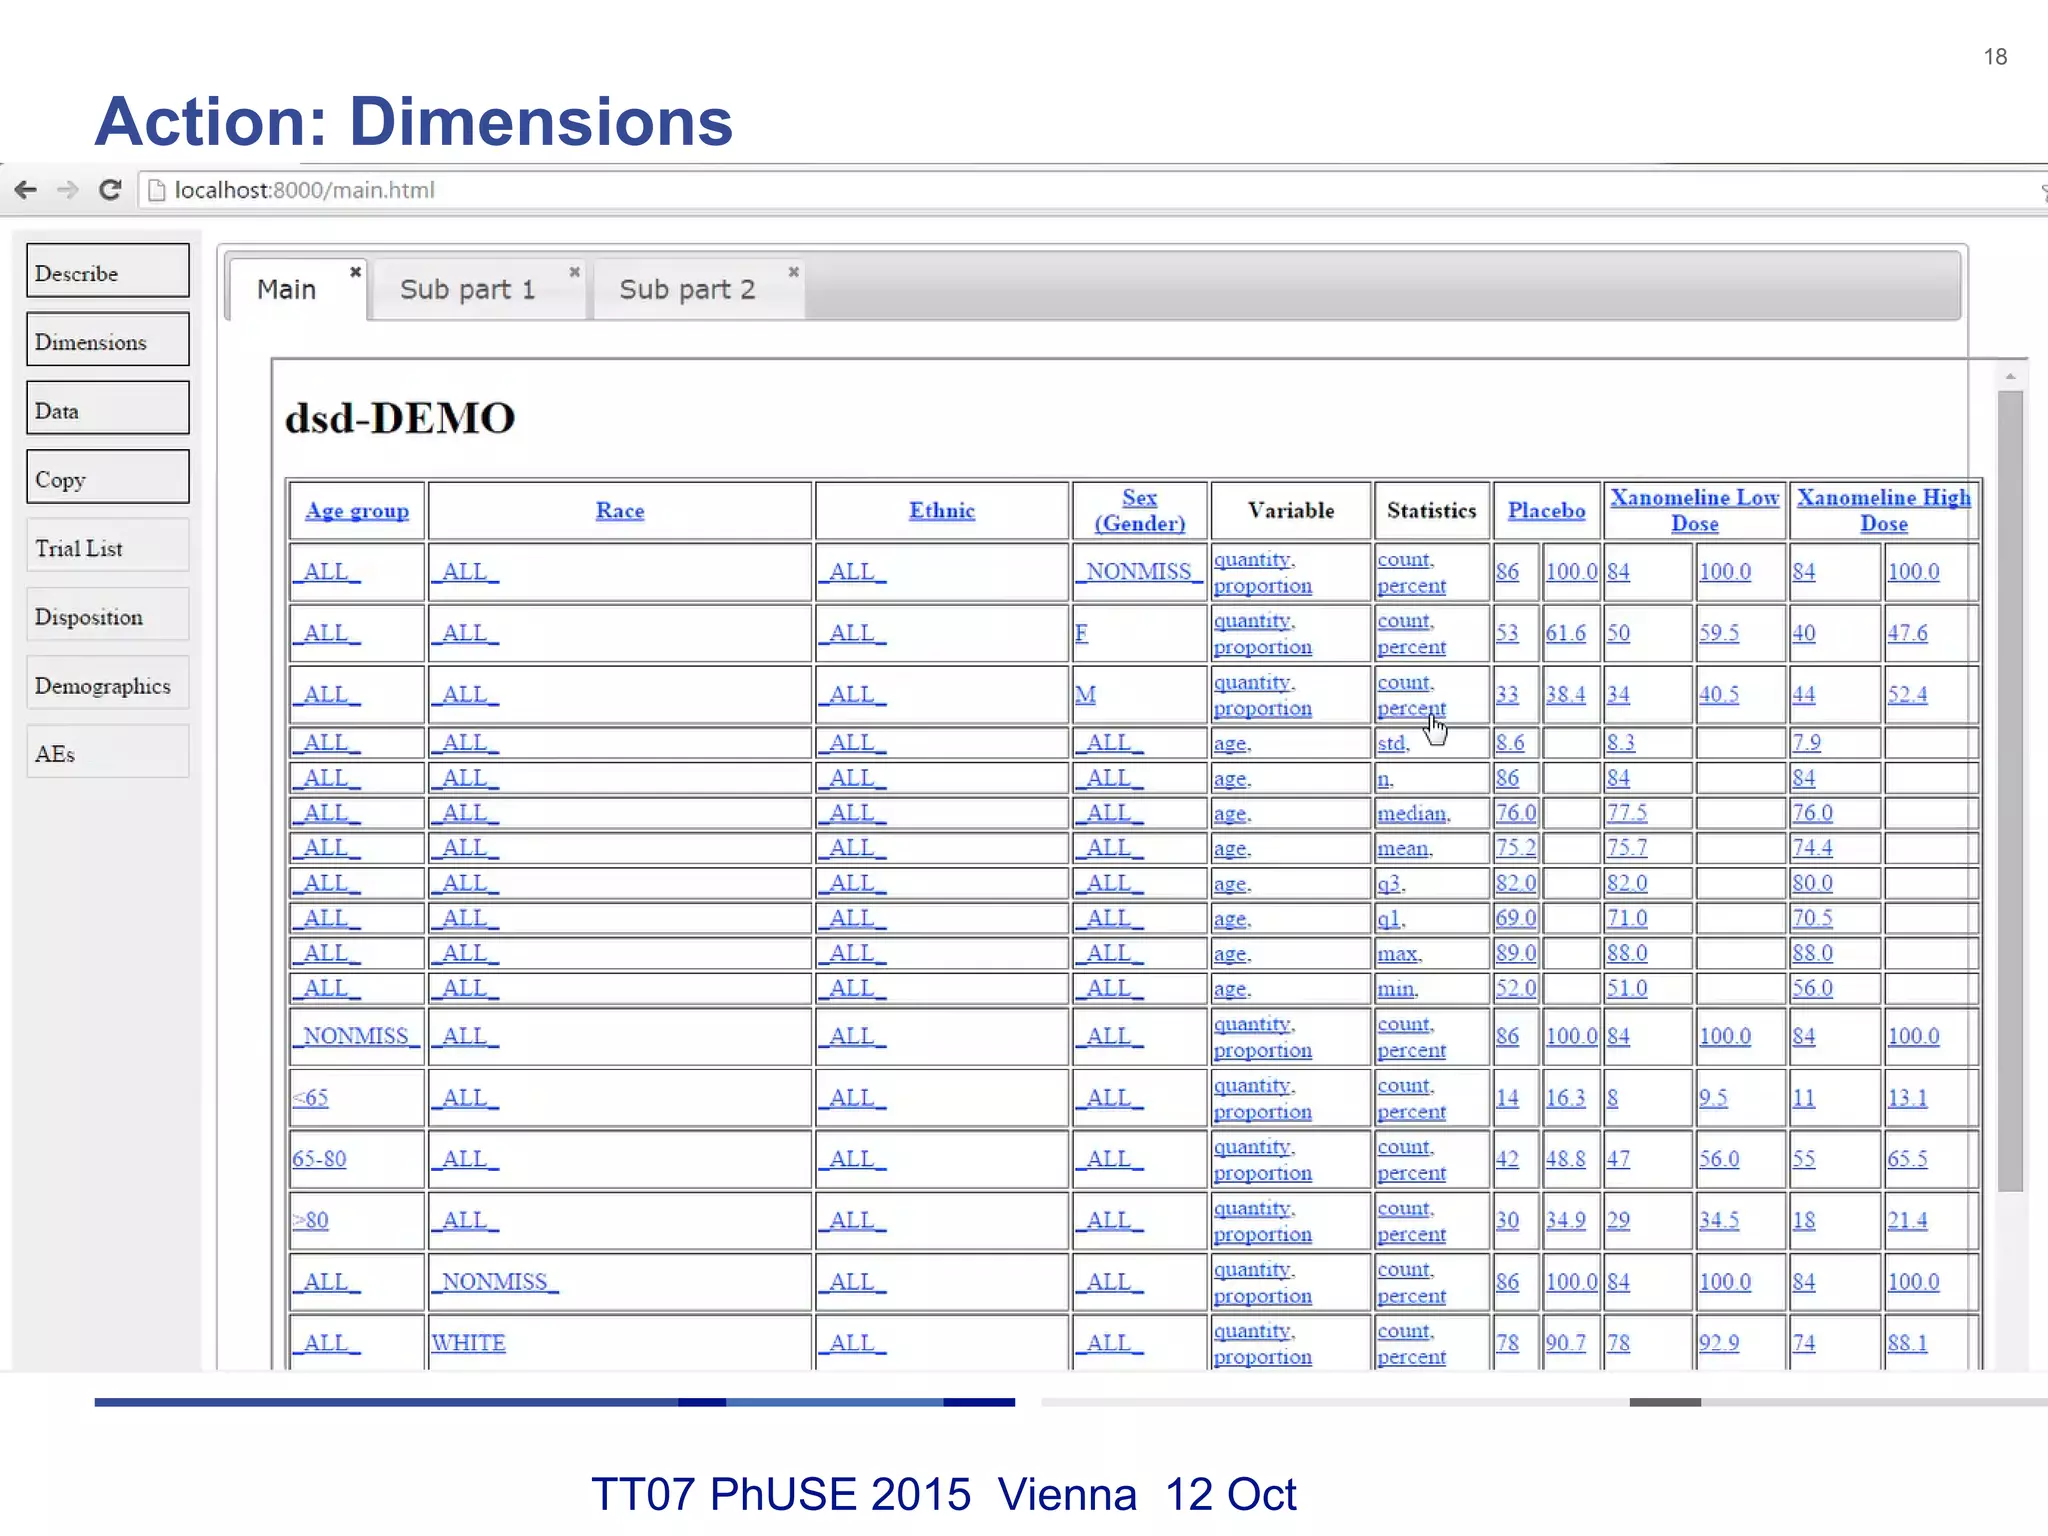
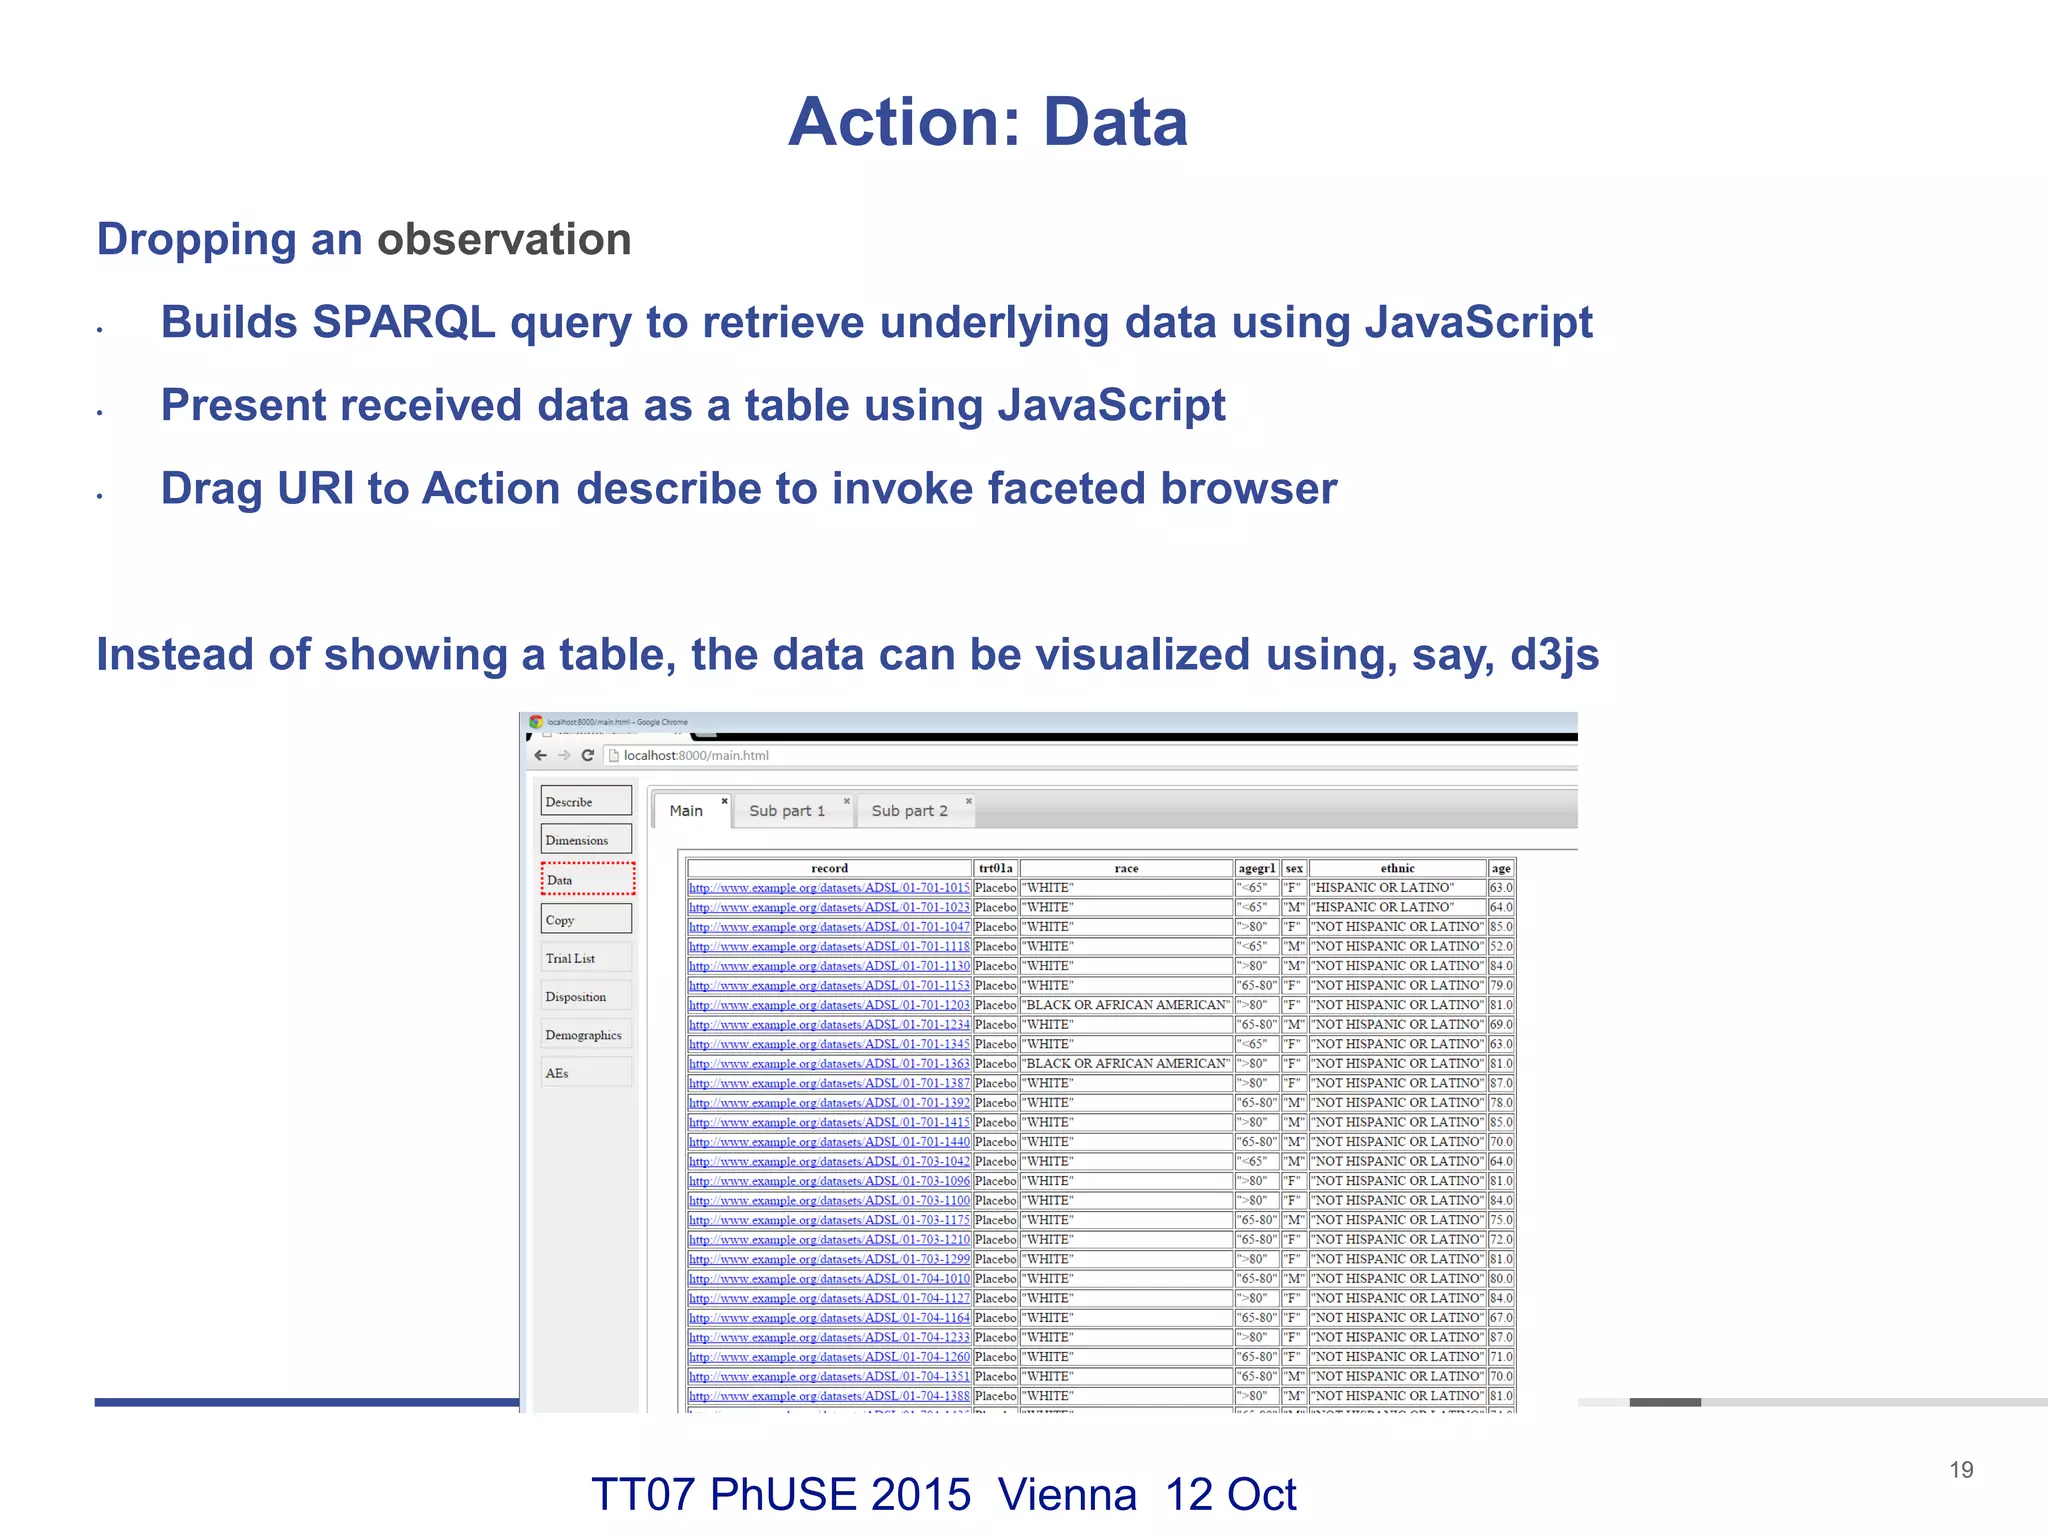
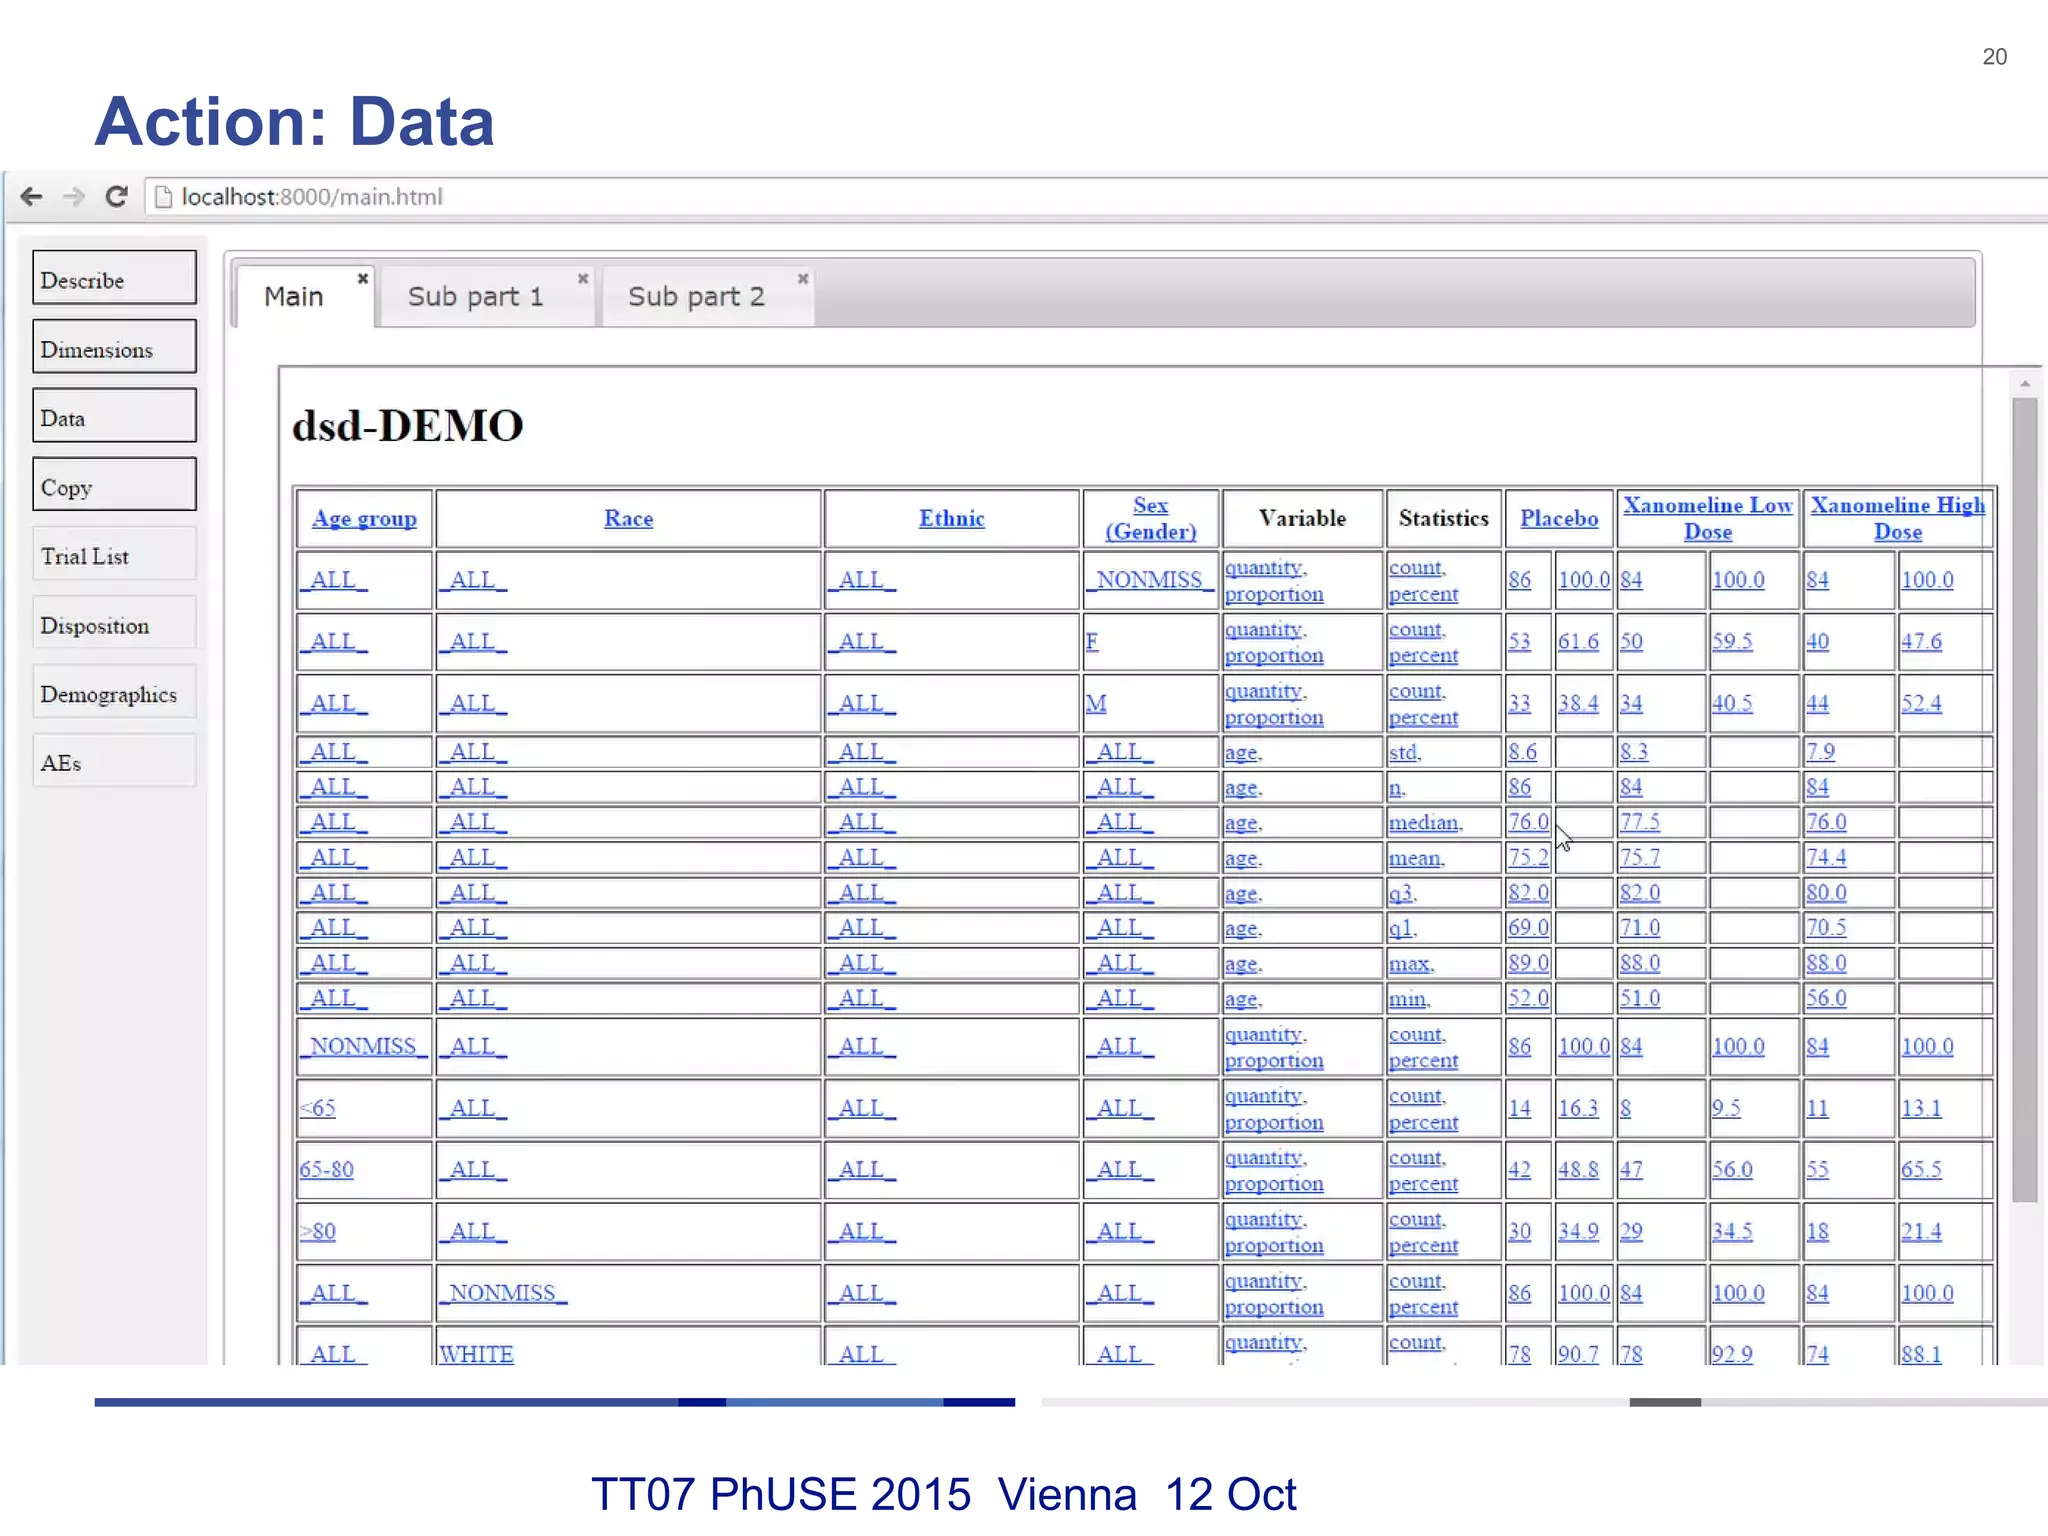
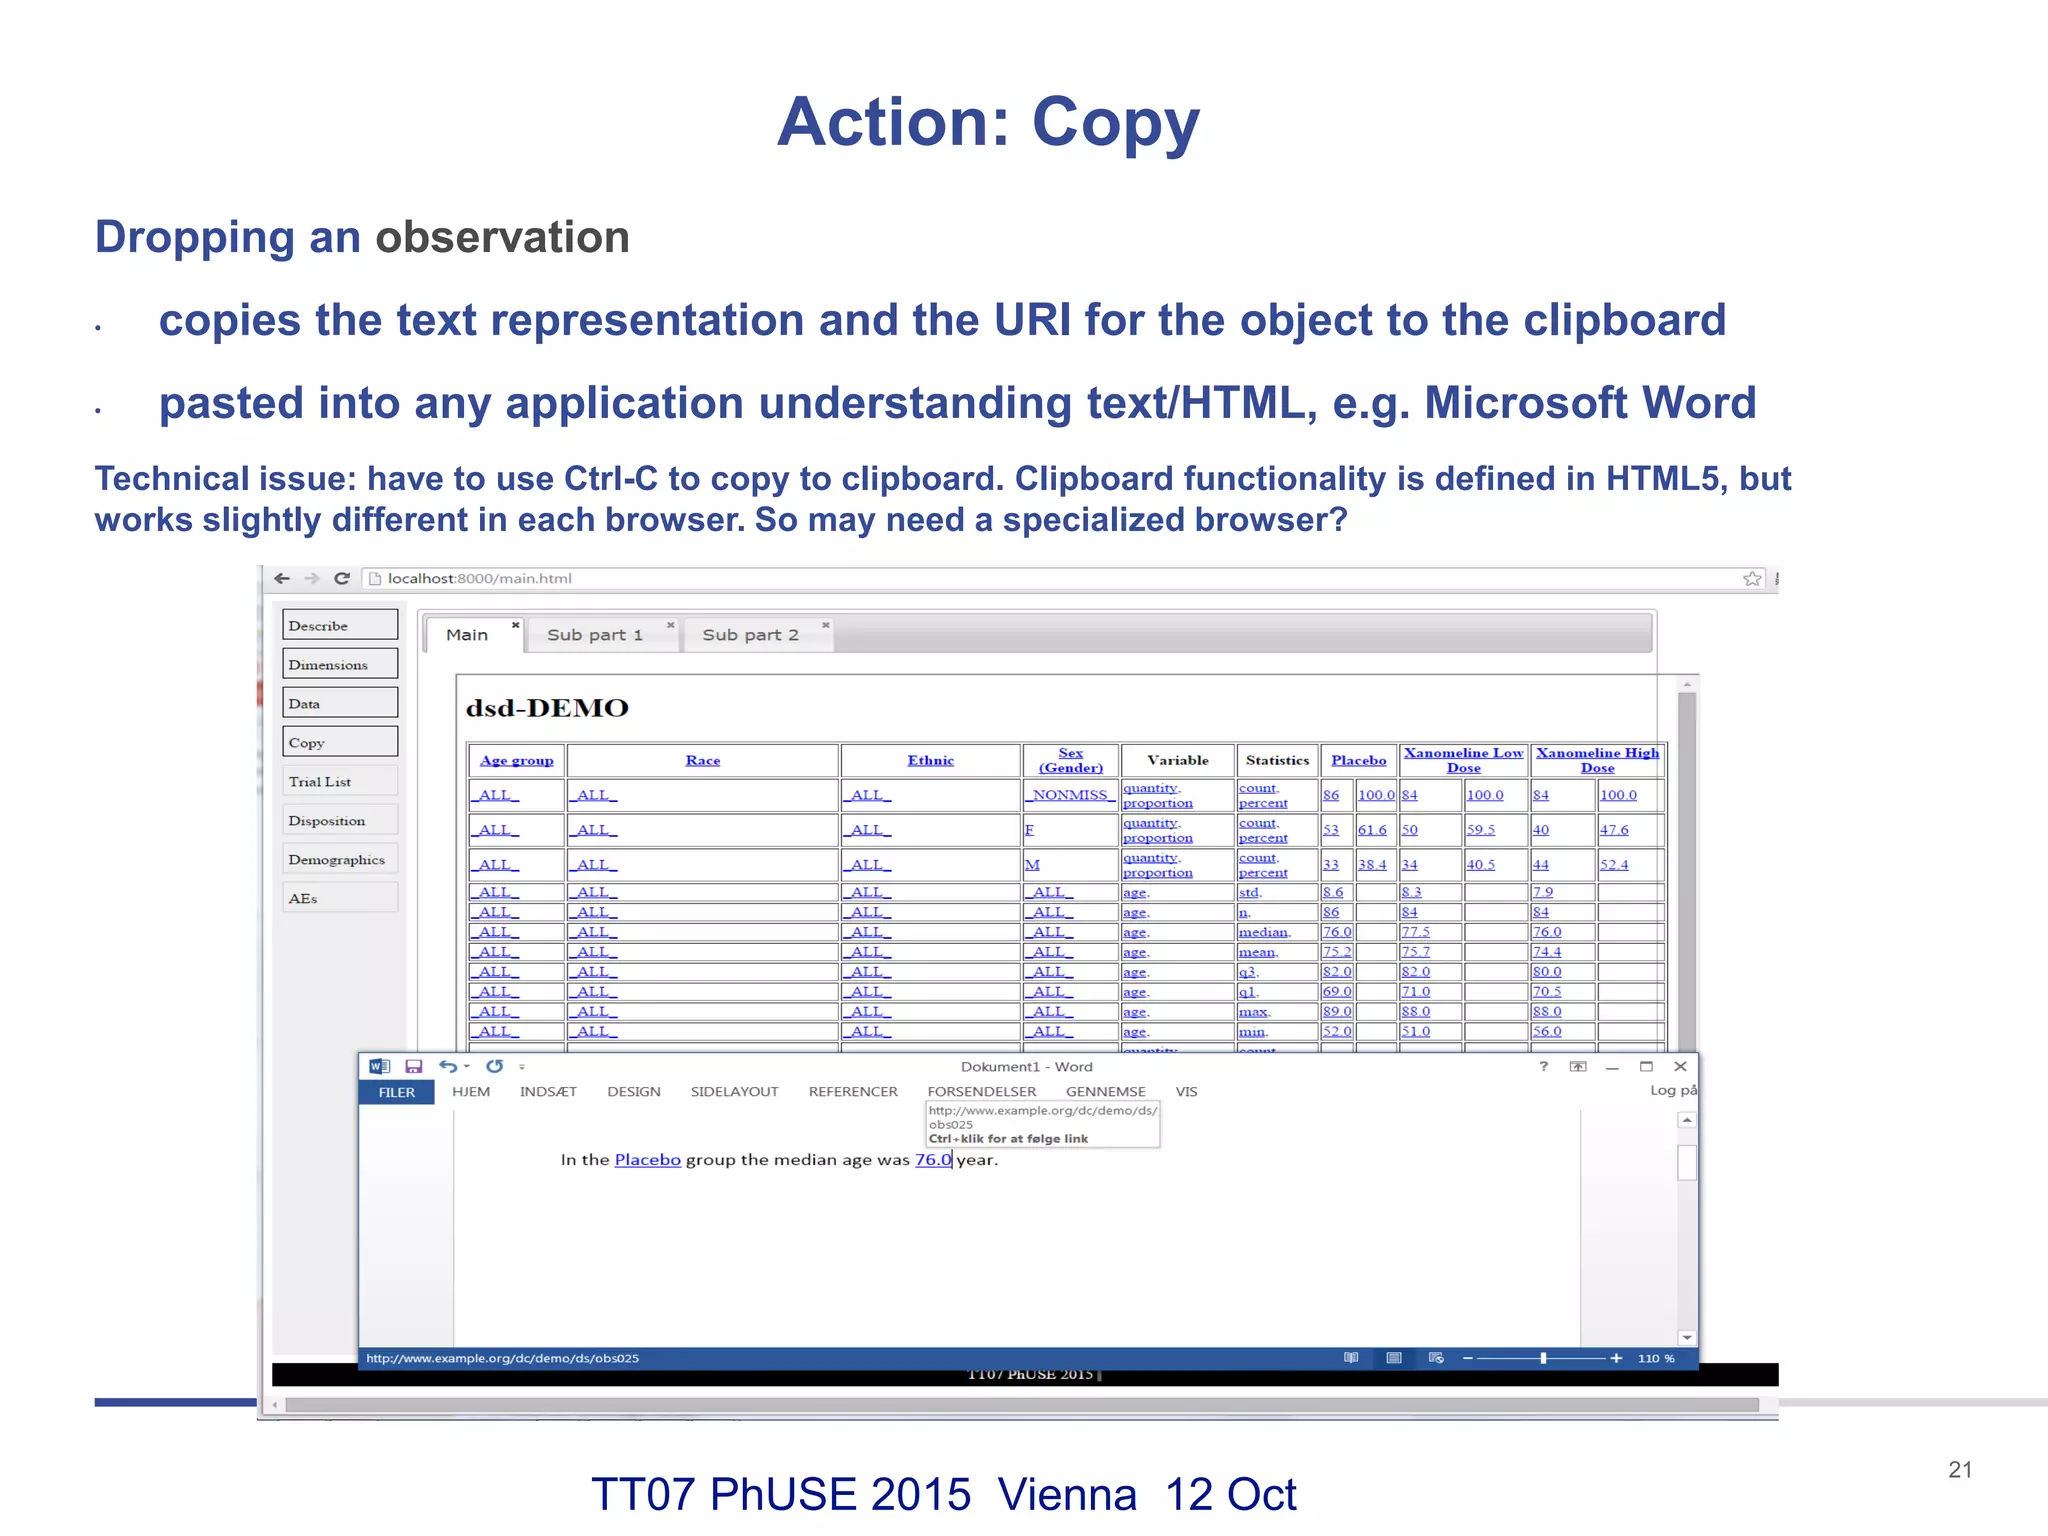
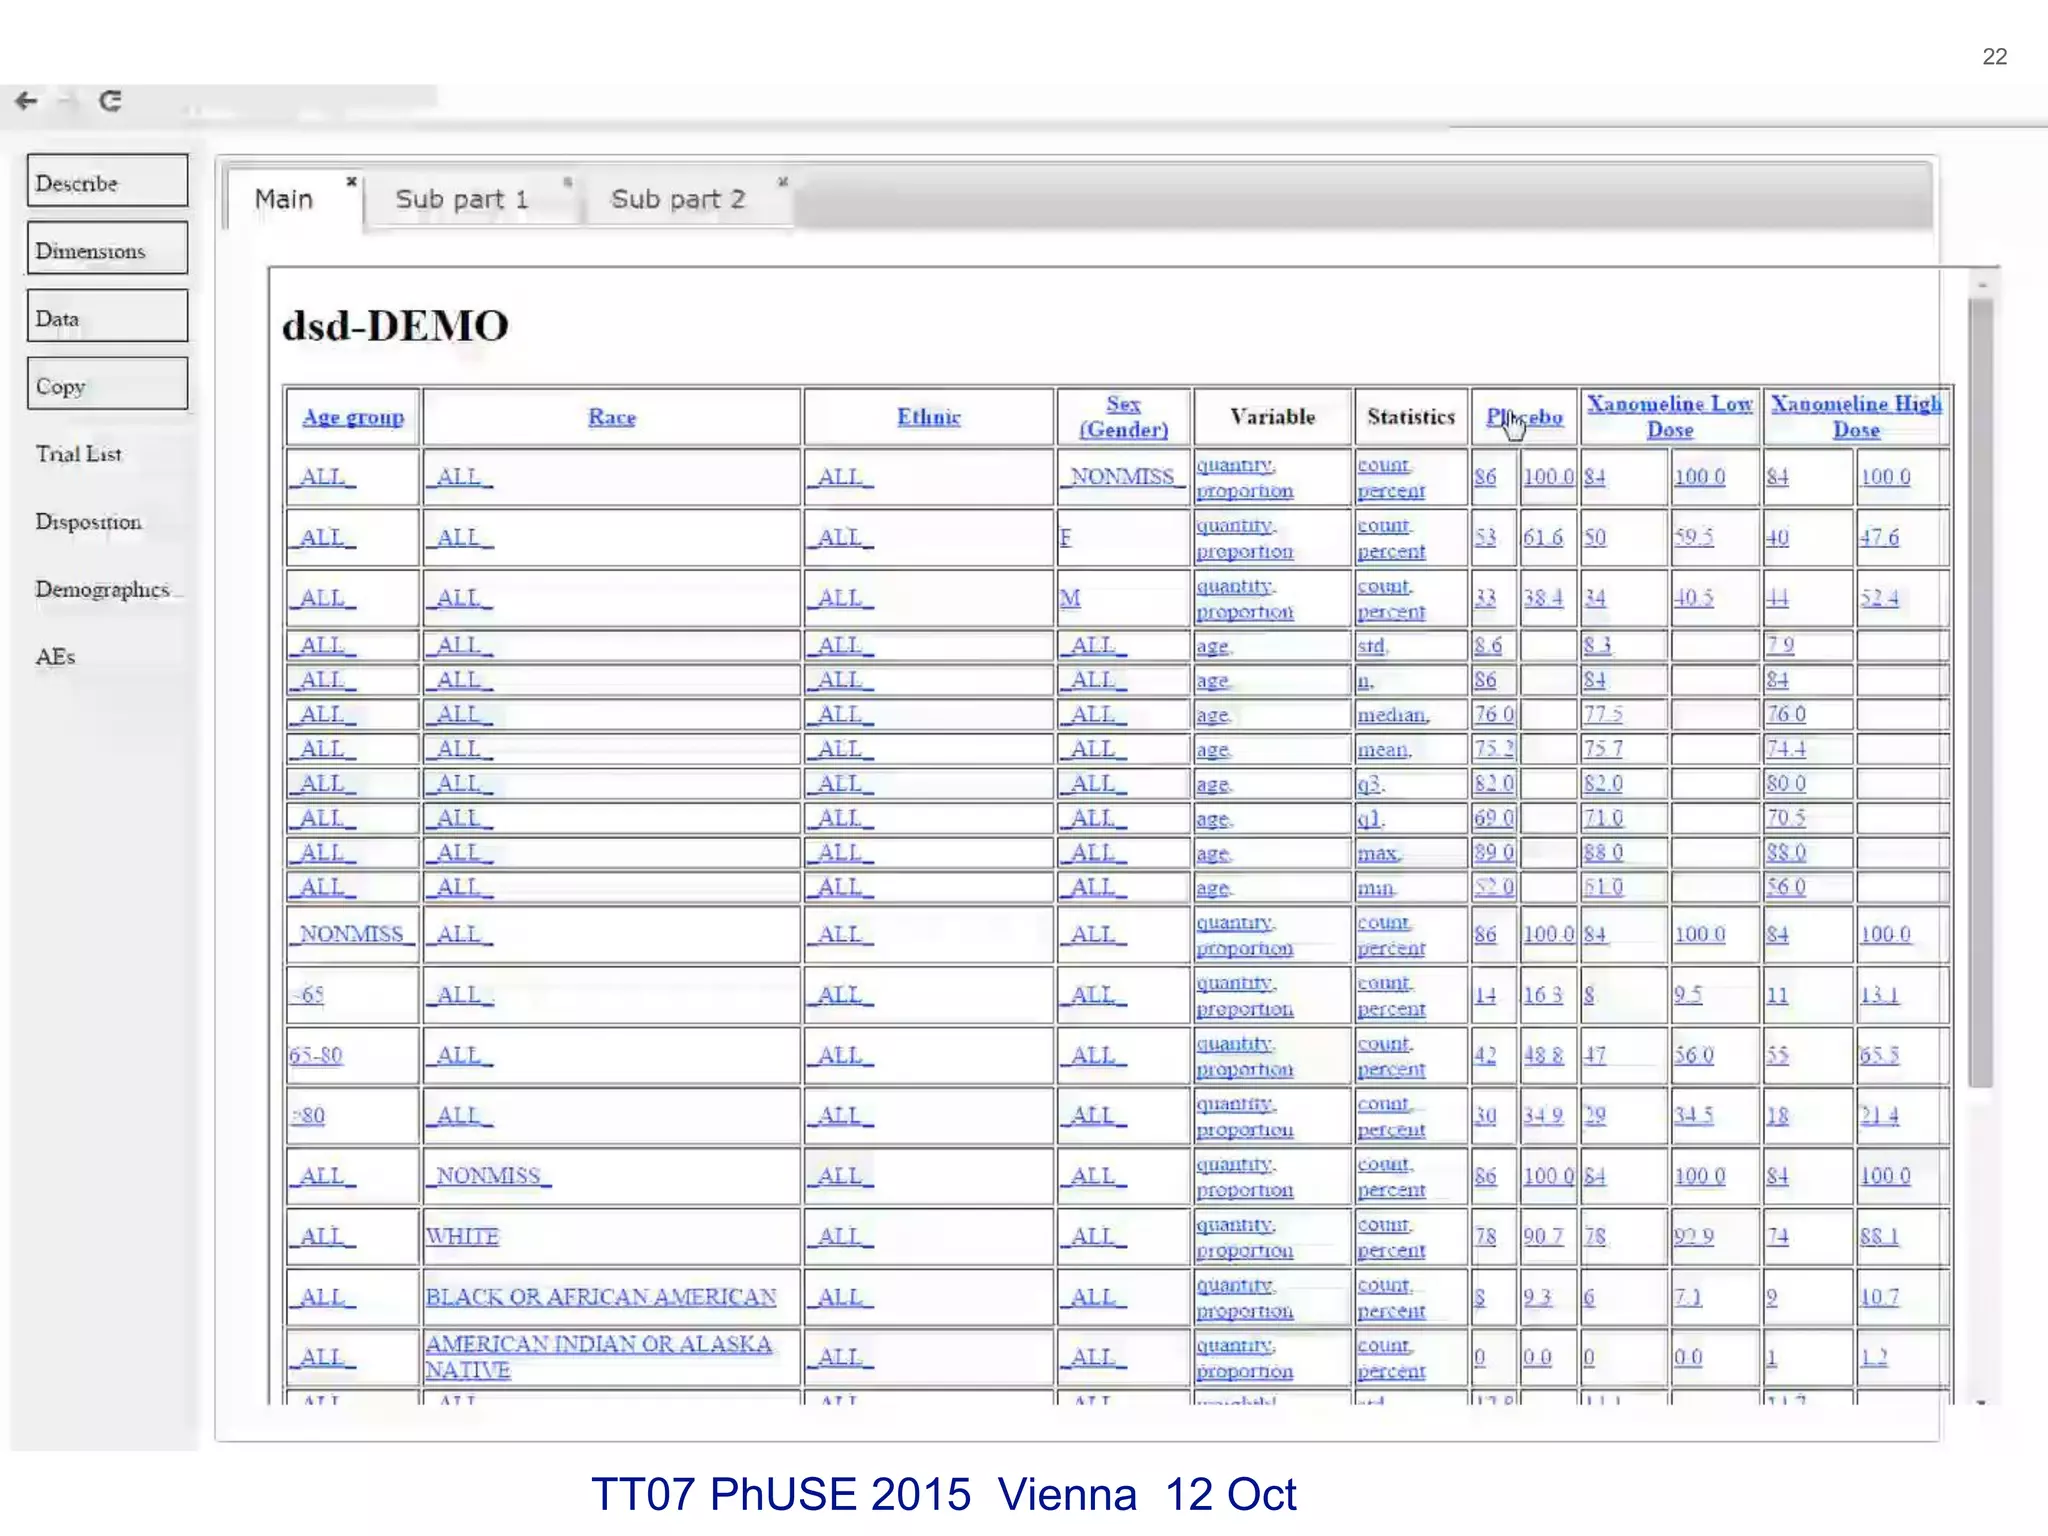
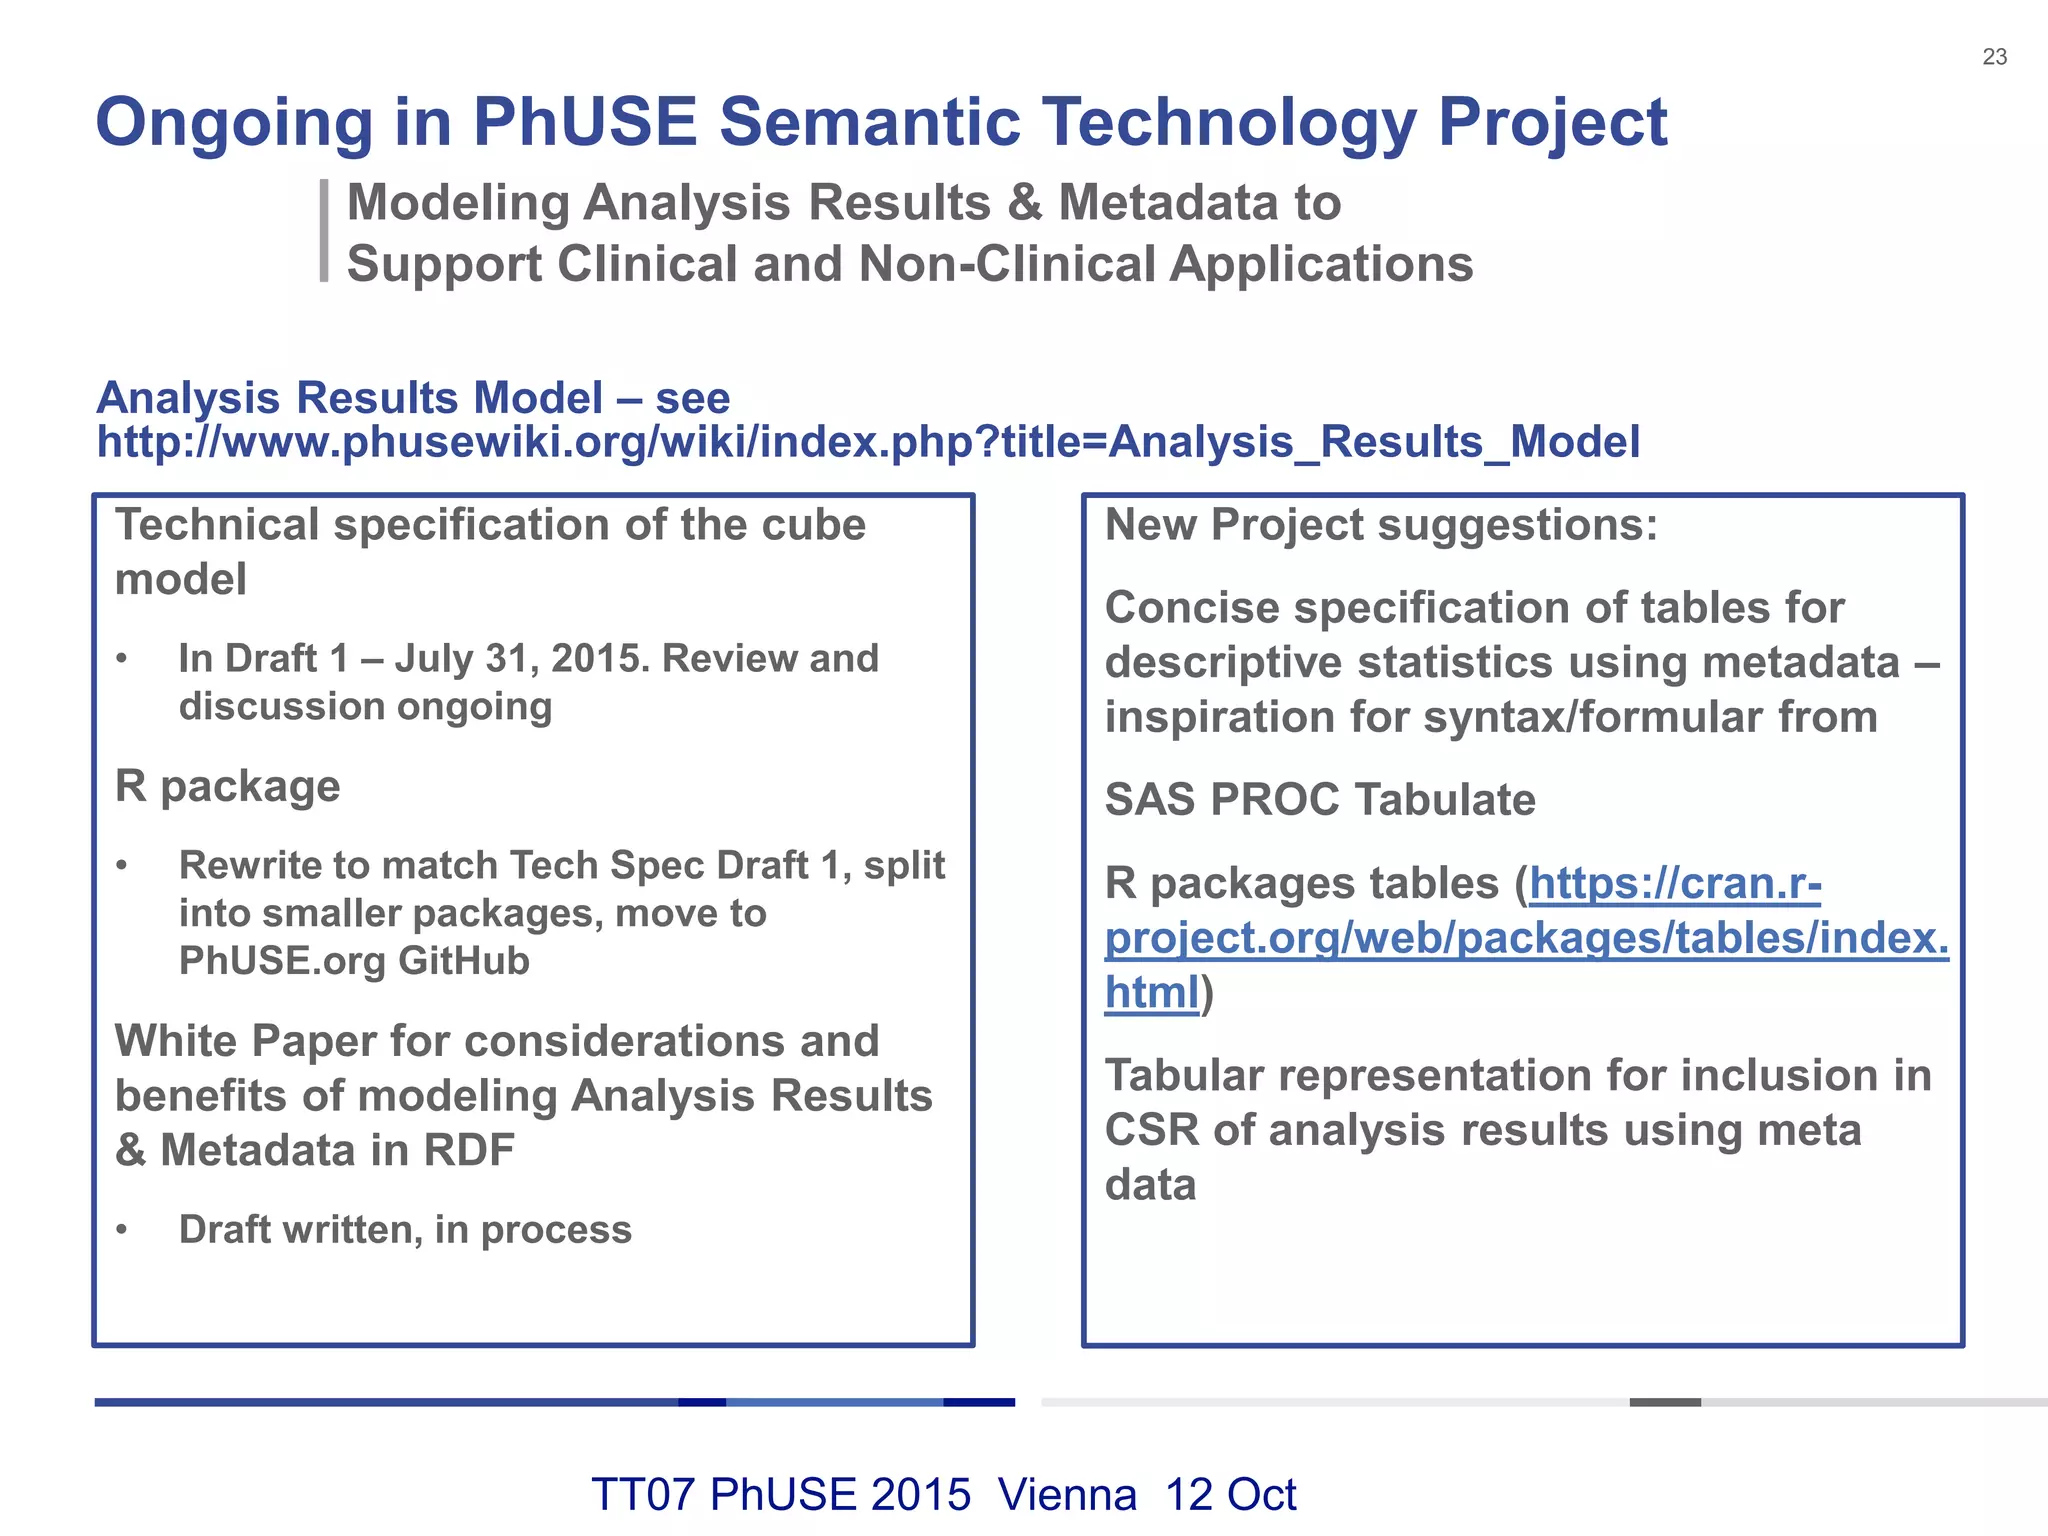
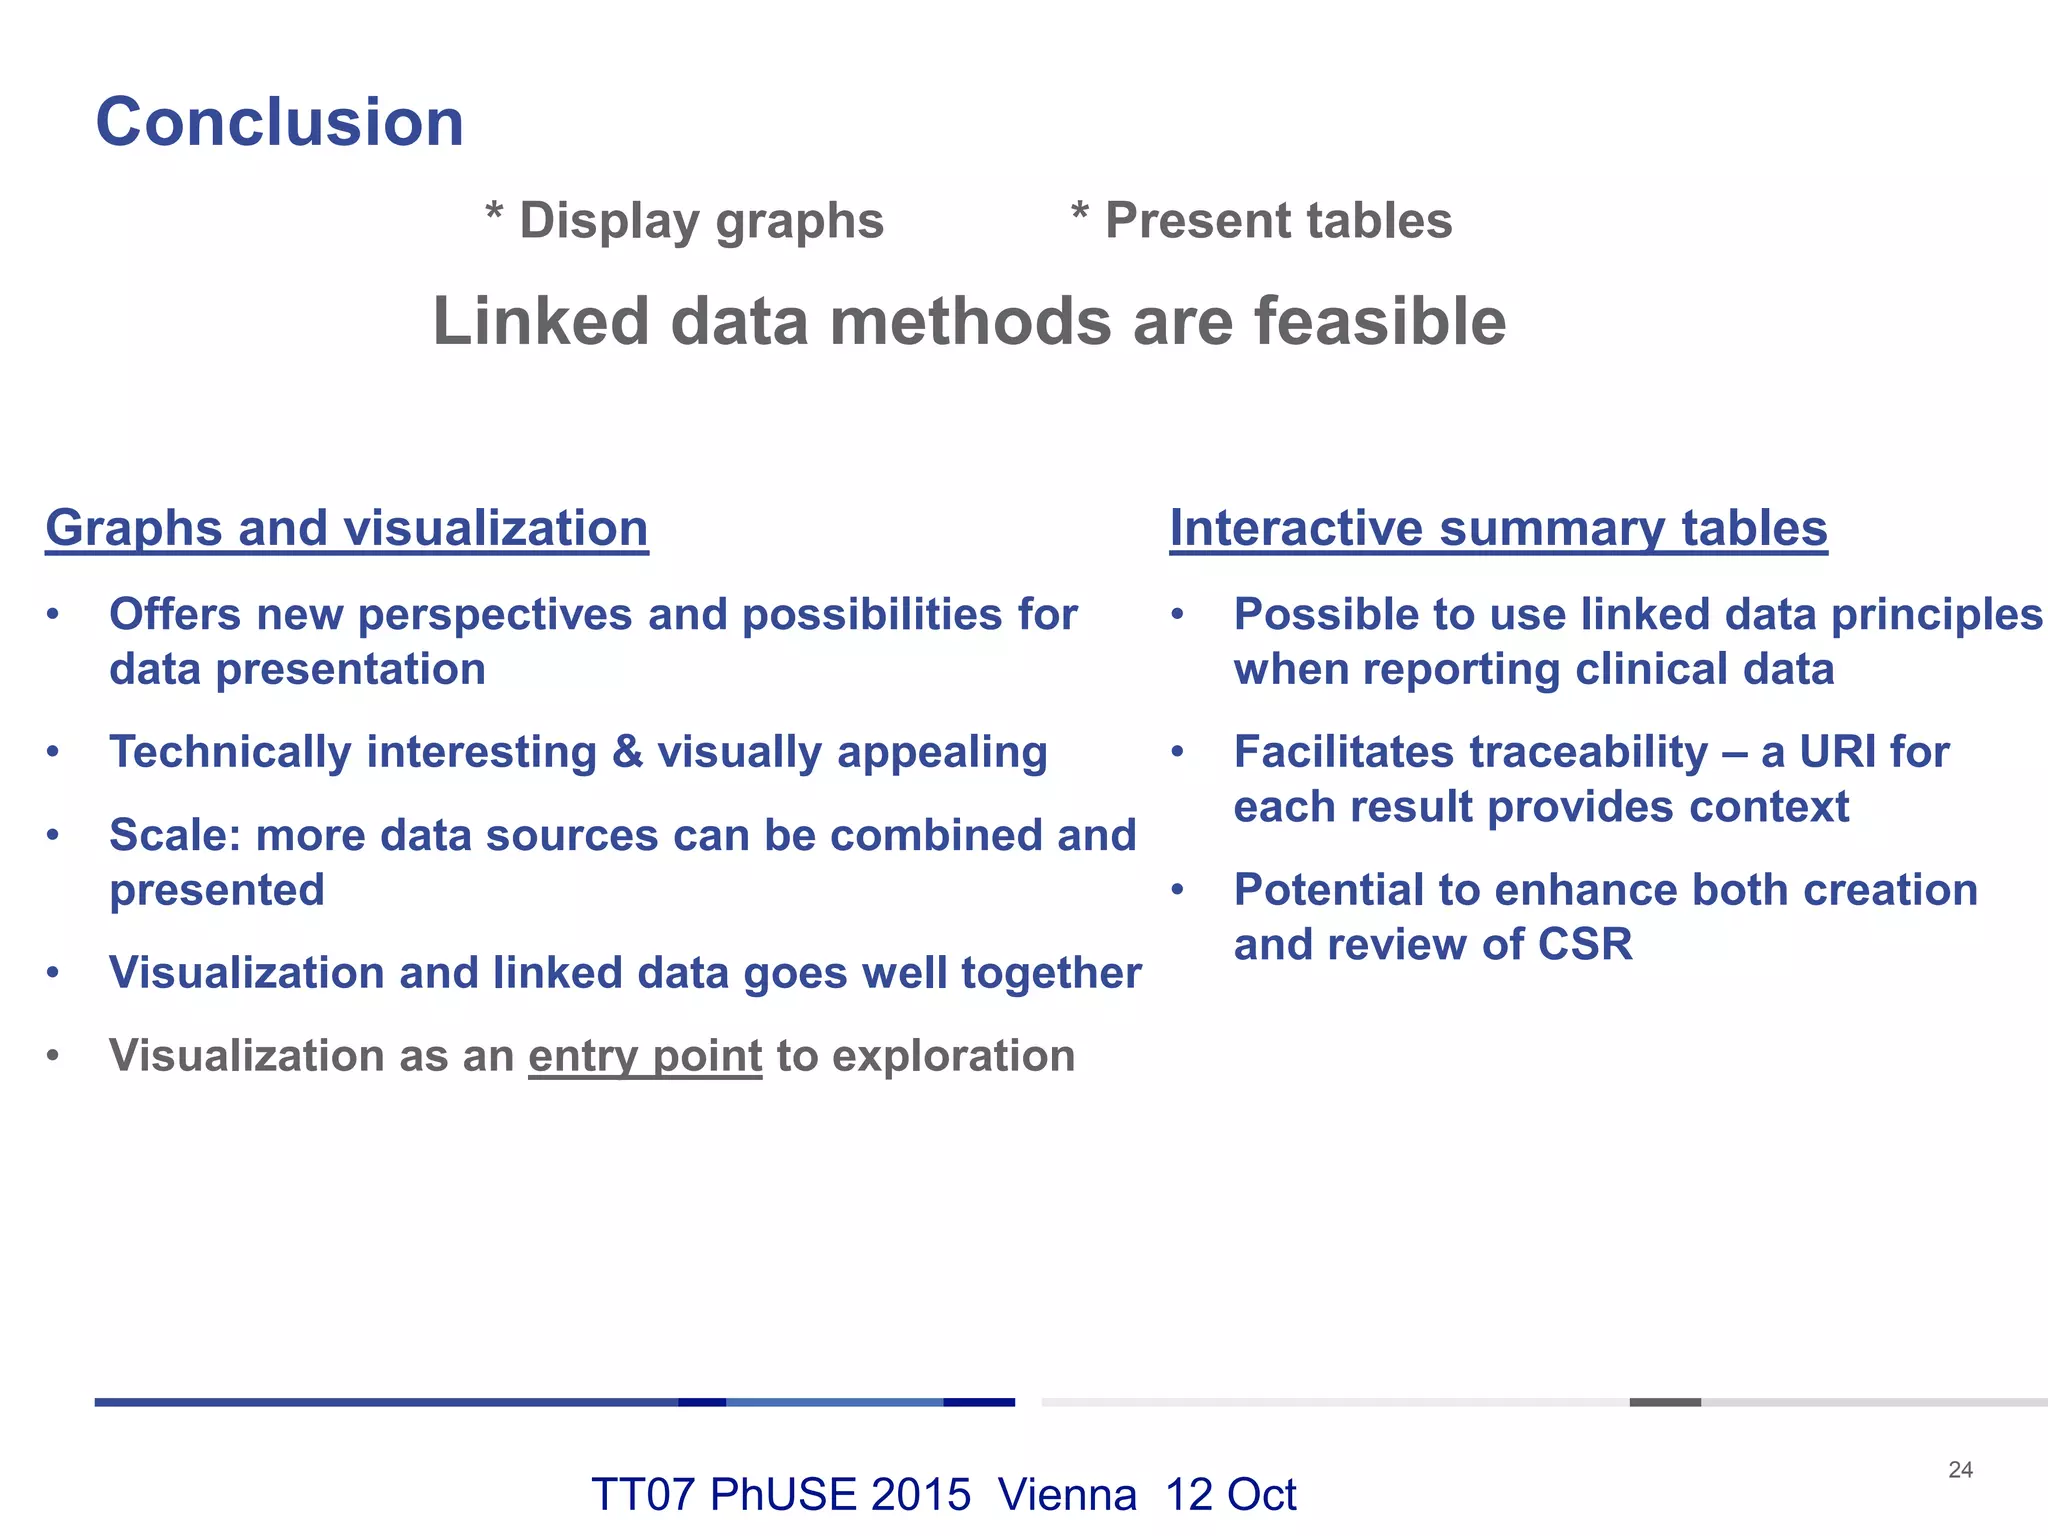
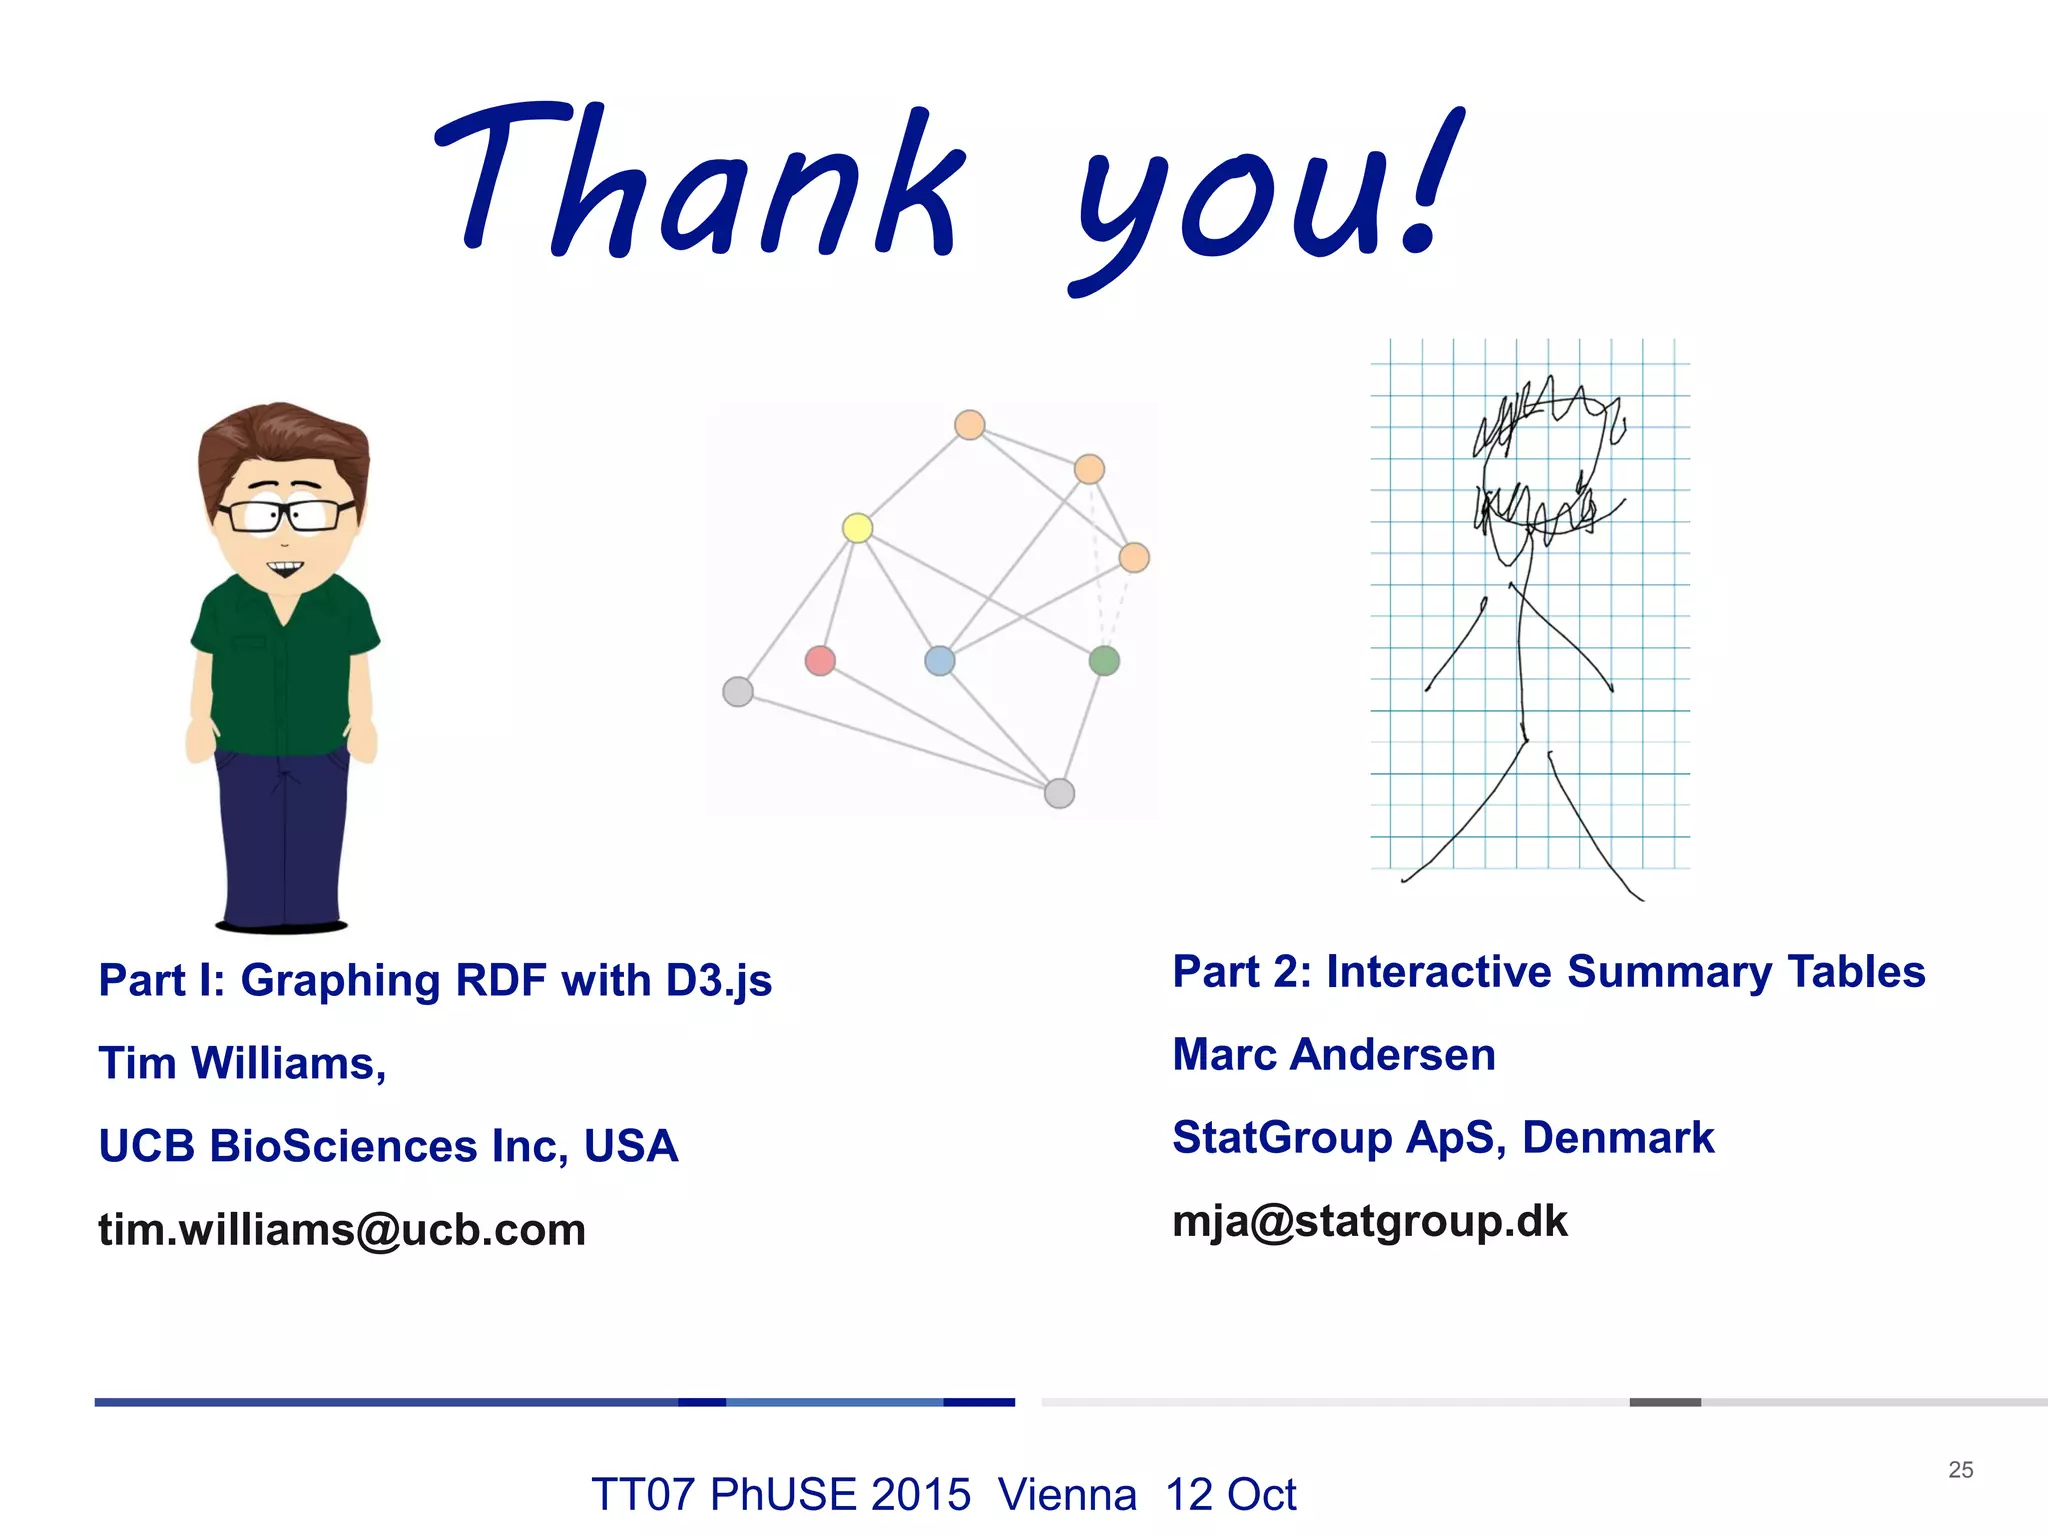
This document discusses using RDF and linked data principles to display clinical trial results as interactive graphs and summary tables. It describes how RDF triples can represent clinical data and be rendered as directed graphs using D3.js. It also presents an interface with actions like "Describe", "Dimensions", and "Data" that build and display SPARQL queries of an RDF data cube, allowing linked exploration and visualization of results. Ongoing work in the PhUSE Semantic Technology Project aims to further specify the RDF data cube model and develop supporting R packages and documentation.
Jens Lehmann's overview of the use of semantics in the Big Data Europe Integrator Platform. Including the Semantic Data Lake (Ontario), and the SANSA Analytics Engine.
One of the most promising areas in the world of NoSQL - graphs based storage and processing system which based on the theory of graphs. Neo4J - is, perhaps, the most popular Graph database at the moment. It provides high performance data storage and working with graphs, using various Java APIs and declarative query language Cypher.
Adobe, Cisco, classmates.com, Deutsche telecom and many others are using Neo4J.
Slides from March1st 2018 webinar
Tracking research data footprints via integration with Research Graph
Presented by Ben Evans and Jingbo Wang from NCI
Evaluation of TPC-H on Spark and Spark SQL in ALOJADataWorks Summit
The Evaluation of TPC-H on Spark and Spark SQL in ALOJA was conducted at the Big Data Lab to obtain the master degree in Management Information Systems at the Johann-Wolfgang Goethe University in Frankfurt, Germany. Furthermore, the analysis was partially accomplished in collaboration and close coordination with the Barcelona Super Computer Center.
The intention of this research was the integration of a TPC-H on Spark Scala benchmark into ALOJA, an open-source and public platform for automated and cost-efficient benchmarks and to perform an evaluation on the runtime of Spark Scala with or without Hive Metastore compared to Spark SQL. Various alternate file formats with different applied compressions on underlying data and its impact are evaluated. The conducted performance evaluation exposed diverse and captivating outcomes for both benchmarks. Further investigations attempt to detect possible bottlenecks and other irregularities. The aim is to provide an explanation to enhance knowledge of Spark’s engine based on examining the physical plans. Our experiments show, inter alia, that: (1) Spark Scala performs better in case of heavy expression calculation, (2) Spark SQL is the better choice in case of strong data access locality in combination with heavyweight parallel execution. In conclusion, diverse results were observed with the consequence that each API has its advantages and disadvantages.
Surprisingly, our findings are well spread between Spark SQL and Spark Scala and contrary to our expectations Spark Scala did not outperform Spark SQL in all aspects but support the idea that applied optimizations appear to be implemented in a different way by Spark for its core and its extension Spark SQL. The API on top of Spark provides extra information about the underlying structured data, which is probably used to perform additional optimizations.
In conclusion, our research demonstrates that there are differences in the generation of query execution plans that goes hand-in-hand with similar discoveries leading to inefficient joins, and it underlines the importance of our benchmark to identify disparities and bottlenecks.
Speaker
Raphael Radowitz, Quality Specialist, SAP Labs Korea
Publishing Linked Statistical Data: Aragón, a case studyOscar Corcho
Presentation at the Semstats2017 workshop (http://semstats.org/2017/) for the paper "Publishing Linked Statistical Data: Aragón, a Case Study", by Oscar Corcho, Idafen Santana-Pérez, Hugo Lafuente, David Portolés, César Cano, Alfredo Peris, José María Subero.
Time travel and time series analysis with pandas + statsmodelsAlexander Hendorf
Most data is allocated to a period or to some point in time. We can gain a lot of insight by analysing what happened when. The better the quality and accuracy of our data, the better our predictions can become.
Unfortunately the data we have to deal with is often aggregated for example on a monthly basis, but not all months are the same, they may have 28 days, 31 days, have four or five weekends,… It’s made fit to our calendar that was made fit to deal with the earth surrounding the sun, not to please Data Scientists.
Dealing with periodical data can be a challenge.
Pandas is a powerful framework for working with time series data and can make your life a lot easier.
This talks will feature:
how to analyse periodical data with pandas
read and write data in various formats
how to mangle, reshape and pivot
gain insights with statsmodels (e.g. seasonality)
caveats when working with timed data
visualize your data on the fly
Introduction to GraphX | Big Data Hadoop Spark Tutorial | CloudxLabCloudxLab
Big Data with Hadoop & Spark Training: http://bit.ly/2IYeuvF
This CloudxLab Introduction to GraphX tutorial helps you to understand GraphX in detail. Below are the topics covered in this tutorial:
1) Introduction to GraphX
2) What is Graph?
3) Examples of Graph Computation
4) Pagerank using GraphX
Hajira Jabeen introduces the Big Data Europe Integrator Platform. The deck also includes the slides use to summarise the other presentations in the launch webinar.
Societal Challenge 6: Social Sciences - Spending ComparisonBigData_Europe
Jürgen Jakobitsch describes the BDE project pilot for Societal Challenge 6 (Social Sciences). The platform is being used to ingest, analyse and visualise spending data from multiple sources.
Apache Big_Data Europe event: "Demonstrating the Societal Value of Big & Smar...BigData_Europe
H2020 BigDataEurope is a flagship project of the European Union's Horizon 2020 framework programme for research and innovation. In this talk we present the Docker-based BigDataEurope platform, which integrates a variety of Big Data processing components such as Hive, Cassandra, Apache Flink and Spark. Particularly supporting the variety dimension of Big Data, it adds a semantic data processing layer, which allows to ingest, map, transform and exploit semantically enriched data. In this talk, we will present the innovative technical architecture as well as applications of the BigDataEurope platform for life sciences (OpenPhacts), mobility, food & agriculture as well as industrial analytics (predictive maintenance). We demonstrate how societal value can be generated by Big Data analytics, e.g. making transportation networks more efficient or facilitating drug research.
Data Analysis and Visualization: R WorkflowOlga Scrivner
The lecture introduces to R project set-up, planning and deploying as well as to the concept of tidy data (Wickham and Grolemund, 2017).
Visual Insights Talks 2018 at
http://ivmooc.cns.iu.edu/
http://cns.iu.edu/
During the tranSMART Annual Meeting 2015, a hackathon will take place for developers to work an a few proof of concepts innovations around tranSMART, also preparing for the future 2.0 version of the platform. There will be two main topics during this hackathon, one catering to backend and one more to frontend developers.
The topics are:
building a POC around using SparkR on Amazon EC2 as a computational backend for tranSMART 1.3
improving the visual analytics in tranSMART, by updating or adding analytics workflows in the SmartR plugin
The reason for choosing these topics are:
For SparkR: Spark is the most active project in data science at the moment, with a lot of innovation and big names behind it. It makes sense to explore how we can optimally leverage this in the next version of the tranSMART platform. For this hackathon, a specific proposal has been prepared to use SparkR on top of the tranSMART core API to take advantage of the parallelization and lazy execution capabilities of Spark.
For Visual Analytics: the analytics in tranSMART are useful to get a quick overview of the data available in the platform, and one of the most visible and useful capabilities for early adopters to understand the value of the platform. The recently developed SmartR plugin (presented elsewhere in the meeting) provides already a few interactive analytics workflows, improving those and adding new ones is identified as a good opportunity for the hackathon.
Ideas for specific analytics workflows to work on are most welcome, and of course we are looking forward to welcome again both beginners and tranSMART developer ninja's in this years' sessions!
A Deep Dive Implementing xAPI in Learning GamesGBLxAPI
A presentation made by Stuart Claggett from Dig-iT! games on the journey to finding a new solution for collecting learning data from serious games. Learn how xAPI became the solution and how Dig-iT! games then took the project global launching an open-source community called GBlxAPI (https://gblxapi.org) for using xAPI in games and creating a profile and deeper vocabulary for K-12 education has yet to embrace xAPI.
The session included references to free tools including an API for use with Unity3D game engine to simplify getting xAPI into games. Other tools include an xAPI design sheet to help you organize your learning data before implementing it in your organization and serious games.
Trino: A Ludicrously Fast Query Engine - Pulsar Summit NA 2021StreamNative
You may be familiar with the Presto plugin used to run fast interactive queries over Pulsar using ANSI SQL and can be joined with other data sources. This plugin will soon get a rename to align with the rename of the PrestoSQL project to Trino. What is the purpose of this rename and what does it mean for those using the Presto plugin? We cover the history of the community shift from PrestoDB to PrestoSQL, as well as, the future plans for the Pulsar community to donate this plugin to the Trino project. One of the connector maintainers will then demo the connector and show what is possible when using Trino and Pulsar!
FP7 OpenCube project presentation at NTTS 2015 conferenceEfthimios Tambouris
FP7 OpenCube project presentation at New Techniques and Technologies for Statistics (NTTS) conference. The conference took plance at Brussels between 10 and 12 March 2015.
As part of the final BETTER Hackathon, project partners prepared 4 hackathon exercises. Fraunhofer IAIS organised this exercise in conjunction with external partner MKLab ITI-CERTH (EOPEN project). This step-by-step exercise featured the setup of local Docker images on Linux OS featuring Dcoker Compose and (pre-installed) Python, SANSA, Hadoop, Apache Spark and Apache Zeppelin. It featured semantic transformation and and the use of SANSA (Scalable Semantic Analytics Stack - http://sansa-stack.net/) libraries on a sample of tweets ahead of geo-clustering.
Project website (Hackathon information): https://www.ec-better.eu/pages/2nd-hackathon
Github repository: https://github.com/ec-better/hackathon-2020-semanticgeoclustering
Presentation ADEQUATe Project: Workshop on Quality Assessment and Improvement...Martin Kaltenböck
Presentation of the ADEQUATe Project in the course of the Workshop on Quality Assessment and Improvements in Open Data (Catalogues), taking place at the annual open data conference Switzerland (that took place 14 June 2016 in Lausanne, see: http://www.opendata.ch).
Workshop speakers / facilitators: Johann Höchtl (Danube University Krems), Jürgen Umbrich (University of Economics, Vienna), Martin Kaltenböck (Semantic Web Company).
More infos: http://www.adequate.at
"Benchmarking of distributed linked data streaming systems" as presented in the Stream Reasoning Workshop 2018, January 16-17, 2018, held by Department of Informatics DDIS (University of Zurich) in Zurich, Suisse
This work was supported by grants from the EU H2020 Framework Programme provided for the project HOBBIT (GA no. 688227).
Linked Statistical Data: does it actually pay off?Oscar Corcho
Invited keynote at the ISWC2015 Workshop on Semantics and Statistics (SemStats 2015). http://semstats.github.io/2015/
The release of the W3C RDF Data Cube recommendation was a significant milestone towards improving the maturity of the area of Linked Statistical Data. Many Data Cube-based datasets have been released since then. Tools for the generation and exploitation of such datasets have also appeared. While the benefits for the usage of RDF Data Cube and the generation of Linked Data in this area seem to be clear, there are still many challenges associated to the generation and exploitation of such data. In this talk we will reflect about them, based on our experience on generating and exploiting such type of data, and hopefully provoke some discussion about what the next steps should be.
Rachael LammeyCrossref Mary Hirsch DataCite
The underlying data created and/or reused and remixed for research is becoming as crucial as the resulting text-based output. This is your opportunity to dig into the what, the why, and the how of data publication, data citation, and data sharing. Workshop hosts will cover this topic from a range of perspectives. Let’s review the best practices and case studies in data citation and data publishing, add to our collective understanding of why this is so important, and contribute to the next steps in building solutions to improving infrastructure for research data
Big data appliance ecosystem - in memory db, hadoop, analytics, data mining, business intelligence with multiple data source charts, twitter support and analysis.
The right architecture is key for any IT project. This is especially the case for big data projects, where there are no standard architectures which have proven their suitability over years. This session discusses the different Big Data Architectures which have evolved over time, including traditional Big Data Architecture, Streaming Analytics architecture as well as Lambda and Kappa architecture and presents the mapping of components from both Open Source as well as the Oracle stack onto these architectures.
Data Centers - Striving Within A Narrow Range - Research Report - MCG - May 2...pchutichetpong
M Capital Group (“MCG”) expects to see demand and the changing evolution of supply, facilitated through institutional investment rotation out of offices and into work from home (“WFH”), while the ever-expanding need for data storage as global internet usage expands, with experts predicting 5.3 billion users by 2023. These market factors will be underpinned by technological changes, such as progressing cloud services and edge sites, allowing the industry to see strong expected annual growth of 13% over the next 4 years.
Whilst competitive headwinds remain, represented through the recent second bankruptcy filing of Sungard, which blames “COVID-19 and other macroeconomic trends including delayed customer spending decisions, insourcing and reductions in IT spending, energy inflation and reduction in demand for certain services”, the industry has seen key adjustments, where MCG believes that engineering cost management and technological innovation will be paramount to success.
MCG reports that the more favorable market conditions expected over the next few years, helped by the winding down of pandemic restrictions and a hybrid working environment will be driving market momentum forward. The continuous injection of capital by alternative investment firms, as well as the growing infrastructural investment from cloud service providers and social media companies, whose revenues are expected to grow over 3.6x larger by value in 2026, will likely help propel center provision and innovation. These factors paint a promising picture for the industry players that offset rising input costs and adapt to new technologies.
According to M Capital Group: “Specifically, the long-term cost-saving opportunities available from the rise of remote managing will likely aid value growth for the industry. Through margin optimization and further availability of capital for reinvestment, strong players will maintain their competitive foothold, while weaker players exit the market to balance supply and demand.”
Explore our comprehensive data analysis project presentation on predicting product ad campaign performance. Learn how data-driven insights can optimize your marketing strategies and enhance campaign effectiveness. Perfect for professionals and students looking to understand the power of data analysis in advertising. for more details visit: https://bostoninstituteofanalytics.org/data-science-and-artificial-intelligence/
Chatty Kathy - UNC Bootcamp Final Project Presentation - Final Version - 5.23...John Andrews
SlideShare Description for "Chatty Kathy - UNC Bootcamp Final Project Presentation"
Title: Chatty Kathy: Enhancing Physical Activity Among Older Adults
Description:
Discover how Chatty Kathy, an innovative project developed at the UNC Bootcamp, aims to tackle the challenge of low physical activity among older adults. Our AI-driven solution uses peer interaction to boost and sustain exercise levels, significantly improving health outcomes. This presentation covers our problem statement, the rationale behind Chatty Kathy, synthetic data and persona creation, model performance metrics, a visual demonstration of the project, and potential future developments. Join us for an insightful Q&A session to explore the potential of this groundbreaking project.
Project Team: Jay Requarth, Jana Avery, John Andrews, Dr. Dick Davis II, Nee Buntoum, Nam Yeongjin & Mat Nicholas
"Dude, where's my graph?" RDF Data Cubes for Clinical Trials Data
1. ‘Dude, where’s my graph?’
RDF Data Cubes for Clinical Trials
Data.
PhUSE 2015, Vienna
Part I: Graphing RDF with D3.js
Tim Williams,
UCB BioSciences Inc, USA
tim.williams@ucb.com
Part 2: Interactive Summary Tables
Marc Andersen
Stat Group ApS, Denmark
mja@statgroup.dk
2. TT07 PhUSE 2015 Vienna 12 Oct 2
RDF Triples as Directed Graphs
Subject
predicate
Object
Vienna 1805681
populationTotal
3. TT07 PhUSE 2015 Vienna 12 Oct
The Reality
3
Dude,
where’s my graph?
4. TT07 PhUSE 2015 Vienna 12 Oct
Clinical Trials Results: RDF Data Cube
4
Dude,
seriously!!
5. TT07 PhUSE 2015 Vienna 12 Oct
Using R to obtain and graph triples
5
rrdf, rrdflibs networkD3
rrdf, rrdflibs jsonLite (HTTP server)
6. TT07 PhUSE 2015 Vienna 12 Oct
Data Visualization with D3.js (d3js.org)
6
7. TT07 PhUSE 2015 Vienna 12 Oct
Federated Query Visualization
7
Webm Link
LiveGraph
8. TT07 PhUSE 2015 Vienna 12 Oct
RDF Data Cube: High-Level Structure
8
Webm link
LiveGraph
9. TT07 PhUSE 2015 Vienna 12 Oct
RDF Data Cube: qb:Observation Model
9
Webm Link
LiveGraph
10. TT07 PhUSE 2015 Vienna 12 Oct
RDF Data Cube: Demographics
10
Websm Link
LiveGraph
11. TT07 PhUSE 2015 Vienna 12 Oct
RDF Code Lists Interactive Visualization
11
webSM Link
LiveGraph
12. TT07 PhUSE 2015 Vienna 12 Oct 12
But there is more
than graphs!
Everything is a
graph!
13. TT07 PhUSE 2015 Vienna 12 Oct
Presented by Marc Andersen, StatGroup ApS
Part II : Interactive Summary Tables
13
14. TT07 PhUSE 2015 Vienna 12 Oct
The interface
• Left side: Actions
• Right side: Results
• Build using HTML and javascript
• Shows HTML pages using iframe
• SPARQL queries to a triple store
• Rendition of SPARQL query results
• RDF data cube created in R
• HTML version of cube in row-column
format with href corresponding to the
underlying RDF object
• Drag and drop links to the actions on
the left
14
15. TT07 PhUSE 2015 Vienna 12 Oct
Action: Describe
15
Shows result of SPARQL query describe for the item dropped
Using OpenLink Virtuoso - HTTP based Linked Data Server, include SPARQL
endpoint
Virtuoso provides a faceted browser
Note Linked Data Server specific – other servers can be used, or other ways of
displaying the result.
17. TT07 PhUSE 2015 Vienna 12 Oct
Action: Dimensions
17
Dropping an observation
• shows all dimensions with code lists
Dropping a dimension
• shows only the dimension
Result of a SPARQL query displayed as
the html
returned from the SPARQL endpoint
(Virtuoso)
19. TT07 PhUSE 2015 Vienna 12 Oct
Action: Data
19
Dropping an observation
• Builds SPARQL query to retrieve underlying data using JavaScript
• Present received data as a table using JavaScript
• Drag URI to Action describe to invoke faceted browser
Instead of showing a table, the data can be visualized using, say, d3js
21. TT07 PhUSE 2015 Vienna 12 Oct
Action: Copy
21
Dropping an observation
• copies the text representation and the URI for the object to the clipboard
• pasted into any application understanding text/HTML, e.g. Microsoft Word
Technical issue: have to use Ctrl-C to copy to clipboard. Clipboard functionality is defined in HTML5, but
works slightly different in each browser. So may need a specialized browser?
23. TT07 PhUSE 2015 Vienna 12 Oct
Ongoing in PhUSE Semantic Technology Project
Technical specification of the cube
model
• In Draft 1 – July 31, 2015. Review and
discussion ongoing
R package
• Rewrite to match Tech Spec Draft 1, split
into smaller packages, move to
PhUSE.org GitHub
White Paper for considerations and
benefits of modeling Analysis Results
& Metadata in RDF
• Draft written, in process
23
Analysis Results Model – see
http://www.phusewiki.org/wiki/index.php?title=Analysis_Results_Model
Modeling Analysis Results & Metadata to
Support Clinical and Non-Clinical Applications
New Project suggestions:
Concise specification of tables for
descriptive statistics using metadata –
inspiration for syntax/formular from
SAS PROC Tabulate
R packages tables (https://cran.r-
project.org/web/packages/tables/index.
html)
Tabular representation for inclusion in
CSR of analysis results using meta
data
24. TT07 PhUSE 2015 Vienna 12 Oct
Conclusion
24
* Display graphs * Present tables
Linked data methods are feasible
Interactive summary tables
• Possible to use linked data principles
when reporting clinical data
• Facilitates traceability – a URI for
each result provides context
• Potential to enhance both creation
and review of CSR
Graphs and visualization
• Offers new perspectives and possibilities for
data presentation
• Technically interesting & visually appealing
• Scale: more data sources can be combined and
presented
• Visualization and linked data goes well together
• Visualization as an entry point to exploration
25. TT07 PhUSE 2015 Vienna 12 Oct
25
Thank you!
Part I: Graphing RDF with D3.js
Tim Williams,
UCB BioSciences Inc, USA
tim.williams@ucb.com
Part 2: Interactive Summary Tables
Marc Andersen
StatGroup ApS, Denmark
mja@statgroup.dk