Download to read offline

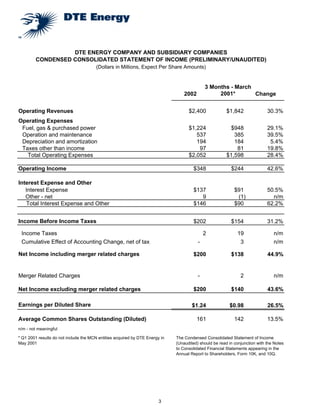
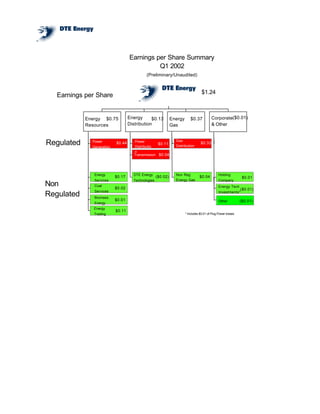
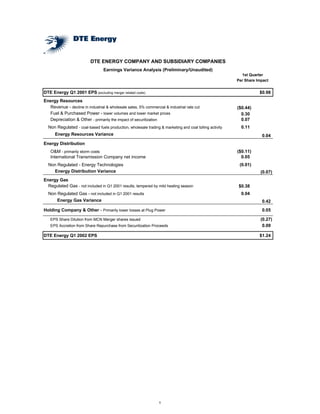
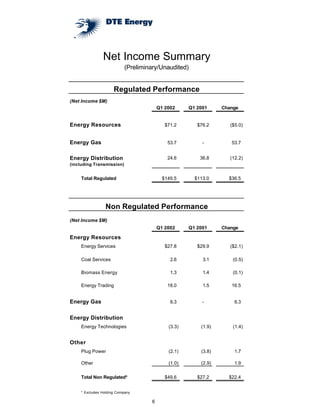
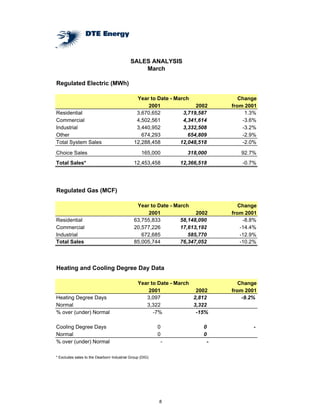
DTE Energy reported strong financial results for the first quarter of 2002, with net income of $200 million, a 44% increase over the previous year. Earnings per share increased 27% to $1.24. The results were driven by higher earnings from non-regulated businesses and the addition of DTE Energy's gas distribution business. Despite challenges like a mild winter and slow economic recovery, the company reaffirmed its full-year earnings target of $3.70 to $4.00 per share due to the diversity of its businesses.


