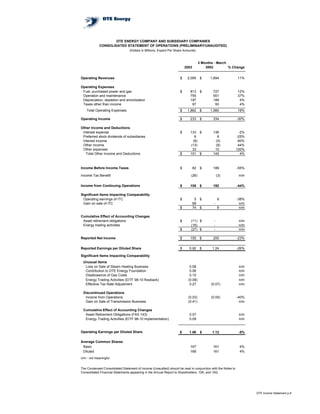
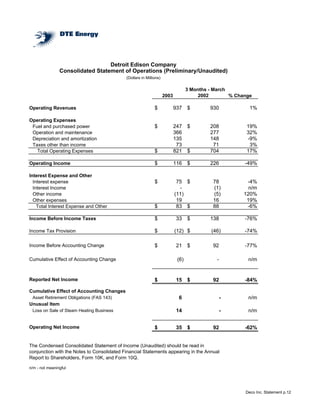
DTE Energy reported first quarter 2003 earnings of $155 million compared to $200 million in the same period of 2002. Operating earnings, which exclude non-recurring items, were $178 million in the first quarter of 2003 compared to $181 million in the first quarter of 2002. The company's non-regulated businesses such as synthetic fuels production and energy trading saw stronger earnings compared to the prior year and helped offset higher costs at the company's regulated electric and gas utilities. DTE Energy affirmed its 2003 operating earnings guidance range of $3.75-$3.95 per share after adjusting for the sale of its transmission business.
DTE Energy announced its 2007 financial results. Reported earnings were $971 million or $5.70 per share, up from $433 million or $2.43 per share in 2006. This was largely driven by asset sales. Operating earnings, which exclude asset sales, were $2.82 per share, down slightly from $2.89 per share in 2006. For 2008, DTE Energy expects operating earnings between $2.70 to $3.10 per share and continues its focus on investments in its utility businesses.
DTE Energy raised its 2008 earnings guidance based on strong expected performance across several business segments. It reported first quarter 2008 operating earnings of $128 million, up from $112 million in the first quarter of 2007, driven by higher earnings at its energy trading business. Several business segments experienced improved results compared to the prior year quarter. The company also advocated for comprehensive energy reform legislation in Michigan to secure clean energy supplies and jobs.
DTE Energy reported earnings of $186 million for the first quarter of 2004, up from $155 million in the first quarter of 2003. Operating earnings, which exclude non-recurring items, were $151 million, comparable to the $178 million reported in the first quarter of 2003. Earnings were impacted by warmer weather and increased uncollectable accounts at the company's gas distribution business. The company expects to receive rate relief in 2004 that will help improve earnings performance for the year.
DTE Energy reported third quarter net income of $176 million compared to $161 million in the previous year. Operating earnings for the third quarter were $114 million, comparable to the $120 million in 2002. For the first nine months, net income was $292 million compared to $429 million in 2002, while operating earnings were $362 million versus $387 million the prior year. The company faced challenges from a cool summer, storms, and the August 2003 blackout. Looking ahead, the company said regulatory actions and legislative changes are needed to address issues with Michigan's electric customer choice program.
DTE Energy announced its third quarter 2007 earnings. Operating earnings were $181 million compared to $255 million in third quarter 2006, primarily due to one-time gains in 2006 and startup costs for new systems in 2007. For the first nine months, operating earnings were $317 million compared to $377 million in 2006, mainly due to onetime costs at Detroit Edison including new system startup. The company expects to meet its annual operating earnings guidance and sees underlying business performing well despite some one-time items.
DTE Energy reported earnings for 2003 fell 18% from 2002, driven by weak results at its utility subsidiaries, Detroit Edison and MichCon. Earnings at Detroit Edison dropped 31% due to impacts of Michigan's Electric Choice program, as well as higher costs and mild weather. MichCon saw a 26% rise in operating expenses. The CEO noted regulatory issues need resolution and Electric Choice program flaws addressed for financial health of the utilities. Non-regulated operations increased earnings 7% and continued stable growth, but regulated businesses face financial pressure until regulatory issues are resolved.
DTE Energy reported 2004 earnings of $431 million, down from 2003 earnings of $521 million. Operating earnings for 2004 were $427 million, down from $500 million in 2003. Earnings declined due to factors such as mild weather, lower retail customer sales, and higher expenses. However, the company completed several regulatory proceedings favorably and expects earnings to improve in 2005 with resolution of outstanding rate cases and continued non-utility business growth. DTE Energy reconfirmed its 2005 earnings guidance of $3.30 to $3.60 per share.
DTE Energy announced its first quarter 2007 earnings. Reported earnings were $134 million compared to $136 million in the first quarter of 2006. Operating earnings, which exclude non-recurring items, were $149 million compared to $171 million in the prior year. The primary drivers of the decline were a temporary rate reduction at Detroit Edison and increased costs from a January ice storm. DTE Energy maintained its 2007 earnings guidance and cash flow from operations increased 8% from the prior year.
DTE Energy reported first quarter earnings of $149 million compared to $190 million in the first quarter of 2004. Operating earnings, which exclude non-recurring items, were $153 million compared to $152 million in the prior year. The company reconfirmed its 2005 earnings guidance range of $3.30 to $3.60 per share. Several business units saw lower earnings due to timing factors but the company expects to meet its annual targets.
DTE Energy reported lower third quarter earnings compared to the previous year. Earnings were down due to a decline in operating earnings at Detroit Edison, impacted by mild weather and loss of customers to electric choice programs. While non-regulated businesses performed well, regulatory uncertainties at the utilities impacted overall results. Management expects resolutions to rate cases and improvements to electric choice programs to strengthen earnings in 2005.
DTE Energy reported lower second quarter earnings compared to the previous year, but operating earnings were higher. While the electric and gas utilities saw improved earnings, the non-utility businesses had lower earnings due to accounting deferrals and oil hedging losses. However, DTE Energy reaffirmed its full-year operating earnings guidance.
TXU reported better than expected earnings for the first quarter of 2003, with earnings from continuing operations of $101 million (exceeding the target of $0.20 per share). Full year 2003 guidance remains at $1.95 to $2.05 per share. Earnings were higher than expected due to increased contributions from the North America Energy Delivery segment and cost reductions, though partially offset by higher fuel costs and interest expenses. TXU has also accomplished debt reduction and cost cutting objectives to strengthen its financial position.
DTE Energy reported second quarter earnings of $35 million compared to a loss of $39 million in the second quarter of 2003. Operating earnings, which exclude non-recurring items, were $39 million in the second quarter of 2004 compared to $70 million in the same period of 2003. For the six months ended June 30, 2004, reported earnings were $225 million compared to $116 million in 2003. Operating earnings were negatively impacted by Michigan's Electric Choice program and increased pension and healthcare expenses at Detroit Edison and MichCon. However, non-regulated businesses performed well with increased earnings from coal and energy marketing.
energy future holindings TXU_Q4_2003_Earnings_Packfinance29
TXU reported strong financial results for 2003, delivering earnings of $715 million compared to $160 million in 2002. Net income for 2003 was $560 million compared to a net loss of $4.232 billion in 2002. For the fourth quarter of 2003, earnings were $66 million compared to a loss of $547 million in the same period of 2002. All business segments contributed increased earnings, with the Energy segment delivering $493 million for the full year compared to $319 million in 2002. Management expects to deliver 2004 earnings of $2.15 per share.
progress energy 3Q 02.earnings.release.andfinancialsfinance25
- Progress Energy reported ongoing quarterly earnings of $1.53 per share and GAAP earnings of $0.71 per share. It expects 2002 ongoing earnings to be within its target range of $3.90 to $4.00 per share.
- It announced an agreement to sell NCNG to Piedmont Natural Gas for $425 million, which will be used to pay down debt.
- For 2003, it expects 3% earnings growth over 2002 through cost management, sales growth at its electric utilities, and additional revenues from its non-regulated business.
DTE Energy reported strong third quarter 2006 earnings of $188 million compared to $4 million in third quarter 2005. Operating earnings, which exclude non-recurring items, were $255 million in third quarter 2006 compared to $5 million in third quarter 2005. All of DTE Energy's business segments experienced increased operating earnings except for Gas Utility which typically has a seasonal loss in the third quarter. DTE Energy tightened its full year 2006 operating earnings guidance excluding synthetic fuels to be between $2.42 to $2.53 per share.
DTE Energy reported third quarter earnings of $0.96 per share, up from $0.51 per share in the third quarter of 2001, excluding merger and restructuring expenses. Year-to-date earnings increased 30% compared to 2001. The company's regulated utility operations performed well due to higher residential sales from increased cooling demand and lower fuel costs. Non-regulated businesses such as energy services also contributed significantly to earnings. DTE Energy reaffirmed its guidance for 2002 earnings of $3.75-$3.95 per share and 2003 earnings of $3.90-$4.10 per share, expecting continued challenges from the economy but benefits from cost controls.
The document provides financial information for DTE Energy Company and its subsidiaries for the fourth quarter and full year of 2005. It includes statements of operating income, financial position, cash flows, and debt to equity calculations. For the quarter, DTE Energy reported net income of $378 million compared to $151 million in the prior year. For the full year, net income was $577 million compared to $445 million in 2004. Total assets as of December 31, 2005 were $23.36 billion with total debt of $6.6 billion and shareholders' equity of $5.55 billion.
DTE Energy reported net income of $149 million for the first quarter of 2005, compared to $190 million for the same period in 2004. Adjustments for contract terminations and modifications, impairment charges, and tax normalization resulted in operating earnings of $153 million for 2005 versus $152 million in 2004. Higher earnings from energy distribution and gas distribution were offset by lower earnings from energy trading and other corporate activities.
DTE Energy Company's preliminary unaudited net income for the three months ended December 31, 2004 was $162 million, compared to $138 million for the same period in 2003. The results include various adjustments including a $28 million stranded cost adjustment, $1 million in DTE2 project costs, and a $14 million tax credit driven normalization adjustment. For the full year 2004, reported net income was $229 million compared to $138 million in 2003, reflecting various operating and non-operating adjustments between the periods.
DTE Energy's consolidated financial statements for Q1 2006 show:
- Total assets of $22.4 billion, with current assets of $4.7 billion including cash of $75 million.
- Total liabilities of $16.7 billion including long-term debt of $7.1 billion.
- Shareholders' equity of $5.8 billion.
- Operating revenues for Detroit Edison increased 5% to $1.05 billion due to higher sales across all customer classes as weather was warmer.
DTE Energy reported first quarter earnings of $138 million compared to $117 million in the first quarter of 2000. Revenue from non-regulated businesses increased 251% to $817 million, contributing to increased earnings. The results were positively impacted by the suspension of the fuel clause and the company expects to complete its merger with MCN Energy in June, which is an important part of DTE Energy's growth strategy.
- The document provides financial information for DTE Energy Company and its subsidiaries Detroit Edison and MichCon for the third quarter of 2007, including statements of financial position, cash flows, and operations.
- Key details include total assets of $23.8 billion, total debt of $6.8 billion or 53% of total capitalization, and operating revenues of $1.2 billion for Detroit Edison and $1.3 billion for MichCon.
- Electric sales decreased 1% while gas sales increased for Detroit Edison and MichCon respectively, compared to the same quarter in 2006.
DTE Energy reported strong financial results for the first quarter of 2002, with net income of $200 million, a 44% increase over the previous year. Earnings per share increased 27% to $1.24. The results were driven by higher earnings from non-regulated businesses and the addition of DTE Energy's gas distribution business. Despite challenges like a mild winter and slow economic recovery, the company reaffirmed its full-year earnings target of $3.70 to $4.00 per share due to the diversity of its businesses.
DTE Energy reported third quarter net income of $176 million compared to $161 million in the previous year. Operating earnings for the third quarter were $114 million, comparable to the $120 million in 2002. Year-to-date operating earnings were $362 million compared to $387 million in 2002. The company experienced challenges from a cool summer, windstorm, and blackout, as well as ongoing issues with electric customer choice programs and increased costs. Looking ahead, the company said regulatory and legislative actions are needed to address issues in Michigan's electric customer choice program.
DTE Energy reported earnings of $521 million for 2003, down 18% from 2002, driven by weak results at its utility subsidiaries Detroit Edison and MichCon. Detroit Edison's earnings dropped 31% to $246 million due to impacts of Michigan's electric choice program, higher costs such as pensions and healthcare, and storms. MichCon saw a 26% rise in operating costs. The CEO said they need rate relief from the MPSC and changes to the electric choice program to make it fair to customers and utilities.
DTE Energy reported earnings of $186 million for the first quarter of 2004, up from $155 million in the first quarter of 2003. Operating earnings, which exclude non-recurring items, were $151 million, comparable to the $178 million reported in the first quarter of 2003. Earnings were impacted by warmer weather and increased uncollectable accounts at the company's gas distribution business. The company expects to receive rate relief in 2004 that will help improve earnings performance for the year.
DTE Energy reported first quarter 2007 earnings of $134 million, down slightly from $136 million in first quarter 2006. Operating earnings were $149 million in first quarter 2007, down from $171 million in the prior year period. The company reiterated its full year 2007 operating earnings guidance. DTE Energy saw increased earnings at its gas utility segment due to colder weather, while earnings declined at its electric utility due to a rate reduction and higher storm costs. The company is pursuing plans to restructure its non-utility businesses and return value to shareholders through stock buybacks.
DTE Energy reported lower third quarter earnings compared to the previous year. Earnings were $93 million compared to $176 million in 2003. Operating earnings were also down, at $69 million versus $114 million the year before. The decline was largely due to lower revenues at Detroit Edison from mild weather and customers switching to electric choice programs. However, DTE Energy expects regulatory proceedings to improve the financial outlook for its utility businesses and continued strong performance from non-regulated operations.
DTE Energy raised its 2008 earnings guidance due to strong expected performance across several business segments. It reported first quarter 2008 earnings of $212 million compared to $134 million in first quarter 2007. Operating earnings for first quarter 2008 were $128 million compared to $112 million in first quarter 2007, driven by higher earnings from energy trading. Several business segments experienced improved earnings compared to first quarter 2007. DTE Energy also saw higher cash flows from operations compared to first quarter 2007.
DTE Energy reported 2004 earnings of $431 million, down from 2003 earnings of $521 million. Operating earnings for 2004 were $427 million, down from $500 million in 2003. The company maintained its 2005 earnings guidance of $3.30 to $3.60 per share. Key factors impacting 2004 results included mild weather, lower utility sales from customer choice programs, and higher power plant and benefit costs. However, the company completed favorable rate cases and expects regulatory resolutions and non-utility growth to improve 2005 earnings.
DTE Energy announced its 2007 financial results. Reported earnings were $971 million or $5.70 per share, up from $433 million or $2.43 per share in 2006. This was largely driven by asset sales. Operating earnings excluding special items were $2.82 per share, down slightly from $2.89 per share in 2006. DTE Energy expects over 80% of its earnings to come from its utility businesses going forward and provided 2008 operating earnings guidance of $2.70 to $3.10 per share.
DTE Energy reported lower second quarter earnings compared to the previous year, but operating earnings were higher. While the electric and gas utilities saw improved earnings, the non-utility businesses had lower earnings due to accounting deferrals and oil hedging losses. However, DTE Energy reaffirmed its full-year operating earnings guidance.
DTE Energy reported 2002 earnings of $632 million or $3.83 per diluted share, up 10% from 2001 operating earnings. Earnings for the fourth quarter of 2002 were $203 million or $1.21 per diluted share, down from 2001 operating earnings of $1.43 per diluted share. The company reaffirmed its 2003 earnings guidance of $3.90 to $4.10 per share despite anticipated challenges. By business unit, DTE Energy Resources contributed earnings growth while DTE Energy Distribution saw declines due to storm costs and DTE Energy Gas saw increases.
DTE Energy reported 2002 earnings of $632 million or $3.83 per diluted share, up 10% from 2001 operating earnings. Earnings for the fourth quarter of 2002 were $203 million or $1.21 per diluted share, down from $1.43 per diluted share in the fourth quarter of 2001. The company reaffirmed its 2003 earnings guidance of $3.90 to $4.10 per share. Key drivers for the full year included higher earnings from energy resources and gas distribution, partially offset by lower earnings from energy distribution and higher interest and corporate expenses.
DTE Energy announced its third quarter 2007 earnings. Operating earnings were $181 million compared to $255 million in third quarter 2006, primarily due to one-time gains in 2006 and startup costs for new systems in 2007. For the first nine months, operating earnings were $317 million compared to $377 million in 2006, mainly due to onetime costs at Detroit Edison including new system startup costs and a temporary rate reduction. The company expects to meet its annual operating earnings guidance and sees strong cash flow providing flexibility for growth.
DTE Energy reported first quarter earnings of $149 million compared to $190 million in the first quarter of 2004. Operating earnings, which exclude non-recurring items, were $153 million compared to $152 million in the prior year. The company reconfirmed its 2005 earnings guidance range of $3.30 to $3.60 per share. Several business units saw lower earnings due to timing factors but the company expects to meet its annual targets. Moody's upgraded its outlook for DTE Energy to stable due to expected improvement in financial performance over the next few years.
DTE Energy reported second quarter earnings of $35 million compared to a loss of $39 million in the second quarter of 2003. Operating earnings, which exclude non-recurring items, were $39 million in the second quarter of 2004 compared to $70 million in the same period of 2003. For the six months ended June 30, 2004, reported earnings were $225 million compared to $116 million in 2003. Operating earnings were negatively impacted by Michigan's Electric Choice program and increased pension and healthcare expenses at Detroit Edison and MichCon. DTE Energy expects higher earnings from its synfuels business and increased its 2004 earnings guidance for non-regulated businesses.
DTE Energy reported strong third quarter 2006 earnings of $188 million compared to $4 million in third quarter 2005. Operating earnings, which exclude non-recurring items, were $255 million in third quarter 2006 compared to $5 million in third quarter 2005. All of DTE Energy's business segments experienced increased operating earnings except for Gas Utility which typically has a seasonal loss in the third quarter. DTE Energy tightened its full year 2006 operating earnings guidance excluding synthetic fuels to be between $2.42 to $2.53 per share.
energy future holindings TXU_Q3_2003_Earnings_Packfinance29
TXU reported improved financial results for the third quarter and first nine months of 2003 compared to the same periods in 2002. Third quarter earnings from continuing operations increased 15% to $368 million, or $1.01 per share, due to higher contribution margins and lower costs across all business segments. For the first nine months, earnings from continuing operations were $650 million, or $1.82 per share. TXU expects full-year 2003 earnings from continuing operations to be around $2.00 per share.
DTE Energy reported a loss for the second quarter of 2006 compared to a profit in the same period in 2005. Operating earnings, which exclude non-recurring items, were down slightly from the prior year. The company maintained its full-year 2006 earnings guidance despite pressure from high oil prices impacting its synfuel operations. Capital investment projects across its utility and non-utility businesses remained on track.
DTE Energy reported a loss for the second quarter of 2006 compared to earnings in the same period in 2005. Operating earnings excluding special items were nearly break-even, with higher earnings from the electric utility offset by losses in other segments due to oil hedging costs and falling natural gas prices. Despite the quarterly loss, DTE maintained its full-year 2006 earnings guidance. Capital investment continued across all business segments to improve operations and support growth.
DTE Energy reported third quarter earnings of $0.96 per share, up from $0.51 per share in the third quarter of 2001, excluding merger and restructuring expenses. Year-to-date earnings increased 30% to $2.62 per share. The company's regulated utility operations performed well due to higher residential sales from increased cooling demand and lower fuel costs. Non-regulated businesses such as energy services also contributed significantly to earnings growth. Despite challenges in the industry, DTE Energy reaffirmed its 2002 earnings guidance of $3.75-$3.95 per share and 2003 guidance of $3.90-$4.10 per share, expecting continued cost controls to offset cost pressures.
Progress Energy reported its fourth quarter and full year 2003 financial results. For 2003, ongoing earnings were $3.56 per share and GAAP earnings were $3.30 per share. For Q4 2003, ongoing earnings were $0.82 per share and GAAP earnings were $0.42 per share. Progress Energy set its 2004 ongoing earnings guidance range at $3.50 to $3.65 per share. Significant events in 2003 included strong performance of the company's nuclear power plants, new franchise agreements in Florida, and receiving an emergency response award for its response to the 2002 ice storm.
Pepco Holdings, Inc. held an analyst conference on October 5-6, 2004 to discuss the company's performance. The presentation included an overview of PHI's businesses, strategy, and corporate governance practices. It noted PHI has $7.1 billion in revenues and focuses on its regulated electric and gas delivery business, which accounts for 72% of operating income. The Power Delivery segment was discussed, which includes the transmission and distribution of electricity to 1.8 million customers across several mid-Atlantic states.
The document discusses Joseph Rigby's presentation on the strategic positioning of Southeast Utilities. It summarizes the company's strategic focus on power delivery, Conectiv Energy, and Pepco Energy Services. It also outlines the goals for the power delivery business, including sales growth, infrastructure investment, operational excellence, and constructive regulatory outcomes to deliver average annual earnings growth of at least 4%. Key infrastructure projects are highlighted.
The document summarizes a presentation given by Joseph M. Rigby, CFO of Pepco Holdings, Inc. (PHI) at an investor conference on March 28, 2006. The presentation outlines PHI's strategy to remain a regional diversified energy delivery and competitive services company focused on operational excellence. It discusses PHI's power delivery business, Conectiv Energy, and Pepco Energy Services. The presentation also provides financial performance summaries and projections showing PHI's ability to cover dividends and capital expenditures with cash from operations.
The document provides an overview and summary of PHI's strategy and performance across its various business segments. PHI aims to remain a regional diversified energy delivery and competitive services company focused on value creation and operational excellence. Key aspects include achieving constructive regulatory outcomes and 4% annual earnings growth for its power delivery utilities, optimizing assets and market opportunities for Conectiv Energy, and expanding Pepco Energy Services into additional markets. Financial performance has been positively impacted by infrastructure investments and sales growth, though earnings have been reduced in some jurisdictions due to higher standard offer service pricing.
This document provides an overview of PHI and its strategy for positioning itself for success in a dynamic industry. PHI's strategy is to remain a diversified regional energy delivery and competitive services company focused on value creation and operational excellence. For its power delivery utility operations, PHI's goals are to operate with excellence, achieve constructive regulatory outcomes, invest in infrastructure, and deliver at least 4% annual average earnings growth. PHI's service territory has a robust economy that is less susceptible to downturns and includes diverse government and private sectors.
This document provides an overview of PHI's 41st EEI Financial Conference held from November 5-8, 2006. It includes sections on PHI's financial performance for Q3 and year-to-date 2006, drivers of performance, sales and customer trends, regulated distribution summaries, upcoming regulatory activities including transmission formula rate filings and rate cases, and PHI's proposed MAPP transmission project. Key highlights are lower sales due to mild weather, lower transmission revenue, and plans to file rate cases in late 2006/early 2007.
This document provides an overview and summary of Power Holdings Inc.'s (PHI) various business segments. It discusses PHI's regulated electric and gas delivery business, which accounts for 67% of operating income. It also summarizes Conectiv Energy's competitive merchant generation and load service business, which accounts for 33% of operating income. Key highlights from rate cases and recent regulatory activities involving PHI's delivery businesses are also provided. The document contains forward-looking statements and non-GAAP financial measures.
The document provides an overview of Pepco Holdings Inc.'s (PHI) power delivery business and regulatory environment. It summarizes PHI's sales and customer growth projections, infrastructure investment strategy including the proposed Mid-Atlantic Power Pathway transmission project and Blueprint for the Future initiative. Recent distribution rate case outcomes for PHI's utilities are also summarized. The document is intended as a presentation for investors on PHI's positioned for success through its regulated electric and gas delivery business.
The document provides an overview of Pepco Holdings Inc.'s (PHI) various businesses including its regulated electric and gas delivery business, competitive energy generation business, and energy services business. It discusses PHI's infrastructure investment strategies, the status of major projects like the Mid-Atlantic Power Pathway, and the company's regulatory environment. Financial projections show expectations for continued investment and growth across PHI's businesses.
The document discusses Pepco Holdings' strategic focus on infrastructure investments and customer programs to position the company for continued success. It outlines plans to invest $1.2 billion in the Mid-Atlantic Power Pathway transmission project through 2014 and $646 million in advanced metering infrastructure and other programs through the company's Blueprint for the Future initiative between 2008-2014. Regulatory support is essential for cost recovery for these investments, which aim to enhance reliability, manage costs and protect the environment for customers.
This document provides an overview of Pepco Holdings' transmission and distribution business. It discusses plans to invest over $5 billion from 2007-2012 to upgrade aging infrastructure and improve reliability. A key project is the $1.05 billion Mid-Atlantic Power Pathway, a 230-mile 500kV transmission line from Northern Virginia to Southern New Jersey to be completed by 2013. The presentation outlines the project timeline, environmental stewardship efforts, and cost recovery approach through PJM and FERC. It also reviews the company's focus on replacing aging transmission equipment to further enhance reliability.
The document provides an overview of Pepco Holdings, Inc.'s (PHI) strategy to build shareholder value. PHI aims to increase investment in infrastructure through its Blueprint programs to modernize its electric grid. It also plans growth for its competitive energy businesses, Conectiv Energy and Pepco Energy Services. PHI expects its regulated Power Delivery business to remain the primary driver of earnings, contributing 60-70% of operating income over the planning period through infrastructure investments and favorable regulatory outcomes.
This document provides an overview of Pepco Holdings, Inc.'s power delivery business. It discusses planned infrastructure investments totaling $4.99 billion from 2008-2012 to improve reliability, support load growth, and implement new technology. A key project is the $1.05 billion Mid-Atlantic Power Pathway transmission line. The document also reviews regulatory highlights, including recent rate cases, and outlines operational and financial summaries for the company's distribution and transmission businesses.
- Pepco Holdings held its annual meeting and provided its annual report to shareholders.
- In 2002, Pepco Holdings earned $210.5 million in consolidated earnings, or $1.61 per share. Earnings were driven by strong performance from regulated utility businesses and some competitive energy businesses.
- The letter discusses the company's strategy, leadership, and financial and operational performance across its various business segments in 2002. It also encourages shareholders to vote and continue supporting the company.
- Pepco Holdings provided its first annual report after merging Pepco and Conectiv in August 2002.
- In 2002, PHI earned $210.5 million, or $1.61 per share, on $4.3 billion in revenue. Excluding merger costs, earnings were $1.74 per share.
- The letter discusses the company's regulated utility and competitive energy businesses, noting stable earnings from utilities and growth potential from competitive businesses. It encourages shareholders to vote and thanks them for their confidence and investment.
This document provides a summary of Pepco Holdings' 2004 annual report and proxy statement. Key points include:
1) Pepco Holdings reported improved financial performance in 2004 with consolidated earnings of $258.7 million, up from $113.5 million in 2003, driven by improved performance of competitive energy businesses.
2) The company made progress on reducing debt and preferred stock by $480 million in 2004 and achieved a total shareholder return of over 22% for 2003-2004.
3) The regulated power delivery business continues as the primary focus and driver of steady cash flow. Earnings from this segment improved to $233.4 million in 2004.
4) Competitive energy businesses also posted
The document provides details on Pepco Holdings' 2003 performance and future plans. It discusses challenges faced in 2003 including an energy trading loss, Mirant's bankruptcy, and Hurricane Isabel. However, actions taken in 2003 such as divesting non-core businesses and reducing risk are expected to set the stage for future earnings growth. The company remains focused on strengthening its core power delivery business and improving customer satisfaction.
This document provides a summary of Pepco Holdings' 2004 annual report and proxy statement. Key points include:
1) Pepco Holdings reported improved financial performance in 2004 with consolidated earnings of $258.7 million, up from $113.5 million in 2003, driven by improved performance of competitive energy businesses.
2) The company made progress on reducing debt and preferred stock by $480 million in 2004 as part of its balance sheet improvement goals.
3) The regulated power delivery business continues as the primary focus due to its stability and cash generation. Earnings from this segment grew to $233.4 million in 2004.
4) Competitive energy businesses also posted profits in 2004 despite challenging markets
The document is the 2005 annual report and proxy statement from PHI (Pepco Holdings Inc.). It discusses PHI's strategy of focusing on stable power delivery and growing energy businesses. In 2005, PHI achieved earnings of $371.2 million and strengthened its balance sheet by paying down over $1 billion in debt. Rising energy prices present challenges for PHI and its customers. The proxy statement announces the annual meeting to elect directors and ratify the independent auditor.
Turin Startup Ecosystem 2024 - Ricerca sulle Startup e il Sistema dell'Innov...Quotidiano Piemontese
Turin Startup Ecosystem 2024
Una ricerca de il Club degli Investitori, in collaborazione con ToTeM Torino Tech Map e con il supporto della ESCP Business School e di Growth Capital
Solution Manual For Financial Accounting, 8th Canadian Edition 2024, by Libby...Donc Test
Solution Manual For Financial Accounting, 8th Canadian Edition 2024, by Libby, Hodge, Verified Chapters 1 - 13, Complete Newest Version Solution Manual For Financial Accounting, 8th Canadian Edition by Libby, Hodge, Verified Chapters 1 - 13, Complete Newest Version Solution Manual For Financial Accounting 8th Canadian Edition Pdf Chapters Download Stuvia Solution Manual For Financial Accounting 8th Canadian Edition Ebook Download Stuvia Solution Manual For Financial Accounting 8th Canadian Edition Pdf Solution Manual For Financial Accounting 8th Canadian Edition Pdf Download Stuvia Financial Accounting 8th Canadian Edition Pdf Chapters Download Stuvia Financial Accounting 8th Canadian Edition Ebook Download Stuvia Financial Accounting 8th Canadian Edition Pdf Financial Accounting 8th Canadian Edition Pdf Download Stuvia
where can I find a legit pi merchant onlineDOT TECH
Yes. This is very easy what you need is a recommendation from someone who has successfully traded pi coins before with a merchant.
Who is a pi merchant?
A pi merchant is someone who buys pi network coins and resell them to Investors looking forward to hold thousands of pi coins before the open mainnet.
I will leave the what'sapp contact of my personal pi merchant to trade with
+12349014282
How Non-Banking Financial Companies Empower Startups With Venture Debt Financing
DTE 1q2003
1. May 2, 2003
DTE ENERGY REPORTS FIRST QUARTER EARNINGS
DETROIT – DTE Energy Co. (NYSE: DTE) today reported first quarter 2003 earnings of
$155 million, or $0.92 per diluted share, compared with $200 million, or $1.24 per diluted share
last year. These earnings include several non-recurring items and accounting changes.
Operating earnings (which exclude non-recurring items, tax credit driven normalization,
discontinued operations, and cumulative effect of accounting changes) for the first quarter ended
March 31, 2003 were $178 million, or $1.06 per diluted share, which is comparable with
operating earnings of $181 million, or $1.12 per diluted share for the same period in 2002.
DTE Energy management believes that operating earnings provide a more meaningful
representation of the company’s earnings power from ongoing operations, and uses operating
earnings as the primary performance measurement for external communications with analysts
and investors regarding its earnings outlook and results. Internally, DTE Energy uses operating
earnings to measure performance against budget and to report to the DTE Energy Board of
Directors. The attached statements at the end of this release show, on an after tax-basis, the
specific items included in DTE Energy’s reported earnings, but excluded from operating
earnings.
“DTE Energy posted reasonable first quarter operating earnings versus last year, given
the uncertainties of the current market,” said Anthony F. Earley Jr., DTE Energy chairman and
CEO. “This quarter’s performance clearly illustrates the benefits of our business portfolio
approach.”
“Our non-regulated businesses showed another period of strong earnings, led by our coal-
based synthetic fuels business and energy trading,” he said. “This increase partially offset the
year-over-year cost pressures at our regulated electric and gas utilities. As I indicated at our
annual shareholders meeting, we will pursue a rate case to address these cost pressures with the
Michigan Public Service Commission for both Detroit Edison and MichCon. We plan on filing
the electric rate case this quarter and the gas rate case later this year.”
Operating earnings results for the first quarter of 2003, by business unit, were as follows:
• DTE Energy Resources earnings were $0.62 per share versus $0.69 per share in the first
quarter of 2002. The regulated operations of this business unit, which include the power
generation services of Detroit Edison, decreased $0.23 per share versus 2002. Favorable
weather impacts were offset by the cost of maintenance outages at several power plants
during the quarter and higher associated replacement power costs. The company
- more -
2. typically schedules much of its plant maintenance in the first or fourth quarters in
anticipation of the summer generating season. Higher employee pension and healthcare
benefit costs also contributed to the year-over-year decline. The non-regulated operations
of this business unit include the company’s energy services, energy marketing and
trading, coal services and landfill gas recovery (biomass) businesses. Non-regulated
operations contributed an incremental $0.16 per share versus 2002, largely due to higher
synthetic fuel production in the energy services operations and increased margins in
energy marketing and trading.
• DTE Energy Distribution contributed $0.03 per share versus $0.15 per share for the
same period last year. The regulated operations of this business unit include the electric
distribution services of Detroit Edison. These regulated operations experienced a year-
over-year decline of $0.12 per share, driven by increased costs for customer service
process improvements, and increased employee pension and healthcare benefit costs.
This was partially offset by lower maintenance expenses due to the absence of storms,
which negatively impacted the first quarter 2002. The non-regulated operations of this
business unit consist primarily of DTE Energy Technologies, which markets and
distributes a broad portfolio of distributed generation products and services. Earnings
decreased by $0.01 per share year-over-year for this business.
• DTE Energy Gas earnings for the first quarter 2003 increased to $0.50 per share versus
$0.37 per share the same period last year. The regulated operations include the gas
distribution services provided by Michigan Consolidated Gas Co. (MichCon). Regulated
operations were up $0.12 per share in the first quarter, driven by increased sales due to
colder weather, and partially offset by increased employee pension and healthcare benefit
costs. Non-regulated operations include the production of gas in northern Michigan and
the gathering, processing and storing of gas. The earnings of these operations increased
by $0.01 per share year-over-year.
• Corporate & Other includes interest costs, as well as certain non-regulated investments,
including assets held for sale, and in emerging energy technologies. For the first quarter
2003, Corporate & Other expenses were flat versus the same period last year.
“This is a challenging year, with several key drivers of our earnings, such as summer
weather and the pace of economic recovery, yet to play out,” Earley said. “Our business plan
remains on track, although we expect a change in the mix of earnings contributions from DTE
Energy’s businesses.”
“We anticipate lower full-year earnings from our regulated electric business, based on
first quarter results, as well as the costs associated with a catastrophic ice storm that hit our
service area last month and left more than 400,000 customers without power,” he said. “Our
non-regulated businesses, however, had a strong first quarter, and we believe that these
operations, led by our synthetic fuels business and energy trading operations, are poised to
outperform our original earnings expectations for the year.”
- more -
3. “Navigating the challenges of a soft economy and escalating cost pressures continues to
be a priority for DTE Energy,” Earley continued. “We have a committed management team,
dedicated employees, and a solid game plan in place to meet these challenges, and deliver
positive results.”
The company also clarified its 2003 operating earnings guidance. The previous 2003
operating earnings guidance, $3.90 - $4.10 per share, included the earnings from its transmission
business, with a business as usual assumption. Now that the transmission business has been sold,
it is classified as a discontinued operation and the associated 2003 earnings from this business
will not be in operating earnings. The company is maintaining its earnings guidance on a
comparable basis, but adjusting it to reflect the sale of the transmission business. As a result,
2003 operating earnings guidance is now $3.75 - $3.95 per share. The reconciliation of the
company’s 2003 operating earnings guidance to reported earnings can be found at the end of this
release.
David E. Meador, DTE Energy senior vice president and chief financial officer,
commented on other financial highlights of the quarter:
“In these uncertain times, we continue our commitment to financial stability and
responsible growth,” Meador said. “During the first quarter, we closed the sale of our
transmission business, and used a portion of proceeds from the sale to further strengthen an
already solid balance sheet. We also successfully issued $400 million in 30-year notes at
extremely attractive interest rates, demonstrating our ready access to the capital markets.”
“The company’s debt/equity ratio, at 51 percent, is well within our target range of 50 to
55 percent,” he continued. “DTE Energy remains a financially sound, well-positioned
company.”
This earnings announcement, as well as a package of detailed financial information, is
available on the company’s website at www.dteenergy.com in the “Investors” page.
DTE Energy will conduct a conference call with the investment community at 2:00 p.m.
EDT on Friday, May 2, to discuss first quarter earnings results. Investors, the news media and
the public may listen to a live Internet broadcast of the DTE Energy conference call at
www.dteenergy.com.
DTE Energy is a Detroit-based diversified energy company involved in the development
and management of energy-related businesses and services nationwide. DTE Energy's largest
operating subsidiaries are Detroit Edison, an electric utility serving 2.1 million customers in
Southeastern Michigan, and MichCon, a natural gas utility serving 1.2 million customers in
Michigan. Information about DTE Energy is available at www.dteenergy.com.
The information contained in this document is as of the date of this news release. DTE Energy expressly disclaims
any current intention to update any forward-looking statements contained in this document as a result of new
information or future events or developments. Words such as “anticipate,” “believe,” “expect,” “projected” and
“goals” signify forward-looking statements. Forward-looking statements are not guarantees of future results and
- more –
4. conditions but rather are subject to various assumptions, risks and uncertainties. This news release contains
forward-looking statements about DTE Energy’s financial results and estimates of future prospects, and actual
results may differ materially. Factors that may impact forward-looking statements include, but are not limited to,
timing and extent of changes in interest rates; access to the capital markets and capital market conditions and other
financing efforts which can be affected by credit agency ratings required; ability to utilize Section 29 tax credits or
sell interest in facilities producing such credits; the level of borrowings; the effects of weather and other natural
phenomena on operations and actual sales; economic climate and growth in the geographic areas in which DTE
Energy does business; unplanned outages; the cost of protecting assets against or damage due to terrorism; nuclear
regulations and risks associated with nuclear operations; changes in the cost of fuel, purchased power and natural
gas; the effects of competition; the implementation of electric and gas customer choice programs; the
implementation of electric and gas utility restructuring in Michigan; environmental issues, including changes in the
climate, and regulations, and the contributions to earnings by non-regulated businesses. This news release should
also be read in conjunction with the forward-looking statements in DTE Energy’s, MichCon’s and Detroit Edison’s
2002 Form 10-K Item 1, and in conjunction with other SEC reports filed by DTE Energy, MichCon and Detroit
Edison.
Members of the Media – For Further Information:
Lorie N. Kessler Len Singer
(313) 235-8807 (313) 235-8809
Analysts – For Further Information:
Investor Relations
(313) 235-8030
5. Reconciliation of DTE Energy 2003 Operating Earnings Guidance to Reported Earnings
2003 Operating Earnings Guidance $3.75 - $3.95
Net Impact of ITC Sale……………………. 0.44
Reserve for disallowance of gas costs….….. (0.10)
Contribution to DTE Energy Foundation….. (0.06)
Loss on Sale of Steam Heating Business….. (0.08)
FAS 143 Asset Retirement Obligations…… (0.07)
Other Non Strategic Asset Sales...………… 0.07
Total Adjustments 0.20
2003 Reported Earnings $3.95 – $4.15 *
* Diluted earnings per share calculation for US GAAP purposes is based on total net income.
6. DTE Energy Company
Segment Net Income (Unaudited)
2003 2002
Reported Operating Reported Operating
(in Millions) Earnings Adjustments Earnings Earnings Adjustments Earnings
Energy Resources
Regulated – Power Generation ........... $ 25 $ - $ 25 $ 61 $ - $ 61
Non-regulated
Energy Services .......................... 51 - 51 32 - 32
Energy Marketing & Trading ..... 44 (16 )A 28 18 - 18
Other............................................ - - - - - -
Total Non-regulated .................... 95 (16 ) 79 50 - 50
120 (16 ) 104 111 - 111
Energy Distribution
Regulated – Power Distribution .......... (4 ) 14 B 10 27 - 27
Non-regulated...................................... (4 ) - (4 ) (3 ) - (3 )
(8 ) 14 6 24 - 24
Energy Gas
Regulated – Gas Distribution.............. 59 17 C 76 54 - 54
Non-regulated...................................... 8 - 8 6 - 6
67 17 84 60 - 60
10 D
Corporate and Other ................................ (71 ) 45 E (16 ) (3 ) (11) E (14 )
(71 ) 55 (16 ) (3 ) (11) (14 )
Income from Continuing Operations
Regulated............................................. 80 31 111 142 - 142
Non-regulated ..................................... 28 39 67 50 (11 ) 39
108 70 178 192 (11 ) 181
Discontinued Operations - ITC
Income from operations ...................... 5 (5 )F - 8 (8 )F -
Gain on sale......................................... 69 (69 )G - - - -
74 (74 ) - 8 (8 ) -
Cumulative Effect of Accounting
Changes
Asset retirement obligations................ (11 ) 11 H - - - -
Energy trading activities ..................... (16 ) 16 I - - - -
(27 ) 27 - - - -
Net Income ................................................. $ 155 $ 23 $ 178 $ 200 $ (19 ) $ 181
Adjustments Key
A) Adjustment of EITF 98-10 accounting change........... Flowback of the cumulative effect of a change in accounting
principle from rescission of EITF Issue No. 98-10
B) Loss on sale of steam heating business ...................... Sold Detroit Edison steam heating business
C) Disallowance of gas costs.......................................... Reserve for the potential disallowance of MichCon 2002 gas
procurement costs
D) Contribution to DTE Energy Foundation .................. Used portion of ITC sale proceeds to fund the DTE Energy
Foundation
E) Tax credit driven normalization................................. Quarterly adjustment at DTE Energy to normalize its effective tax
rate. Annual results not impacted
F) Adjust for discontinued operations of ITC.................. Sold International Transmission Company
G) Gain on sale of ITC ................................................... Sold International Transmission Company
H) Asset retirement obligations ...................................... Cumulative effect of a change in accounting principle from adoption
of SFAS 143
I) Adjustment of EITF 98-10 accounting change ............ Cumulative effect of a change in accounting principle from rescission
of EITF Issue No. 98-10
7. DTE Energy Company
Segment Diluted Earnings Per Share (Unaudited)
2003 2002
Reported Operating Reported Operating
Earnings Adjustments Earnings Earnings Adjustments Earnings
Energy Resources
Regulated – Power Generation ........... $ 0.15 $ - $ 0.15 $ 0.38 $ - $ 0.38
Non-regulated
Energy Services .......................... 0.30 - 0.30 0.20 - 0.20
Energy Marketing & Trading ..... 0.26 (0.09 )A 0.17 0.11 - 0.11
Other............................................ - - - - - -
Total Non-regulated.................... 0.56 (0.09 ) 0.47 0.31 - 0.31
0.71 (0.09 ) 0.62 0.69 - 0.69
Energy Distribution
Regulated – Power Distribution .......... (0.02 ) 0.08 B 0.06 0.17 - 0.17
Non-regulated...................................... (0.03 ) - (0.03 ) (0.02 ) - (0.02 )
(0.05 ) 0.08 0.03 0.15 - 0.15
Energy Gas
Regulated – Gas Distribution.............. 0.35 0.10 C 0.45 0.33 - 0.33
Non-regulated...................................... 0.05 - 0.05 0.04 - 0.04
0.40 0.10 0.50 0.37 - 0.37
0.06 D
Corporate and Other ................................ (0.42 ) 0.27 E (0.09 ) (0.02 ) (0.07 )E (0.09 )
(0.42 ) 0.33 (0.09 ) (0.02 ) (0.07 ) (0.09 )
Income from Continuing Operations
Regulated............................................. 0.48 0.18 0.66 0.88 - 0.88
Non-regulated ..................................... 0.16 0.24 0.40 0.31 (0.07 ) 0.24
0.64 0.42 1.06 1.19 (0.07 ) 1.12
Discontinued Operations - ITC
Income from operations ...................... 0.03 (0.03 )F - 0.05 (0.05 )F -
Gain on sale......................................... 0.41 (0.41 )G - - - -
0.44 (0.44 ) - 0.05 (0.05 ) -
Cumulative Effect of Accounting
Changes
Asset retirement obligations................ (0.07 ) 0.07 H - - - -
Energy trading activities ..................... (0.09 ) 0.09 I - - - -
(0.16 ) 0.16 - - - -
Total ............................................................ $ 0.92 $ 0.14 $ 1.06 $ 1.24 $ (0.12 ) $ 1.12
Adjustments Key
A) Adjustment of EITF 98-10 accounting change............. Flowback of the cumulative effect of a change in accounting
principle from rescission of EITF Issue No. 98-10
B) Loss on sale of steam heating business ........................ Sold Detroit Edison steam heating business
C) Disallowance of gas costs............................................ Reserve for the potential disallowance of MichCon 2002 gas
procurement costs
D) Contribution to DTE Energy Foundation .................... Used portion of ITC sale proceeds to fund the DTE Energy
Foundation
E) Tax credit driven normalization................................... Quarterly adjustment at DTE Energy to normalize its effective tax
rate. Annual results not impacted
F) Adjust for discontinued operations of ITC.................... Sold International Transmission Company
G) Gain on sale of ITC ..................................................... Sold International Transmission Company
H) Asset retirement obligations ........................................ Cumulative effect of a change in accounting principle from adoption
of SFAS 143
I) Adjustment of EITF 98-10 accounting change ............. Cumulative effect of a change in accounting principle from rescission
of EITF Issue No. 98-10
8. DTE ENERGY COMPANY AND SUBSIDIARY COMPANIES
CONSOLIDATED STATEMENT OF OPERATIONS (PRELIMINARY/UNAUDITED)
(Dollars in Millions, Expect Per Share Amounts)
3 Months - March
2003 2002 % Change
Operating Revenues $ 2,095 $ 1,894 11%
Operating Expenses
Fuel, purchased power and gas $ 813 $ 727 12%
Operation and maintenance 755 551 37%
Depreciation, depletion and amortization 197 189 4%
Taxes other than income 97 93 4%
Total Operating Expenses $ 1,862 $ 1,560 19%
Operating Income $ 233 $ 334 -30%
Other Income and Deductions
Interest expense $ 133 $ 136 -2%
Preferred stock dividends of subsidiaries 6 8 -25%
Interest income (8) (5) 60%
Other income (13) (9) 44%
Other expenses 33 15 120%
Total Other Income and Deductions $ 151 $ 145 4%
Income Before Income Taxes $ 82 $ 189 -55%
Income Tax Benefit (26) (3) n/m
Income from Continuing Operations $ 108 $ 192 -44%
Significant Items Impacting Comparability
Operating earnings of ITC $ 5 $ 8 -38%
Gain on sale of ITC 69 - n/m
$ 74 $ 8 n/m
Cumulative Effect of Accounting Changes
Asset retirement obligations $ (11) $ - n/m
Energy trading activities (16) - n/m
$ (27) $ - n/m
Reported Net Income $ 155 $ 200 -23%
Reported Earnings per Diluted Share $ 0.92 $ 1.24 -26%
Significant Items Impacting Comparability
Unusual Items
Loss on Sale of Steam Heating Business 0.08 n/m
Contribution to DTE Energy Foundation 0.06 n/m
Disallowance of Gas Costs 0.10 n/m
Energy Trading Activities (EITF 98-10 flowback) (0.09) n/m
Effective Tax Rate Adjustment 0.27 (0.07) n/m
Discontinued Operations
Income from Operations (0.03) (0.05) -40%
Gain on Sale of Transmission Business (0.41) n/m
Cumulative Effect of Accounting Changes
Asset Retirement Obligations (FAS 143) 0.07 n/m
Energy Trading Activities (EITF 98-10 implementation) 0.09 n/m
Operating Earnings per Diluted Share $ 1.06 $ 1.12 -5%
Average Common Shares
Basic 167 161 4%
Diluted 168 161 4%
n/m - not meaningful
The Condensed Consolidated Statement of Income (Unaudited) should be read in conjunction with the Notes to
Consolidated Financial Statements appearing in the Annual Report to Shareholders, 10K, and 10Q.
DTE Income Statement p.8
9. DTE ENERGY COMPANY AND SUBSIDIARY COMPANIES
Earnings Variance Analysis (Preliminary/Unaudited)
Q1 2002 Reported Earnings per Share $1.24
Adjust for Q1 2002 Quarterly Effective Tax Rate Adjustment (0.07)
Adjust for discontinued operations - ITC earnings in Q1 2002 (0.05)
Q1 2002 Operating Earnings per Share $1.12
Regulated Electric
Gross Margin - wholesale prices (0.12)
Positive weather impact offset by higher purchase power costs and margin lost to
customer choice
O&M Expense - benefits, outage costs (0.26)
Higher benefits expenses, customer service improvements and timing-related
scheduling of power plant maintenance work
Depreciation - regulatory asset deferrals 0.05
Other (0.01)
Total Regulated Electric (0.34)
Regulated Gas
Gross Margin - weather related heating sales 0.09
O&M - higher benefit expenses (0.05)
Other - depreciation, interest and taxes 0.08
Total Regulated Gas 0.12
Non Regulated
Energy Services - primarily increase in synfuel production 0.11
Trading - increase in trading margins 0.05
Total Non-Regulated 0.16
Q1 2003 Operating Earnings per Share $1.06
Qtr-to-Qtr Variance p.9
10. Net Income Summary
(Preliminary/Unaudited)
Net Income ($millions) Reported Operating Operating
Q1 2003 Adjustments Q1 2003 Q1 2002 Variance
Energy Resources
Regulated - Power Generation $ 25 $ - $ 25 $ 61 $ (36)
Non-Regulated
Energy Services
Coal Based Fuels $ 56 $ - $ 56 $ 36 $ 20
On Site Energy Projects 2 - 2 2 -
Merchant Generation (4) - (4) (4) -
Other (3) - (3) (3) -
Coal Services 3 - 3 3 -
Biomass Energy 2 - 2 1 1
Energy Trading & CoEnergy Portfolio 44 (16) A 28 18 10
Energy Resources Overheads (5) - (5) (3) (2)
Total Energy Resources Non-Regulated $ 95 $ (16) $ 79 $ 50 $ 29
Total Energy Resources $ 120 $ (16) $ 104 $ 111 $ (7)
Energy Distribution
Regulated - Power Distribution $ (4) $ 14 B $ 10 $ 27 $ (17)
Non Regulated (Energy Technologies) (4) - (4) (3) (1)
Total Energy Distribution $ (8) $ 14 $ 6 $ 24 $ (18)
Energy Gas
Regulated $ 59 $ 17 C $ 76 $ 54 $ 22
Non-Regulated 8 - 8 6 2
Total Energy Gas $ 67 $ 17 $ 84 $ 60 $ 24
Holding Company & Other
Energy Technology Investments $ (3) $ - $ (3) $ (2) $ (1)
Other (68) 55 D,E (13) (12) (1)
Total Holding Company & Other $ (71) $ 55 $ (16) $ (14) $ (2)
Total
Regulated
Regulated Electric $ 21 $ 14 $ 35 $ 88 $ (53)
Regulated Gas 59 17 76 54 22
Non-Regulated* 96 (16) 80 53 27
Holding Company/Other (68) 55 (13) (14) 1
Total $ 108 $ 70 $ 178 $ 181 $ (3)
Discontinued Operations - ITC
Income from Operations $ 5 $ (5) F $ -
Gain on Sale $ 69 $ (69) F $ -
Cumulative Effect of Accounting Changes
Asset Retirement Obligations (FAS 143) $ (11) $ 11 G - - -
Energy Trading Activities (EITF 98-10
implementation cumulative effect) $ (16) $ 16 A - - -
Total Net Income $ 155 $ 23 $ 178 $ 181 $ (3)
Total EPS $ 0.92 $ 0.14 $ 1.06 $ 1.12 $ (0.06)
Diluted Shares Outstanding (millions) 168 168 161
* Includes Energy Technology Investments
Key:
A - Adjustment for rescission of EITF 98-10 Accounting Change (flow back)
B - Loss on sale of steam heating business
C - Disallowance of gas costs
D - Contribution to DTE Energy Foundation
E - Effective tax rate adjustment
F - Adjust for year-over-year ITC gain
G - FAS 143 Asset retirement obligations
Net Income Summary p.10
11. DTE ENERGY COMPANY
CONSOLIDATED STATEMENT OF FINANCIAL POSITION (PRELIMINARY/UNAUDITED)
(Dollars in Millions)
Mar. 31 Dec. 31 Percent LIABILITIES AND Mar. 31 Dec. 31 Percent
ASSETS 2003 2002 Change SHAREHOLDERS' EQUITY 2002 2002 Change
Current Assets Current Liabilities
Cash and cash equivalents $ 136 $ 133 2% Accounts payable $ 839 $ 647 30%
Restricted cash 90 237 -62% Accrued interest 120 115 4%
Accounts receivable Dividends payable 90 90 0%
Customer (less allow. for doubtful accounts of $89 and $82) 1,188 902 32% Accrued payroll 29 49 -41%
Accrued unbilled revenues 222 296 -25% Short-term borrowings 31 414 -93%
Other 318 237 34% Current portion long-term debt, including
Inventories capital leases 864 1,018 -15%
Fuel and gas 218 413 -47% Liab. from risk mgmt. and trading activities 417 284 47%
Materials and supplies 161 163 -1% Other 682 596 14%
Assets from risk management and trading activities 374 224 67% $ 3,072 $ 3,213 -4%
Other 178 159 12% Other Liabilities
$ 2,885 $ 2,764 4% Deferred income taxes $ 1,126 $ 916 23%
Regulatory liabilities 182 179 2%
Investments Asset retirement obligation 828 - n/m
Nuclear decommissioning trust funds $ 423 $ 417 1% Unamortized investment tax credit 165 168 -2%
Other 488 487 0% Liab. from risk mgmt. and trading activities 201 208 -3%
$ 911 $ 904 1% Liab. from transportation and storage contracts 508 523 -3%
Accrued pension liability 380 582 n/m
Property Nuclear decommissioning 54 416 -87%
Property, plant and equipment $ 17,895 $ 17,862 0% Other 721 683 6%
Less accumulated depreciation and depletion (8,237) (8,049) -2% $ 4,165 $ 3,675 13%
$ 9,658 $ 9,813 -2% Long-Term Debt
Mortgage bonds, notes and other $ 5,640 $ 5,656 0%
Securitization bonds 1,539 1,585 -3%
Other Assets Equity-linked securities 189 191 -1%
Goodwill $ 2,075 $ 2,119 -2% Capital lease obligations 81 82 -1%
Regulatory assets 2,057 1,197 72% $ 7,449 $ 7,514 -1%
Securitized regulatory assets 1,591 1,613 -1%
Assets from risk management and trading activities 162 152 8% Preferred Securities of Subsidiaries $ 271 $ 271 0%
Prepaid pension assets 175 172 2%
Other 515 504 2% Shareholders' Equity
$ 6,575 $ 5,757 3% Common stock $ 3,063 $ 3,052 0%
Retained earnings 2,206 2,132 3%
Accumulated other comprehensive loss (197) (619) -68%
$ 5,072 $ 4,565 11%
Total Assets $ 20,029 $ 19,238 4% Total Liabilities and Shareholders' Equity $ 20,029 $ 19,238 4%
The Condensed Consolidated Balance Sheet (Unaudited) should be read in conjunction with the
Notes to Consolidated Financial Statements appearing in the Annual Report to Shareholders, Form 10K, and 10Q.
n/m - not meaningful
DTE Balance Sheet p.11
12. Detroit Edison Company
Consolidated Statement of Operations (Preliminary/Unaudited)
(Dollars in Millions)
3 Months - March
2003 2002 % Change
Operating Revenues $ 937 $ 930 1%
Operating Expenses
Fuel and purchased power $ 247 $ 208 19%
Operation and maintenance 366 277 32%
Depreciation and amortization 135 148 -9%
Taxes other than income 73 71 3%
Total Operating Expenses $ 821 $ 704 17%
Operating Income $ 116 $ 226 -49%
Interest Expense and Other
Interest expense $ 75 $ 78 -4%
Interest Income - (1) n/m
Other income (11) (5) 120%
Other expenses 19 16 19%
Total Interest Expense and Other $ 83 $ 88 -6%
Income Before Income Taxes $ 33 $ 138 -76%
Income Tax Provision $ (12) $ (46) -74%
Income Before Accounting Change $ 21 $ 92 -77%
Cumulative Effect of Accounting Change (6) - n/m
Reported Net Income $ 15 $ 92 -84%
Cumulative Effect of Accounting Changes
Asset Retirement Obligations (FAS 143) 6 - n/m
Unusual Item
Loss on Sale of Steam Heating Business 14 - n/m
Operating Net Income $ 35 $ 92 -62%
The Condensed Consolidated Statement of Income (Unaudited) should be read in
conjunction with the Notes to Consolidated Financial Statements appearing in the Annual
Report to Shareholders, Form 10K, and Form 10Q.
n/m - not meaningful
Deco Inc. Statement p.12
13. Michigan Consolidated Gas Company
Consolidated Statement of Operations (Preliminary/Unaudited)
(Dollars in Millions)
3 Months - March
2003 2002 % Change
Operating Revenues $ 625 $ 590 6%
Operating Expenses
Cost of gas $ 421 $ 384 10%
Operation and maintenance 78 66 18%
Depreciation and amortization 25 27 -7%
Taxes other than income 17 17 0%
Total Operating Expenses $ 541 $ 494 10%
Operating Income $ 84 $ 96 -13%
Other Income and (Deductions)
Interest on long-term debt (14) (15) -7%
Interest income 2 3 -33%
Equity in earnings of joint ventures 1 1 0%
Other 1 (1) n/m
Total Other Income and (Deductions) $ (10) $ (12) -17%
Income Before Income Taxes $ 74 $ 84 -12%
Income Tax Provision 15 30 -50%
Reported Net Income $ 59 $ 54 9%
Unusual Item
Disallowance of gas costs 17 - n/m
Operating Net Income $ 76 $ 54 41%
The Condensed Consolidated Statement of Income (Unaudited) should be read in
conjunction with the Notes to Consolidated Financial Statements appearing in the
Annual Report to Shareholders, Form 10K, and Form 10Q.
n/m - not meaningful
MichCon Inc Statement p.13
14. Sales Analysis
Electric - Detroit Edison Service Area (MWh)
Q1 2003 Q1 2002 %
Residential 3,856 3,720 3.7%
Commercial 4,126 4,342 -5.0%
Industrial 3,085 3,333 -7.4%
Other 683 655 4.3%
TOTAL SYSTEM 11,750 12,050 -2.5%
Choice Sales 1,192 321 271.3%
TOTAL SALES 12,942 12,371 4.6%
Interconnection Sales 701 125 460.8%
(not included above)
Gas - MichCon Service Area (Mcf)
Q1 2003 Q1 2002 % Change
Residential 60,229,684 58,148,090 3.6%
Commercial 19,292,592 17,613,192 9.5%
Industrial 506,582 585,770 -13.5%
End Use Transportation 43,271,049 44,721,921 -3.2%
Choice - Residential 11,699,081 1,984,552 489.5%
Choice - Commercial 5,659,473 1,341,054 322.0%
Choice - Industrial 142,547 11,472 1142.6%
TOTAL SALES 140,801,008 124,406,051 13.2%
Weather
Heating Degree Days
Q1 2003 Q1 2002 % Change
Actuals 3,444 2,812 22%
Normal 3,216 3,216
Deviation from normal 7.1% -12.6%
Sales p.14