SlideShare a Scribd company logo
1 of 11
Download to read offline
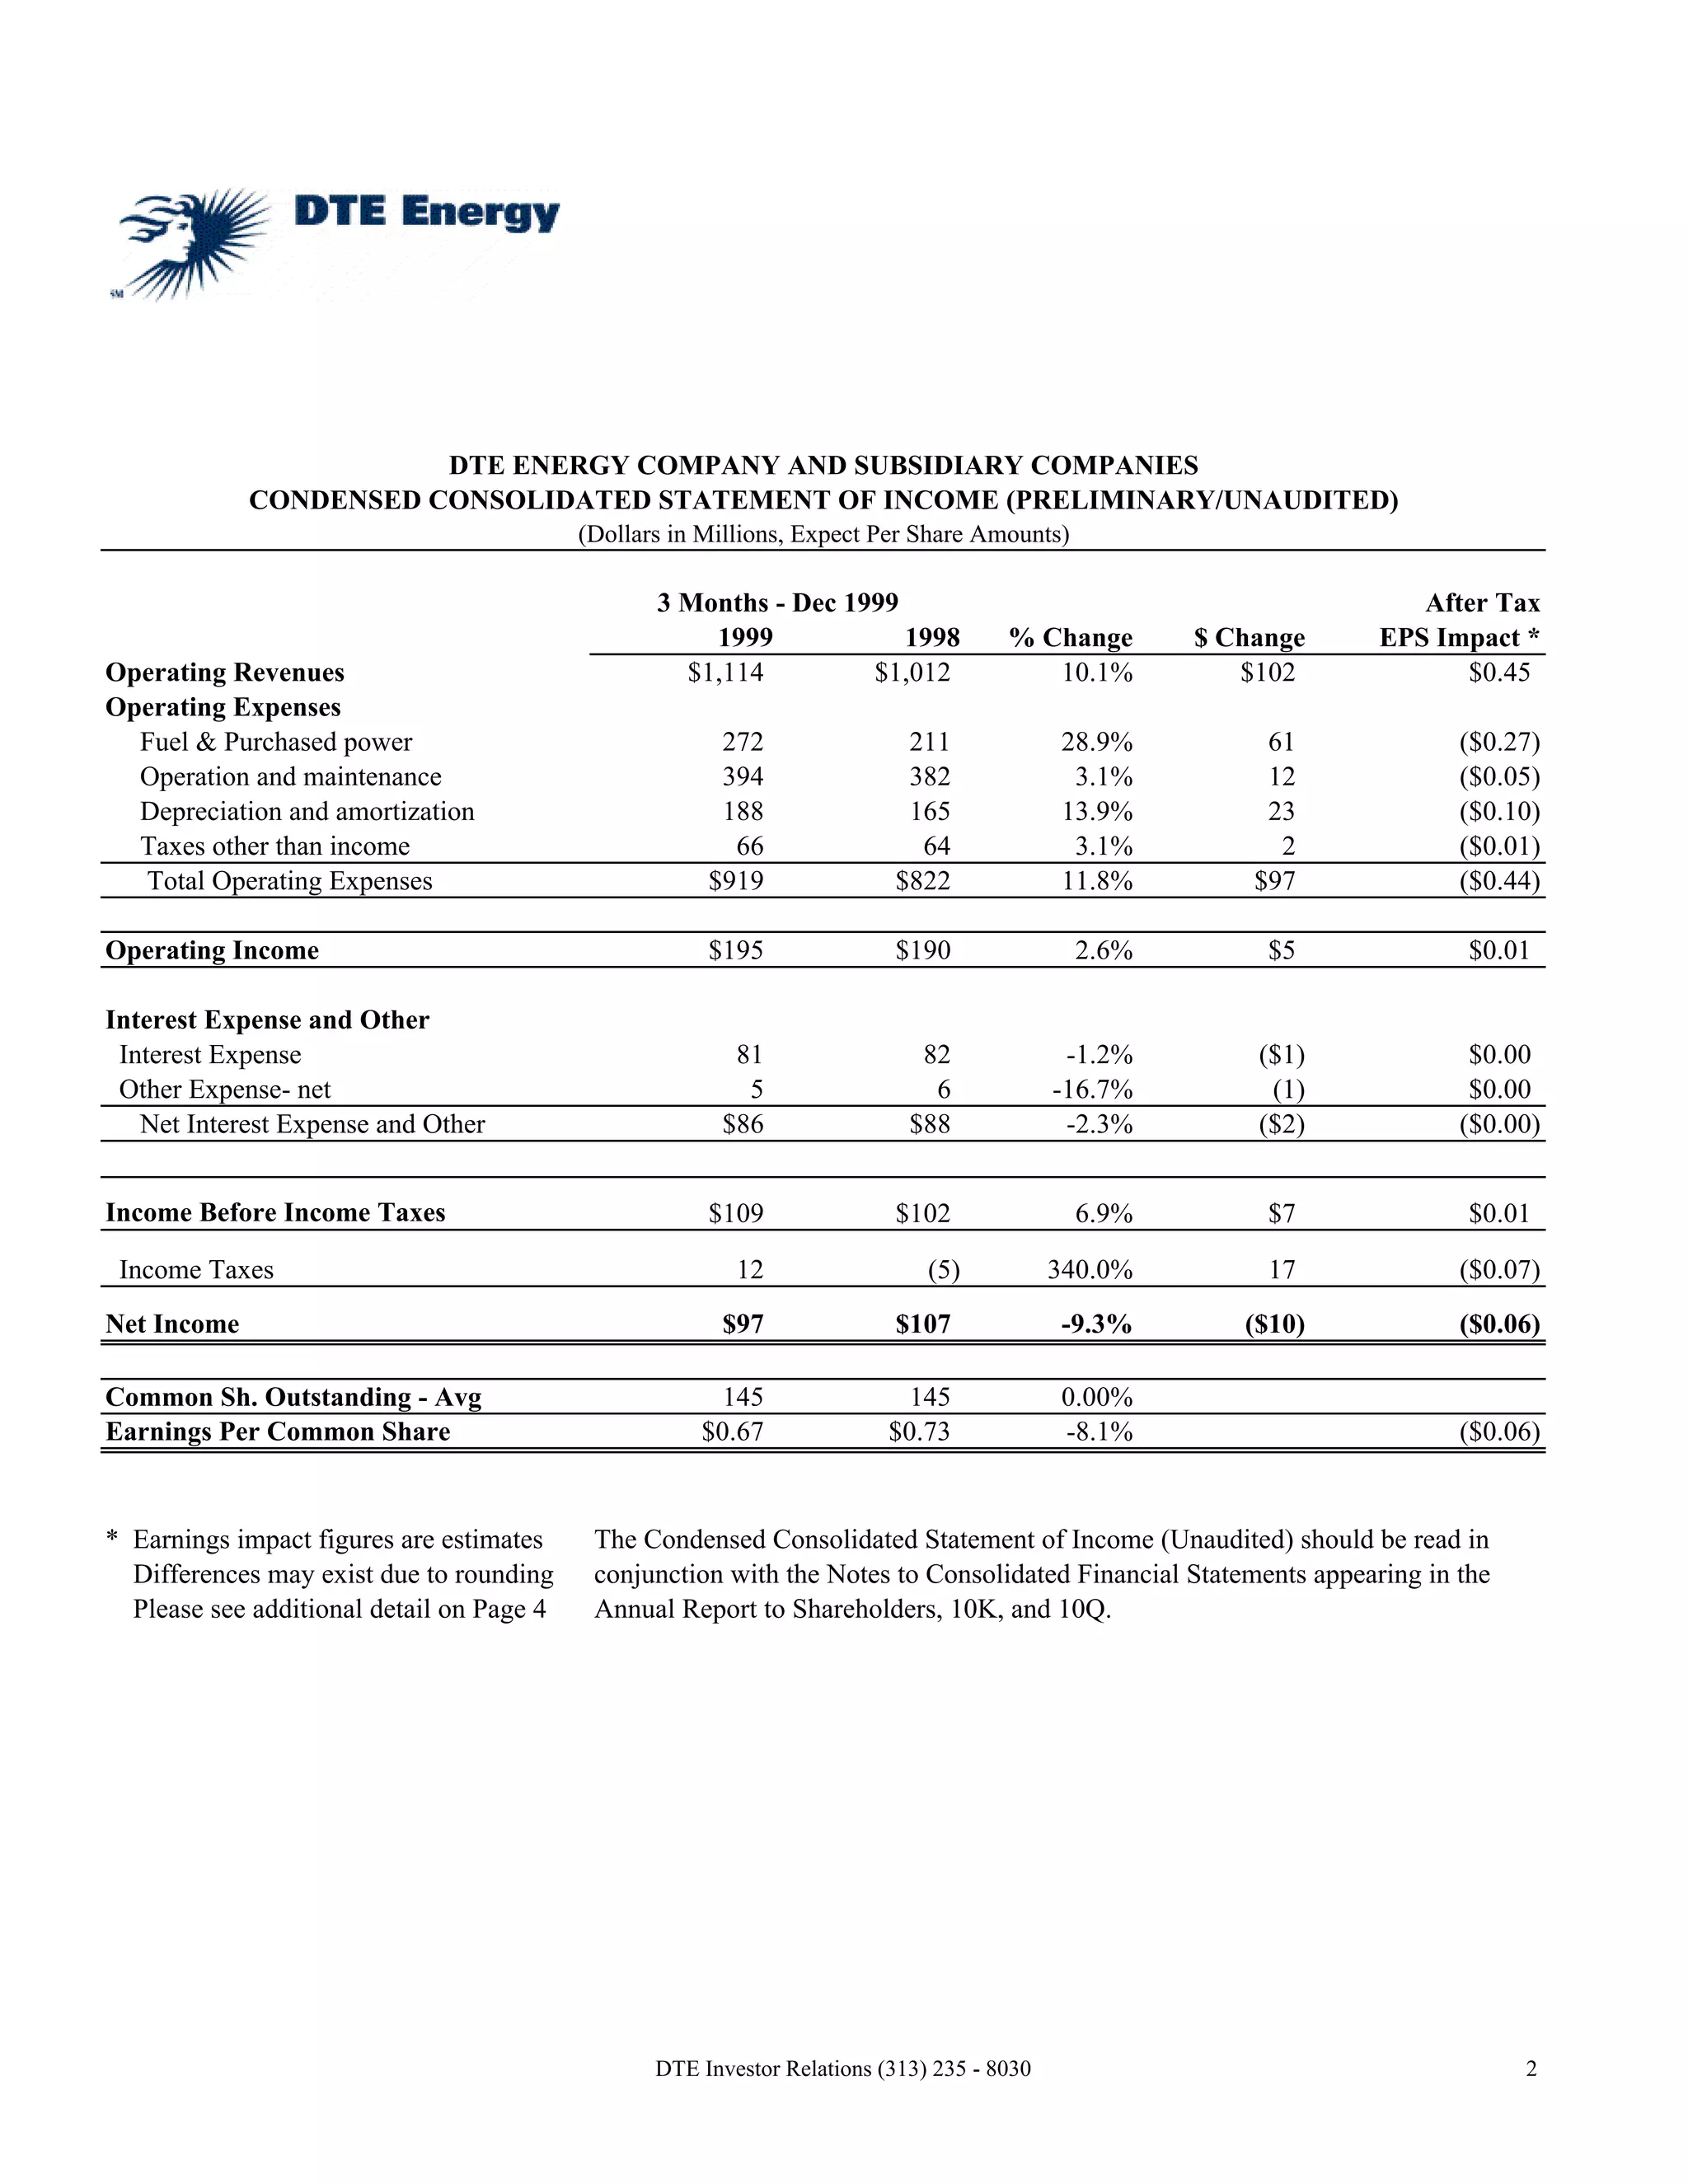
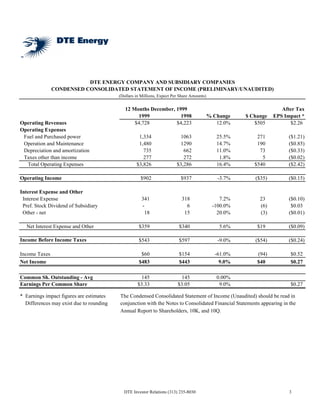
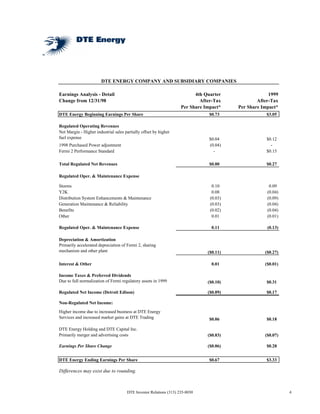
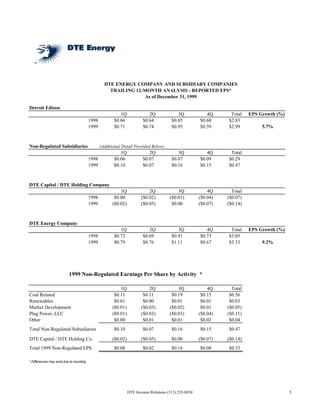
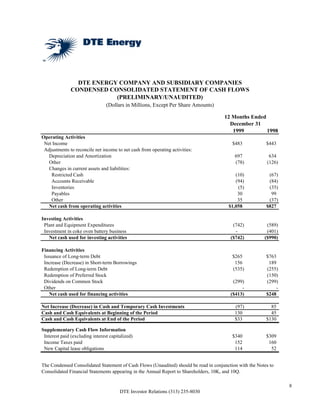
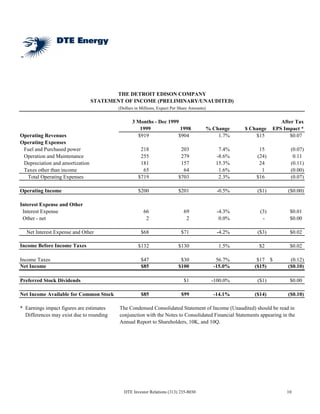
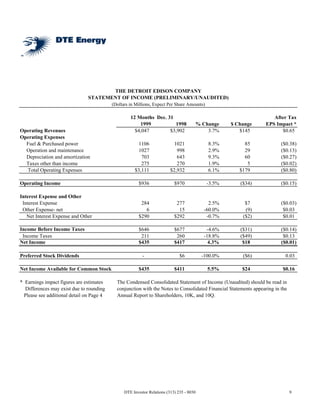
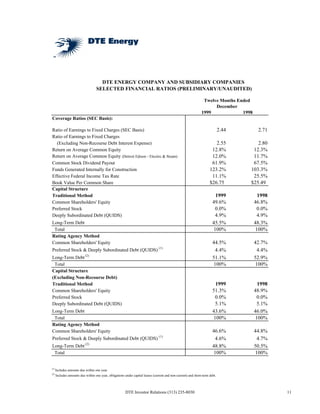
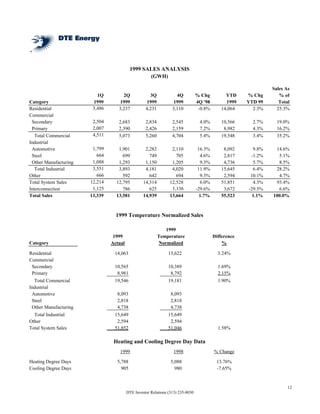
DTE ENERGY COMPANY AND SUBSIDIARY COMPANIES
             CONDENSED CONSOLIDATED STATEMENT OF INCOME (PRELIMINARY/UNAUDITED)
                                           (Dollars in Millions, Expect Per Share Amounts)

                                                  3 Months - Dec 1999                                               After Tax
                                                      1999            1998            % Change       $ Change    EPS Impact *
Operating Revenues                                  $1,114         $1,012                10.1%          $102           $0.45
Operating Expenses
  Fuel & Purchased power                                272                211              28.9%         61            ($0.27)
  Operation and maintenance                             394                382               3.1%         12            ($0.05)
  Depreciation and amortization                         188                165              13.9%         23            ($0.10)
  Taxes other than income                                66                 64               3.1%          2            ($0.01)
  Total Operating Expenses                             $919               $822              11.8%        $97            ($0.44)

Operating Income                                       $195               $190               2.6%         $5             $0.01

Interest Expense and Other
 Interest Expense                                        81                  82              -1.2%       ($1)            $0.00
 Other Expense- net                                       5                   6             -16.7%        (1)            $0.00
   Net Interest Expense and Other                       $86                 $88              -2.3%       ($2)           ($0.00)


Income Before Income Taxes                             $109               $102               6.9%         $7             $0.01

 Income Taxes                                             12                  (5)           340.0%        17            ($0.07)
Net Income                                              $97               $107              -9.3%       ($10)           ($0.06)

Common Sh. Outstanding - Avg                            145                 145             0.00%
Earnings Per Common Share                             $0.67               $0.73             -8.1%                       ($0.06)

                                                                                                                          -0.010
* Earnings impact figures are estimates     The Condensed Consolidated Statement of Income (Unaudited) should be read in
  Differences may exist due to rounding     conjunction with the Notes to Consolidated Financial Statements appearing in the
  Please see additional detail on Page 4    Annual Report to Shareholders, 10K, and 10Q.


                                                  DTE Investor Relations (313) 235 - 8030                                     2
DTE ENERGY COMPANY AND SUBSIDIARY COMPANIES
               CONDENSED CONSOLIDATED STATEMENT OF INCOME (PRELIMINARY/UNAUDITED)
                                          (Dollars in Millions, Expect Per Share Amounts)


                                             12 Months December, 1999                                                After Tax
                                                  1999             1998                     % Change   $ Change   EPS Impact *
Operating Revenues                               $4,728          $4,223                        12.0%      $505          $2.26
Operating Expenses
 Fuel and Purchased power                           1,334                 1063                 25.5%       271          ($1.21)
 Operation and Maintenance                          1,480                 1290                 14.7%       190          ($0.85)
 Depreciation and amortization                        735                   662                11.0%        73          ($0.33)
 Taxes other than income                              277                   272                 1.8%         5          ($0.02)
  Total Operating Expenses                         $3,826                $3,286                16.4%      $540          ($2.42)

Operating Income                                     $902                  $937                -3.7%      ($35)         ($0.15)

Interest Expense and Other
 Interest Expense                                     341                  318                  7.2%        23          ($0.10)
 Pref. Stock Dividend of Subsidiary                   -                      6               -100.0%        (6)          $0.03
 Other - net                                           18                   15                 20.0%        (3)         ($0.01)

  Net Interest Expense and Other                    $359                  $340                  5.6%       $19          ($0.09)

Income Before Income Taxes                          $543                  $597                 -9.0%      ($54)         ($0.24)

Income Taxes                                         $60                  $154                -61.0%       (94)         $0.52
Net Income                                          $483                  $443                  9.0%       $40          $0.27

Common Sh. Outstanding - Avg                         145                  145                  0.00%
Earnings Per Common Share                           $3.33                $3.05                  9.0%                    $0.27

* Earnings impact figures are estimates   The Condensed Consolidated Statement of Income (Unaudited) should be read in
  Differences may exist due to rounding   conjunction with the Notes to Consolidated Financial Statements appearing in the
                                          Annual Report to Shareholders, 10K, and 10Q.


                                            DTE Investor Relations (313) 235-8030                                       3
DTE ENERGY COMPANY AND SUBSIDIARY COMPANIES

Earnings Analysis - Detail                                                4th Quarter                 1999
Change from 12/31/98                                                        After-Tax            After-Tax
                                                                    Per Share Impact*    Per Share Impact*
DTE Energy Beginning Earnings Per Share                                         $0.73                $3.05

Regulated Operating Revenues
Net Margin - Higher industrial sales partially offset by higher
fuel expense                                                                    $0.04                $0.12
1998 Purchased Power adjustment                                                 (0.04)                 -
Fermi 2 Performance Standard                                                      -                  $0.15

Total Regulated Net Revenues                                                    $0.00                $0.27

Regulated Oper. & Maintenance Expense

Storms                                                                           0.10                 0.09
Y2K                                                                              0.08                (0.04)
Distribution System Enhancements & Maintenance                                  (0.03)               (0.09)
Generation Maintenance & Reliability                                            (0.03)               (0.04)
Benefits                                                                        (0.02)               (0.04)
Other                                                                            0.01                (0.01)

Regulated Oper. & Maintenance Expense                                            0.11                (0.13)

Depreciation & Amortization
Primarily accelerated depreciation of Fermi 2, sharing
mechanism and other plant                                                      ($0.11)              ($0.27)

Interest & Other                                                                 0.01               ($0.01)

Income Taxes & Preferred Dividends
Due to full normalization of Fermi regulatory assets in 1999                   ($0.10)               $0.31

Regulated Net Income (Detroit Edison)                                          ($0.09)               $0.17

Non-Regulated Net Income:
Higher income due to increased business at DTE Energy
Services and increased market gains at DTE Trading                              $0.06                $0.18

DTE Energy Holding and DTE Capital Inc.
Primarily merger and advertising costs                                         ($0.03)              ($0.07)

Earnings Per Share Change                                                      ($0.06)               $0.28


DTE Energy Ending Earnings Per Share                                            $0.67                $3.33

Differences may exist due to rounding.


                                      DTE Investor Relations (313) 235-8030                                   4
DTE ENERGY COMPANY AND SUBSIDIARY COMPANIES
                                                     TRAILING 12-MONTH ANALYSIS - REPORTED EPS*
                                                                  As of December 31, 1999

Detroit Edison
                                                           1Q               2Q               3Q             4Q      Total    EPS Growth (%)
                                          1998          $0.66            $0.64            $0.85          $0.68     $2.83
                                          1999          $0.71            $0.74            $0.95          $0.59     $2.99          5.7%


Non-Regulated Subsidiaries                       (Additional Detail Provided Below)
                                                           1Q               2Q               3Q             4Q      Total
                                          1998          $0.06            $0.07            $0.07          $0.09     $0.29
                                          1999          $0.10            $0.07            $0.16          $0.15     $0.47


DTE Capital / DTE Holding Company
                                                           1Q               2Q               3Q              4Q      Total
                                          1998          $0.00           ($0.02)          ($0.01)         ($0.04)   ($0.07)
                                          1999         ($0.02)          ($0.05)           $0.00          ($0.07)   ($0.14)


DTE Energy Company
                                                           1Q               2Q               3Q             4Q      Total    EPS Growth (%)
                                          1998          $0.72            $0.69            $0.91          $0.73     $3.05
                                          1999          $0.79            $0.76            $1.11          $0.67     $3.33          9.2%


                           1999 Non-Regulated Earnings Per Share by Activity *

                                                           1Q               2Q               3Q              4Q      Total
Coal Related                                            $0.11            $0.11            $0.19           $0.15     $0.56
Renewables                                              $0.01            $0.00            $0.01           $0.01     $0.03
Market Development                                     ($0.01)          ($0.03)          ($0.02)          $0.01    ($0.05)
Plug Power, LLC                                        ($0.01)          ($0.03)          ($0.03)         ($0.04)   ($0.11)
Other                                                   $0.00            $0.01            $0.01           $0.02     $0.04
Total Non-Regulated Subsidiaries                        $0.10            $0.07            $0.16          $0.15     $0.47

DTE Capital / DTE Holding Co.                          ($0.02)          ($0.05)           $0.00          ($0.07)   ($0.14)
Total 1999 Non-Regulated EPS                            $0.08            $0.02            $0.16          $0.08     $0.33

* Differences may exist due to rounding


                                                                 DTE Investor Relations (313) 235-8030                                        5
DTE ENERGY COMPANY AND SUBSIDIARY COMPANIES
       CONDENSED CONSOLIDATED BALANCE SHEET (PRELIMINARY/UNAUDITED)
                               (Dollars in Millions, Expect Per Share Amounts)

                                                                                                Percent
ASSETS                                                    Dec. 31, 1999       Dec. 31, 1998     Change
Current Assets
 Cash and Cash Equivalents                                          $32                 $131    -75.6%
 Restricted Cash                                                    131                  121      8.3%
 Acounts Receivable
    Customer (less allowance for doubtful
          accounts)                                                 388                  320     21.3%
    Accrued Unbilled Revenues                                       166                  153      8.5%
    Other                                                           144                  131      9.9%
 Inventories (at average cost)
  Fuel                                                              175                   171     2.3%
  Materials and Supplies                                            169                   166     1.8%
Assets from risk management activities                               67                    14   378.6%
Other                                                                38                    24    58.3%
  Total Current Assets                                           $1,310                $1,231     6.4%

Investments
 Nuclear Decommissioning Trust Funds                                361                  309     16.8%
 Other                                                              274                  261      5.0%
                                                                   $635                 $570     11.4%

Property
 Property, Plant and Equipment                                  11,755              11,121        5.7%
 Property under Capital Leases                                     222                 242       -8.3%
 Nuclear Fuel under Capital Lease                                  663                 659        0.6%
 Construction Work in Progress                                     106                 156      -32.1%
                                                               $12,746             $12,178        4.7%
Less Accumulated Depreciation & Amortization                     5,598               5,235        6.9%
                                                                 7,148               6,943        3.0%


Regulatory Assets                                                 2,935                 3,091    -5.0%

Other Assets                                                        288                  252     14.3%


Total Assets                                                   $12,316             $12,087        1.9%

The Condensed Consolidated Balance Sheet (Unaudited) should be read in conjunction with the
Notes to Consolidated Financial Statements appearing in the Annual Report to Shareholders, 10K, and 10Q.


                                               DTE Investor Relations (313) 235-8030                       6
DTE ENERGY COMPANY AND SUBSIDIARY COMPANIES
             CONDENSED CONSOLIDATED BALANCE SHEET (PRELIMINARY/UNAUDITED)
                                     (Dollars in Millions, Except Per Share Amounts)

                                                                                                       Percent
LIABILITIES                                                            Dec. 31, 1999   Dec. 31, 1998   Change
Current Liabilities
 Accounts Payable                                                               $273          $239      14.2%
 Accrued Interest                                                                 57            57        0.0%
 Dividends Payable                                                                75            75       -0.4%
 Accrued Payroll                                                                  97           101       -4.0%
 Short-term Borrowings                                                           387           231      67.5%
 Income taxes                                                                     61            69     -11.6%
 Current Portion Long-term Debt                                                  270           294       -8.2%
 Current Portion Capital Leases                                                   75           118     -36.4%
 Liability from Risk Management Activities                                        52            14     271.4%
 Other                                                                           257           194      32.5%
                                                                              $1,604        $1,392      15.2%

Other Liabilities
 Deferred Income Taxes                                                         1,925          1,888      2.0%
 Capital Leases                                                                  114            127    -10.2%
 Regulatory Liabilities                                                          262            293    -10.6%
 Other                                                                           564            493     14.4%
                                                                               2,865          2,801      2.3%

Long-Term Debt                                                                $3,938        $4,197      -6.2%

Shareholder's Equity
 Common Stock, without par value, 400,000,000 shares
     authorized, 145,045,159 and 145,071,317 issued and
     outstanding, respectively                                                 1,950         1,951       0.0%
 Retained Earnings                                                             1,959         1,747      12.1%
 Total Shareholder's Equity                                                   $3,909        $3,698       5.7%


Total Liabilities and Shareholder's Equity                                   $12,316       $12,087       1.9%

The Condensed Consolidated Balance Sheet (Unaudited) should be read in conjunction with the Notes to
Consolidated Financial Statements appearing in the Annual Report to Shareholders, 10K, and 10Q.


                                             DTE Investor Relations (313) 235-8030                          7
DTE ENERGY COMPANY AND SUBSIDIARY COMPANIES
               CONDENSED CONSOLIDATED STATEMENT OF CASH FLOWS
                           (PRELIMINARY/UNAUDITED)
                                 (Dollars in Millions, Except Per Share Amounts)

                                                                                      12 Months Ended
                                                                                        December 31
                                                                                         1999         1998
Operating Activities
 Net Income                                                                               $483            $443
 Adjustments to reconcile net income to net cash from operating activities:
   Depreciation and Amortization                                                           697             634
   Other                                                                                   (78)           (126)
   Changes in current assets and liabilities:
    Restricted Cash                                                                        (10)            (67)
    Accounts Receivable                                                                    (94)            (84)
    Inventories                                                                             (5)            (35)
    Payables                                                                                30              99
    Other                                                                                   35             (37)
   Net cash from operating activities                                                   $1,058            $827

Investing Activities
 Plant and Equipment Expenditures                                                         (742)           (589)
 Investment in coke oven battery business                                                  -              (401)
   Net cash used for investing activities                                                ($742)          ($990)

Financing Activities
 Issuance of Long-term Debt                                                               $265            $763
 Increase (Decrease) in Short-term Borrowings                                              156             189
 Redemption of Long-term Debt                                                             (535)           (255)
 Redemption of Preferred Stock                                                                            (150)
 Dividends on Common Stock                                                                (299)           (299)
 Other                                                                                        -                -
    Net cash used for financing activities                                               ($413)           $248

Net Increase (Decrease) in Cash and Temporary Cash Investments                             (97)             85
Cash and Cash Equivalents at Beginning of the Period                                       130              45
Cash and Cash Equivalents at End of the Period                                             $33            $130

Supplementary Cash Flow Information
 Interest paid (excluding interest capitalized)                                           $340            $309
 Income Taxes paid                                                                         152             160
 New Capital lease obligations                                                             114              52


The Condensed Consolidated Statement of Cash Flows (Unaudited) should be read in conjunction with the Notes to
Consolidated Financial Statements appearing in the Annual Report to Shareholders, 10K, and 10Q.

                                                                                                                   8
                                        DTE Investor Relations (313) 235-8030
THE DETROIT EDISON COMPANY
                                 STATEMENT OF INCOME (PRELIMINARY/UNAUDITED)
                                          (Dollars in Millions, Expect Per Share Amounts)


                                                 3 Months - Dec 1999                                                After Tax
                                                    1999             1998               % Change      $ Change   EPS Impact *
Operating Revenues                                 $919             $904                    1.7%          $15          $0.07
Operating Expenses
 Fuel and Purchased power                            218                   203                7.4%         15           (0.07)
 Operation and Maintenance                           255                   279               -8.6%        (24)           0.11
 Depreciation and amortization                       181                   157               15.3%         24           (0.11)
 Taxes other than income                              65                    64                1.6%          1           (0.00)
  Total Operating Expenses                          $719                  $703                2.3%        $16           (0.07)

Operating Income                                    $200                  $201                -0.5%       ($1)         ($0.00)

Interest Expense and Other
 Interest Expense                                      66                    69               -4.3%        (3)         $0.01
 Other - net                                            2                     2                0.0%         -          $0.00

  Net Interest Expense and Other                      $68                  $71                -4.2%       ($3)         $0.02

Income Before Income Taxes                          $132                  $130                1.5%         $2          $0.02

Income Taxes                                          $47                  $30               56.7%        $17 $         (0.12)
Net Income                                            $85                 $100              -15.0%       ($15)         ($0.10)

Preferred Stock Dividends                                                    $1             -100.0%       ($1)         $0.00

Net Income Available for Common Stock                 $85                  $99              -14.1%       ($14)         ($0.10)

* Earnings impact figures are estimates   The Condensed Consolidated Statement of Income (Unaudited) should be read in
  Differences may exist due to rounding   conjunction with the Notes to Consolidated Financial Statements appearing in the
                                          Annual Report to Shareholders, 10K, and 10Q.


                                             DTE Investor Relations (313) 235-8030                                    10
THE DETROIT EDISON COMPANY
                                STATEMENT OF INCOME (PRELIMINARY/UNAUDITED)
                                           (Dollars in Millions, Expect Per Share Amounts)

                                                    12 Months Dec. 31                                                 After Tax
                                                        1999          1998             % Change      $ Change      EPS Impact *
Operating Revenues                                    $4,047        $3,902                 3.7%         $145             $0.65
Operating Expenses
  Fuel & Purchased power                                1106                1021             8.3%         85              ($0.38)
  Operation and maintenance                             1027                 998             2.9%         29              ($0.13)
  Depreciation and amortization                          703                 643             9.3%         60              ($0.27)
  Taxes other than income                                275                 270             1.9%          5              ($0.02)
  Total Operating Expenses                            $3,111              $2,932             6.1%       $179              ($0.80)

Operating Income                                        $936                $970             -3.5%      ($34)             ($0.15)

Interest Expense and Other
 Interest Expense                                        284                 277              2.5%        $7              ($0.03)
 Other Expense- net                                        6                  15            -60.0%        (9)              $0.03
   Net Interest Expense and Other                       $290                $292             -0.7%       ($2)              $0.01

Income Before Income Taxes                              $646                $677             -4.6%      ($31)             ($0.14)
 Income Taxes                                            211                 260            -18.8%      ($49)              $0.13
Net Income                                              $435                $417              4.3%       $18              ($0.01)

Preferred Stock Dividends                                 -                    $6          -100.0%       ($6)               0.03

Net Income Available for Common Stock                   $435                $411             5.5%        $24               $0.16

* Earnings impact figures are estimates      The Condensed Consolidated Statement of Income (Unaudited) should be read in
  Differences may exist due to rounding      conjunction with the Notes to Consolidated Financial Statements appearing in the
  Please see additional detail on Page 4     Annual Report to Shareholders, 10K, and 10Q.


                                                 DTE Investor Relations (313) 235 - 8030                                        9
DTE ENERGY COMPANY AND SUBSIDIARY COMPANIES
                                   SELECTED FINANCIAL RATIOS (PRELIMINARY/UNAUDITED)

                                                                                                                 Twelve Months Ended
                                                                                                                      December
                                                                                                                1999             1998
Coverage Ratios (SEC Basis):

                                                                                                                              2.44       2.71
Ratio of Earnings to Fixed Charges (SEC Basis)
Ratio of Earnings to Fixed Charges
                                                                                                                         2.55           2.80
  (Excluding Non-Recourse Debt Interest Expense)
                                                                                                                       12.8%          12.3%
Return on Average Common Equity
                                                                                                                       12.0%          11.7%
Return on Average Common Equity (Detroit Edison - Electirc & Steam)
                                                                                                                       61.9%          67.5%
Common Stock Dividend Payout
                                                                                                                      123.2%         103.3%
Funds Generated Internally for Construction
                                                                                                                       11.1%          25.5%
Effective Federal Income Tax Rate
                                                                                                                      $26.75         $25.49
Book Value Per Common Share
Capital Structure
                                                                                                                         1999            1998
Traditional Method
                                                                                                                        49.6%           46.8%
Common Shareholders' Equity
                                                                                                                         0.0%            0.0%
Preferred Stock
                                                                                                                         4.9%            4.9%
Deeply Subordinated Debt (QUIDS)
                                                                                                                        45.5%           48.3%
Long-Term Debt
                                                                                                                        100%            100%
 Total
Rating Agency Method
                                                                                                                        44.5%           42.7%
Common Shareholders' Equity
                                                                                 (1)
                                                                                                                         4.4%            4.4%
Preferred Stock & Deeply Subordinated Debt (QUIDS)
Long-Term Debt (2)                                                                                                      51.1%           52.9%
                                                                                                                        100%            100%
 Total
Capital Structure
(Excluding Non-Recourse Debt)
                                                                                                                         1999            1998
Traditional Method
                                                                                                                        51.3%           48.9%
Common Shareholders' Equity
                                                                                                                         0.0%            0.0%
Preferred Stock
                                                                                                                         5.1%            5.1%
Deeply Subordinated Debt (QUIDS)
                                                                                                                        43.6%           46.0%
Long-Term Debt
                                                                                                                        100%            100%
 Total
Rating Agency Method
                                                                                                                        46.6%           44.8%
Common Shareholders' Equity
Preferred Stock & Deeply Subordinated Debt (QUIDS) (1)                                                                   4.6%            4.7%
Long-Term Debt (2)                                                                                                      48.8%           50.5%
                                                                                                                        100%            100%
 Total


(1)
      Includes amounts due within one year.
(2)
      Includes amounts due within one year, obligations under capital leases (current and non-current) and short-term debt.


                                                        DTE Investor Relations (313) 235-8030                                                   11
1999 SALES ANALYSIS
                                                      (GWH)

                                                                                                                Sales As
                          1Q         2Q              3Q             4Q           % Chg          YTD    % Chg       % of
Category                1999        1999            1999           1999          4Q '98         1999   YTD 99      Total
                        3,486
Residential                        3,237           4,231          3,110           -0.8%       14,064     2.3%     25.3%
Commercial
                        2,504
 Secondary                         2,683           2,834          2,545           4.0%        10,566     2.7%     19.0%
                        2,007
 Primary                           2,390           2,426          2,159           7.2%         8,982     4.3%     16.2%
                        4,511
   Total Commercial                5,073           5,260          4,704           5.4%        19,548     3.4%     35.2%
Industrial
                        1,799
 Automotive                        1,901           2,282         2,110            16.3%        8,092     9.8%    14.6%
                          664
 Steel                               699             749           705             4.6%        2,817    -1.2%     5.1%
                        1,088
 Other Manufacturing               1,293           1,150         1,205             9.3%        4,736     5.7%     8.5%
                        3,551
   Total Industrial                3,893           4,181         4,020            11.9%       15,645     6.4%    28.2%
                          666
Other                                592             642           694             9.3%        2,594    10.1%     4.7%
                       12,214
Total System Sales                12,795          14,314        12,528             6.0%       51,851     4.3%    93.4%
                        1,125                                    1,136
Interconnection                      786             625                         -29.6%        3,672   -29.5%     6.6%
Total Sales            13,339     13,581          14,939        13,664             1.7%       55,523     1.1%   100.0%


                                  1999 Temperature Normalized Sales

                                                               1999
                                 1999                      Temperature                    Difference
Category                        Actual                      Normalized                        %

Residential                      14,063                         13,622                      3.24%
Commercial
 Secondary                       10,565                         10,389                      1.69%
 Primary                          8,981                          8,792                      2.15%
  Total Commercial               19,546                         19,181                      1.90%
Industrial
 Automotive                       8,093                          8,093
 Steel                            2,818                          2,818
 Other Manufacturing              4,738                          4,738
  Total Industrial               15,649                         15,649
Other                             2,594                          2,594
Total System Sales               51,852                         51,046                      1.58%

                                 Heating and Cooling Degree Day Data
                                    1999                          1998                    % Change

Heating Degree Days               5,788                          5,088                     13.76%
Cooling Degree Days                 905                            980                     -7.65%


                                                                                                                       12
                                         DTE Investor Relations (313) 235-8030

More Related Content

What's hot

supplemental_toolkit
supplemental_toolkitsupplemental_toolkit
supplemental_toolkitfinance28
 
CLOrox 1%20Consolidated%20Earnings,%20Segment%20Information%20and%20Consoli...
CLOrox   1%20Consolidated%20Earnings,%20Segment%20Information%20and%20Consoli...CLOrox   1%20Consolidated%20Earnings,%20Segment%20Information%20and%20Consoli...
CLOrox 1%20Consolidated%20Earnings,%20Segment%20Information%20and%20Consoli...finance48
 
conoco phillips 2006Fourth Quarter
conoco phillips 2006Fourth Quarterconoco phillips 2006Fourth Quarter
conoco phillips 2006Fourth Quarterfinance1
 
danaher 08_1Q_Release
danaher 08_1Q_Releasedanaher 08_1Q_Release
danaher 08_1Q_Releasefinance24
 

What's hot (6)

dte_020730a
dte_020730adte_020730a
dte_020730a
 
supplemental_toolkit
supplemental_toolkitsupplemental_toolkit
supplemental_toolkit
 
dte_1q2001
dte_1q2001dte_1q2001
dte_1q2001
 
CLOrox 1%20Consolidated%20Earnings,%20Segment%20Information%20and%20Consoli...
CLOrox   1%20Consolidated%20Earnings,%20Segment%20Information%20and%20Consoli...CLOrox   1%20Consolidated%20Earnings,%20Segment%20Information%20and%20Consoli...
CLOrox 1%20Consolidated%20Earnings,%20Segment%20Information%20and%20Consoli...
 
conoco phillips 2006Fourth Quarter
conoco phillips 2006Fourth Quarterconoco phillips 2006Fourth Quarter
conoco phillips 2006Fourth Quarter
 
danaher 08_1Q_Release
danaher 08_1Q_Releasedanaher 08_1Q_Release
danaher 08_1Q_Release
 

Viewers also liked

dollar general Bylaws
dollar general Bylawsdollar general Bylaws
dollar general Bylawsfinance41
 
DTE 5DBEB8D2-890F-4BE8-8D8C-7A7CFEBEF156_DTE_2008_Supplemental_Financial_Inf...
DTE  5DBEB8D2-890F-4BE8-8D8C-7A7CFEBEF156_DTE_2008_Supplemental_Financial_Inf...DTE  5DBEB8D2-890F-4BE8-8D8C-7A7CFEBEF156_DTE_2008_Supplemental_Financial_Inf...
DTE 5DBEB8D2-890F-4BE8-8D8C-7A7CFEBEF156_DTE_2008_Supplemental_Financial_Inf...finance41
 
DTE_2q07_Supp
DTE_2q07_SuppDTE_2q07_Supp
DTE_2q07_Suppfinance41
 
dte_1Q07Supp
dte_1Q07Suppdte_1Q07Supp
dte_1Q07Suppfinance41
 
DTE_4Q2007_Supp
DTE_4Q2007_SuppDTE_4Q2007_Supp
DTE_4Q2007_Suppfinance41
 
dollar general annual reports 2003
dollar general annual reports 2003dollar general annual reports 2003
dollar general annual reports 2003finance41
 
yrc worldwide2q04_stats
yrc worldwide2q04_statsyrc worldwide2q04_stats
yrc worldwide2q04_statsfinance41
 
dte Midyear_Business_Update
dte Midyear_Business_Updatedte Midyear_Business_Update
dte Midyear_Business_Updatefinance41
 
yrc worldwide4q04_stats
yrc worldwide4q04_statsyrc worldwide4q04_stats
yrc worldwide4q04_statsfinance41
 
phi proxystatement2005report
phi proxystatement2005reportphi proxystatement2005report
phi proxystatement2005reportfinance41
 
yrc worldwide041q_04
yrc worldwide041q_04yrc worldwide041q_04
yrc worldwide041q_04finance41
 
dollar general annual reports 2007
dollar general annual reports 2007dollar general annual reports 2007
dollar general annual reports 2007finance41
 
DTE_4Q07_earnings
DTE_4Q07_earningsDTE_4Q07_earnings
DTE_4Q07_earningsfinance41
 
DTE_Q12008_Supp_v2
DTE_Q12008_Supp_v2DTE_Q12008_Supp_v2
DTE_Q12008_Supp_v2finance41
 
DTE investor_doc
DTE investor_docDTE investor_doc
DTE investor_docfinance41
 
DTE_3Q07_Supp
DTE_3Q07_SuppDTE_3Q07_Supp
DTE_3Q07_Suppfinance41
 

Viewers also liked (18)

dte_q206er
dte_q206erdte_q206er
dte_q206er
 
dollar general Bylaws
dollar general Bylawsdollar general Bylaws
dollar general Bylaws
 
DTE 5DBEB8D2-890F-4BE8-8D8C-7A7CFEBEF156_DTE_2008_Supplemental_Financial_Inf...
DTE  5DBEB8D2-890F-4BE8-8D8C-7A7CFEBEF156_DTE_2008_Supplemental_Financial_Inf...DTE  5DBEB8D2-890F-4BE8-8D8C-7A7CFEBEF156_DTE_2008_Supplemental_Financial_Inf...
DTE 5DBEB8D2-890F-4BE8-8D8C-7A7CFEBEF156_DTE_2008_Supplemental_Financial_Inf...
 
DTE_2q07_Supp
DTE_2q07_SuppDTE_2q07_Supp
DTE_2q07_Supp
 
dte_1Q07Supp
dte_1Q07Suppdte_1Q07Supp
dte_1Q07Supp
 
DTE_4Q2007_Supp
DTE_4Q2007_SuppDTE_4Q2007_Supp
DTE_4Q2007_Supp
 
dollar general annual reports 2003
dollar general annual reports 2003dollar general annual reports 2003
dollar general annual reports 2003
 
yrc worldwide2q04_stats
yrc worldwide2q04_statsyrc worldwide2q04_stats
yrc worldwide2q04_stats
 
dte Midyear_Business_Update
dte Midyear_Business_Updatedte Midyear_Business_Update
dte Midyear_Business_Update
 
yrc worldwide4q04_stats
yrc worldwide4q04_statsyrc worldwide4q04_stats
yrc worldwide4q04_stats
 
phi proxystatement2005report
phi proxystatement2005reportphi proxystatement2005report
phi proxystatement2005report
 
yrc worldwide041q_04
yrc worldwide041q_04yrc worldwide041q_04
yrc worldwide041q_04
 
dollar general annual reports 2007
dollar general annual reports 2007dollar general annual reports 2007
dollar general annual reports 2007
 
DTE_4Q07_earnings
DTE_4Q07_earningsDTE_4Q07_earnings
DTE_4Q07_earnings
 
DTE_Q12008_Supp_v2
DTE_Q12008_Supp_v2DTE_Q12008_Supp_v2
DTE_Q12008_Supp_v2
 
dte_3Q06ER
dte_3Q06ERdte_3Q06ER
dte_3Q06ER
 
DTE investor_doc
DTE investor_docDTE investor_doc
DTE investor_doc
 
DTE_3Q07_Supp
DTE_3Q07_SuppDTE_3Q07_Supp
DTE_3Q07_Supp
 

Similar to dte_4q1999

CLX0502-1980616518a
CLX0502-1980616518aCLX0502-1980616518a
CLX0502-1980616518afinance48
 
monsanto supplemental_toolkit
monsanto supplemental_toolkitmonsanto supplemental_toolkit
monsanto supplemental_toolkitfinance28
 
.monsanto supplemental_toolkit
.monsanto  supplemental_toolkit.monsanto  supplemental_toolkit
.monsanto supplemental_toolkitfinance28
 
monsanto supplemental_toolkit
monsanto  supplemental_toolkitmonsanto  supplemental_toolkit
monsanto supplemental_toolkitfinance28
 
.monsanto supplemental_toolkit
.monsanto  supplemental_toolkit.monsanto  supplemental_toolkit
.monsanto supplemental_toolkitfinance28
 
monsanto supplemental_toolkit
monsanto supplemental_toolkitmonsanto supplemental_toolkit
monsanto supplemental_toolkitfinance28
 
CLX0201_1_Balance_Sheets-159159
CLX0201_1_Balance_Sheets-159159CLX0201_1_Balance_Sheets-159159
CLX0201_1_Balance_Sheets-159159finance48
 
CLOrox 1%20Consolidated%20Earnings,%20Segment%20Information%20and%20Consoli...
CLOrox   1%20Consolidated%20Earnings,%20Segment%20Information%20and%20Consoli...CLOrox   1%20Consolidated%20Earnings,%20Segment%20Information%20and%20Consoli...
CLOrox 1%20Consolidated%20Earnings,%20Segment%20Information%20and%20Consoli...finance48
 
danaher 07_4Q_Release
danaher 07_4Q_Releasedanaher 07_4Q_Release
danaher 07_4Q_Releasefinance24
 
danaher 08_2Q_Release
danaher 08_2Q_Releasedanaher 08_2Q_Release
danaher 08_2Q_Releasefinance24
 
Sonoco 2Q 2012 Results Presentation
Sonoco 2Q 2012 Results PresentationSonoco 2Q 2012 Results Presentation
Sonoco 2Q 2012 Results PresentationSonoco
 

Similar to dte_4q1999 (20)

dte_3q1999
dte_3q1999dte_3q1999
dte_3q1999
 
dte_2q1999
dte_2q1999dte_2q1999
dte_2q1999
 
dte_1q2000
dte_1q2000dte_1q2000
dte_1q2000
 
dte_2q2000
dte_2q2000dte_2q2000
dte_2q2000
 
dte_1q1999
dte_1q1999dte_1q1999
dte_1q1999
 
dte_3q2000
dte_3q2000dte_3q2000
dte_3q2000
 
dtefin1
dtefin1dtefin1
dtefin1
 
CLX0502-1980616518a
CLX0502-1980616518aCLX0502-1980616518a
CLX0502-1980616518a
 
monsanto supplemental_toolkit
monsanto supplemental_toolkitmonsanto supplemental_toolkit
monsanto supplemental_toolkit
 
.monsanto supplemental_toolkit
.monsanto  supplemental_toolkit.monsanto  supplemental_toolkit
.monsanto supplemental_toolkit
 
monsanto supplemental_toolkit
monsanto  supplemental_toolkitmonsanto  supplemental_toolkit
monsanto supplemental_toolkit
 
.monsanto supplemental_toolkit
.monsanto  supplemental_toolkit.monsanto  supplemental_toolkit
.monsanto supplemental_toolkit
 
monsanto supplemental_toolkit
monsanto supplemental_toolkitmonsanto supplemental_toolkit
monsanto supplemental_toolkit
 
dtefin1
dtefin1dtefin1
dtefin1
 
CLX0201_1_Balance_Sheets-159159
CLX0201_1_Balance_Sheets-159159CLX0201_1_Balance_Sheets-159159
CLX0201_1_Balance_Sheets-159159
 
CLOrox 1%20Consolidated%20Earnings,%20Segment%20Information%20and%20Consoli...
CLOrox   1%20Consolidated%20Earnings,%20Segment%20Information%20and%20Consoli...CLOrox   1%20Consolidated%20Earnings,%20Segment%20Information%20and%20Consoli...
CLOrox 1%20Consolidated%20Earnings,%20Segment%20Information%20and%20Consoli...
 
dte_020730a
dte_020730adte_020730a
dte_020730a
 
danaher 07_4Q_Release
danaher 07_4Q_Releasedanaher 07_4Q_Release
danaher 07_4Q_Release
 
danaher 08_2Q_Release
danaher 08_2Q_Releasedanaher 08_2Q_Release
danaher 08_2Q_Release
 
Sonoco 2Q 2012 Results Presentation
Sonoco 2Q 2012 Results PresentationSonoco 2Q 2012 Results Presentation
Sonoco 2Q 2012 Results Presentation
 

More from finance41

pepco POMSlides
pepco POMSlidespepco POMSlides
pepco POMSlidesfinance41
 
pepco Berenson0306
pepco Berenson0306pepco Berenson0306
pepco Berenson0306finance41
 
pepco EdwardJones0306
pepco EdwardJones0306pepco EdwardJones0306
pepco EdwardJones0306finance41
 
pepco 2006JulyInvestorMeetings
pepco 2006JulyInvestorMeetingspepco 2006JulyInvestorMeetings
pepco 2006JulyInvestorMeetingsfinance41
 
pepco Presentation081706
pepco Presentation081706pepco Presentation081706
pepco Presentation081706finance41
 
pepco FallEEIl
pepco FallEEIlpepco FallEEIl
pepco FallEEIlfinance41
 
pepco WSUG107
pepco WSUG107pepco WSUG107
pepco WSUG107finance41
 
pepco AugustInvestorMeetings2007Final
pepco AugustInvestorMeetings2007Finalpepco AugustInvestorMeetings2007Final
pepco AugustInvestorMeetings2007Finalfinance41
 
pepco MerillLynchPower&GasConferenceSept2007(final)
pepco MerillLynchPower&GasConferenceSept2007(final)pepco MerillLynchPower&GasConferenceSept2007(final)
pepco MerillLynchPower&GasConferenceSept2007(final)finance41
 
pepco POMFallEEI2007
pepco POMFallEEI2007pepco POMFallEEI2007
pepco POMFallEEI2007finance41
 
pepco WallStBerensonFINAL
pepco WallStBerensonFINALpepco WallStBerensonFINAL
pepco WallStBerensonFINALfinance41
 
pepco POMAGAPresentation(final)
pepco POMAGAPresentation(final)pepco POMAGAPresentation(final)
pepco POMAGAPresentation(final)finance41
 
PHI_ProxyAnnual_Report2002
PHI_ProxyAnnual_Report2002PHI_ProxyAnnual_Report2002
PHI_ProxyAnnual_Report2002finance41
 
PHI_ProxyAnnual_Report2002
PHI_ProxyAnnual_Report2002PHI_ProxyAnnual_Report2002
PHI_ProxyAnnual_Report2002finance41
 
PHI_ProxyAnnual_Report2004
PHI_ProxyAnnual_Report2004PHI_ProxyAnnual_Report2004
PHI_ProxyAnnual_Report2004finance41
 
PHI_ProxyAnnual_Report2003
PHI_ProxyAnnual_Report2003PHI_ProxyAnnual_Report2003
PHI_ProxyAnnual_Report2003finance41
 
PHI_ProxyAnnual_Report2003
PHI_ProxyAnnual_Report2003PHI_ProxyAnnual_Report2003
PHI_ProxyAnnual_Report2003finance41
 
PHI_ProxyAnnual_Report2004
PHI_ProxyAnnual_Report2004PHI_ProxyAnnual_Report2004
PHI_ProxyAnnual_Report2004finance41
 
phi proxystatement2005report
phi proxystatement2005reportphi proxystatement2005report
phi proxystatement2005reportfinance41
 

More from finance41 (20)

pepco POMSlides
pepco POMSlidespepco POMSlides
pepco POMSlides
 
pepco Berenson0306
pepco Berenson0306pepco Berenson0306
pepco Berenson0306
 
pepco EdwardJones0306
pepco EdwardJones0306pepco EdwardJones0306
pepco EdwardJones0306
 
pepco 2006JulyInvestorMeetings
pepco 2006JulyInvestorMeetingspepco 2006JulyInvestorMeetings
pepco 2006JulyInvestorMeetings
 
pepco Presentation081706
pepco Presentation081706pepco Presentation081706
pepco Presentation081706
 
pepco FallEEIl
pepco FallEEIlpepco FallEEIl
pepco FallEEIl
 
pepco WSUG107
pepco WSUG107pepco WSUG107
pepco WSUG107
 
pepco AugustInvestorMeetings2007Final
pepco AugustInvestorMeetings2007Finalpepco AugustInvestorMeetings2007Final
pepco AugustInvestorMeetings2007Final
 
pepco MerillLynchPower&GasConferenceSept2007(final)
pepco MerillLynchPower&GasConferenceSept2007(final)pepco MerillLynchPower&GasConferenceSept2007(final)
pepco MerillLynchPower&GasConferenceSept2007(final)
 
pepco POMFallEEI2007
pepco POMFallEEI2007pepco POMFallEEI2007
pepco POMFallEEI2007
 
pepco WallStBerensonFINAL
pepco WallStBerensonFINALpepco WallStBerensonFINAL
pepco WallStBerensonFINAL
 
pepco POM2
pepco POM2pepco POM2
pepco POM2
 
pepco POMAGAPresentation(final)
pepco POMAGAPresentation(final)pepco POMAGAPresentation(final)
pepco POMAGAPresentation(final)
 
PHI_ProxyAnnual_Report2002
PHI_ProxyAnnual_Report2002PHI_ProxyAnnual_Report2002
PHI_ProxyAnnual_Report2002
 
PHI_ProxyAnnual_Report2002
PHI_ProxyAnnual_Report2002PHI_ProxyAnnual_Report2002
PHI_ProxyAnnual_Report2002
 
PHI_ProxyAnnual_Report2004
PHI_ProxyAnnual_Report2004PHI_ProxyAnnual_Report2004
PHI_ProxyAnnual_Report2004
 
PHI_ProxyAnnual_Report2003
PHI_ProxyAnnual_Report2003PHI_ProxyAnnual_Report2003
PHI_ProxyAnnual_Report2003
 
PHI_ProxyAnnual_Report2003
PHI_ProxyAnnual_Report2003PHI_ProxyAnnual_Report2003
PHI_ProxyAnnual_Report2003
 
PHI_ProxyAnnual_Report2004
PHI_ProxyAnnual_Report2004PHI_ProxyAnnual_Report2004
PHI_ProxyAnnual_Report2004
 
phi proxystatement2005report
phi proxystatement2005reportphi proxystatement2005report
phi proxystatement2005report
 

Recently uploaded

Dharavi Russian callg Girls, { 09892124323 } || Call Girl In Mumbai ...
Dharavi Russian callg Girls, { 09892124323 } || Call Girl In Mumbai ...Dharavi Russian callg Girls, { 09892124323 } || Call Girl In Mumbai ...
Dharavi Russian callg Girls, { 09892124323 } || Call Girl In Mumbai ...Pooja Nehwal
 
Dividend Policy and Dividend Decision Theories.pptx
Dividend Policy and Dividend Decision Theories.pptxDividend Policy and Dividend Decision Theories.pptx
Dividend Policy and Dividend Decision Theories.pptxanshikagoel52
 
TEST BANK For Corporate Finance, 13th Edition By Stephen Ross, Randolph Weste...
TEST BANK For Corporate Finance, 13th Edition By Stephen Ross, Randolph Weste...TEST BANK For Corporate Finance, 13th Edition By Stephen Ross, Randolph Weste...
TEST BANK For Corporate Finance, 13th Edition By Stephen Ross, Randolph Weste...ssifa0344
 
High Class Call Girls Nashik Maya 7001305949 Independent Escort Service Nashik
High Class Call Girls Nashik Maya 7001305949 Independent Escort Service NashikHigh Class Call Girls Nashik Maya 7001305949 Independent Escort Service Nashik
High Class Call Girls Nashik Maya 7001305949 Independent Escort Service NashikCall Girls in Nagpur High Profile
 
00_Main ppt_MeetupDORA&CyberSecurity.pptx
00_Main ppt_MeetupDORA&CyberSecurity.pptx00_Main ppt_MeetupDORA&CyberSecurity.pptx
00_Main ppt_MeetupDORA&CyberSecurity.pptxFinTech Belgium
 
High Class Call Girls Nagpur Grishma Call 7001035870 Meet With Nagpur Escorts
High Class Call Girls Nagpur Grishma Call 7001035870 Meet With Nagpur EscortsHigh Class Call Girls Nagpur Grishma Call 7001035870 Meet With Nagpur Escorts
High Class Call Girls Nagpur Grishma Call 7001035870 Meet With Nagpur Escortsranjana rawat
 
20240429 Calibre April 2024 Investor Presentation.pdf
20240429 Calibre April 2024 Investor Presentation.pdf20240429 Calibre April 2024 Investor Presentation.pdf
20240429 Calibre April 2024 Investor Presentation.pdfAdnet Communications
 
Top Rated Pune Call Girls Viman Nagar ⟟ 6297143586 ⟟ Call Me For Genuine Sex...
Top Rated  Pune Call Girls Viman Nagar ⟟ 6297143586 ⟟ Call Me For Genuine Sex...Top Rated  Pune Call Girls Viman Nagar ⟟ 6297143586 ⟟ Call Me For Genuine Sex...
Top Rated Pune Call Girls Viman Nagar ⟟ 6297143586 ⟟ Call Me For Genuine Sex...Call Girls in Nagpur High Profile
 
02_Fabio Colombo_Accenture_MeetupDora&Cybersecurity.pptx
02_Fabio Colombo_Accenture_MeetupDora&Cybersecurity.pptx02_Fabio Colombo_Accenture_MeetupDora&Cybersecurity.pptx
02_Fabio Colombo_Accenture_MeetupDora&Cybersecurity.pptxFinTech Belgium
 
Call US 📞 9892124323 ✅ Kurla Call Girls In Kurla ( Mumbai ) secure service
Call US 📞 9892124323 ✅ Kurla Call Girls In Kurla ( Mumbai ) secure serviceCall US 📞 9892124323 ✅ Kurla Call Girls In Kurla ( Mumbai ) secure service
Call US 📞 9892124323 ✅ Kurla Call Girls In Kurla ( Mumbai ) secure servicePooja Nehwal
 
Call Girls Koregaon Park Call Me 7737669865 Budget Friendly No Advance Booking
Call Girls Koregaon Park Call Me 7737669865 Budget Friendly No Advance BookingCall Girls Koregaon Park Call Me 7737669865 Budget Friendly No Advance Booking
Call Girls Koregaon Park Call Me 7737669865 Budget Friendly No Advance Bookingroncy bisnoi
 
The Economic History of the U.S. Lecture 23.pdf
The Economic History of the U.S. Lecture 23.pdfThe Economic History of the U.S. Lecture 23.pdf
The Economic History of the U.S. Lecture 23.pdfGale Pooley
 
VIP Call Girls Service Dilsukhnagar Hyderabad Call +91-8250192130
VIP Call Girls Service Dilsukhnagar Hyderabad Call +91-8250192130VIP Call Girls Service Dilsukhnagar Hyderabad Call +91-8250192130
VIP Call Girls Service Dilsukhnagar Hyderabad Call +91-8250192130Suhani Kapoor
 
CALL ON ➥8923113531 🔝Call Girls Gomti Nagar Lucknow best sexual service
CALL ON ➥8923113531 🔝Call Girls Gomti Nagar Lucknow best sexual serviceCALL ON ➥8923113531 🔝Call Girls Gomti Nagar Lucknow best sexual service
CALL ON ➥8923113531 🔝Call Girls Gomti Nagar Lucknow best sexual serviceanilsa9823
 
Booking open Available Pune Call Girls Shivane 6297143586 Call Hot Indian Gi...
Booking open Available Pune Call Girls Shivane  6297143586 Call Hot Indian Gi...Booking open Available Pune Call Girls Shivane  6297143586 Call Hot Indian Gi...
Booking open Available Pune Call Girls Shivane 6297143586 Call Hot Indian Gi...Call Girls in Nagpur High Profile
 
03_Emmanuel Ndiaye_Degroof Petercam.pptx
03_Emmanuel Ndiaye_Degroof Petercam.pptx03_Emmanuel Ndiaye_Degroof Petercam.pptx
03_Emmanuel Ndiaye_Degroof Petercam.pptxFinTech Belgium
 
The Economic History of the U.S. Lecture 19.pdf
The Economic History of the U.S. Lecture 19.pdfThe Economic History of the U.S. Lecture 19.pdf
The Economic History of the U.S. Lecture 19.pdfGale Pooley
 
Pooja 9892124323 : Call Girl in Juhu Escorts Service Free Home Delivery
Pooja 9892124323 : Call Girl in Juhu Escorts Service Free Home DeliveryPooja 9892124323 : Call Girl in Juhu Escorts Service Free Home Delivery
Pooja 9892124323 : Call Girl in Juhu Escorts Service Free Home DeliveryPooja Nehwal
 
05_Annelore Lenoir_Docbyte_MeetupDora&Cybersecurity.pptx
05_Annelore Lenoir_Docbyte_MeetupDora&Cybersecurity.pptx05_Annelore Lenoir_Docbyte_MeetupDora&Cybersecurity.pptx
05_Annelore Lenoir_Docbyte_MeetupDora&Cybersecurity.pptxFinTech Belgium
 

Recently uploaded (20)

Dharavi Russian callg Girls, { 09892124323 } || Call Girl In Mumbai ...
Dharavi Russian callg Girls, { 09892124323 } || Call Girl In Mumbai ...Dharavi Russian callg Girls, { 09892124323 } || Call Girl In Mumbai ...
Dharavi Russian callg Girls, { 09892124323 } || Call Girl In Mumbai ...
 
Dividend Policy and Dividend Decision Theories.pptx
Dividend Policy and Dividend Decision Theories.pptxDividend Policy and Dividend Decision Theories.pptx
Dividend Policy and Dividend Decision Theories.pptx
 
TEST BANK For Corporate Finance, 13th Edition By Stephen Ross, Randolph Weste...
TEST BANK For Corporate Finance, 13th Edition By Stephen Ross, Randolph Weste...TEST BANK For Corporate Finance, 13th Edition By Stephen Ross, Randolph Weste...
TEST BANK For Corporate Finance, 13th Edition By Stephen Ross, Randolph Weste...
 
High Class Call Girls Nashik Maya 7001305949 Independent Escort Service Nashik
High Class Call Girls Nashik Maya 7001305949 Independent Escort Service NashikHigh Class Call Girls Nashik Maya 7001305949 Independent Escort Service Nashik
High Class Call Girls Nashik Maya 7001305949 Independent Escort Service Nashik
 
00_Main ppt_MeetupDORA&CyberSecurity.pptx
00_Main ppt_MeetupDORA&CyberSecurity.pptx00_Main ppt_MeetupDORA&CyberSecurity.pptx
00_Main ppt_MeetupDORA&CyberSecurity.pptx
 
High Class Call Girls Nagpur Grishma Call 7001035870 Meet With Nagpur Escorts
High Class Call Girls Nagpur Grishma Call 7001035870 Meet With Nagpur EscortsHigh Class Call Girls Nagpur Grishma Call 7001035870 Meet With Nagpur Escorts
High Class Call Girls Nagpur Grishma Call 7001035870 Meet With Nagpur Escorts
 
20240429 Calibre April 2024 Investor Presentation.pdf
20240429 Calibre April 2024 Investor Presentation.pdf20240429 Calibre April 2024 Investor Presentation.pdf
20240429 Calibre April 2024 Investor Presentation.pdf
 
Top Rated Pune Call Girls Viman Nagar ⟟ 6297143586 ⟟ Call Me For Genuine Sex...
Top Rated  Pune Call Girls Viman Nagar ⟟ 6297143586 ⟟ Call Me For Genuine Sex...Top Rated  Pune Call Girls Viman Nagar ⟟ 6297143586 ⟟ Call Me For Genuine Sex...
Top Rated Pune Call Girls Viman Nagar ⟟ 6297143586 ⟟ Call Me For Genuine Sex...
 
Veritas Interim Report 1 January–31 March 2024
Veritas Interim Report 1 January–31 March 2024Veritas Interim Report 1 January–31 March 2024
Veritas Interim Report 1 January–31 March 2024
 
02_Fabio Colombo_Accenture_MeetupDora&Cybersecurity.pptx
02_Fabio Colombo_Accenture_MeetupDora&Cybersecurity.pptx02_Fabio Colombo_Accenture_MeetupDora&Cybersecurity.pptx
02_Fabio Colombo_Accenture_MeetupDora&Cybersecurity.pptx
 
Call US 📞 9892124323 ✅ Kurla Call Girls In Kurla ( Mumbai ) secure service
Call US 📞 9892124323 ✅ Kurla Call Girls In Kurla ( Mumbai ) secure serviceCall US 📞 9892124323 ✅ Kurla Call Girls In Kurla ( Mumbai ) secure service
Call US 📞 9892124323 ✅ Kurla Call Girls In Kurla ( Mumbai ) secure service
 
Call Girls Koregaon Park Call Me 7737669865 Budget Friendly No Advance Booking
Call Girls Koregaon Park Call Me 7737669865 Budget Friendly No Advance BookingCall Girls Koregaon Park Call Me 7737669865 Budget Friendly No Advance Booking
Call Girls Koregaon Park Call Me 7737669865 Budget Friendly No Advance Booking
 
The Economic History of the U.S. Lecture 23.pdf
The Economic History of the U.S. Lecture 23.pdfThe Economic History of the U.S. Lecture 23.pdf
The Economic History of the U.S. Lecture 23.pdf
 
VIP Call Girls Service Dilsukhnagar Hyderabad Call +91-8250192130
VIP Call Girls Service Dilsukhnagar Hyderabad Call +91-8250192130VIP Call Girls Service Dilsukhnagar Hyderabad Call +91-8250192130
VIP Call Girls Service Dilsukhnagar Hyderabad Call +91-8250192130
 
CALL ON ➥8923113531 🔝Call Girls Gomti Nagar Lucknow best sexual service
CALL ON ➥8923113531 🔝Call Girls Gomti Nagar Lucknow best sexual serviceCALL ON ➥8923113531 🔝Call Girls Gomti Nagar Lucknow best sexual service
CALL ON ➥8923113531 🔝Call Girls Gomti Nagar Lucknow best sexual service
 
Booking open Available Pune Call Girls Shivane 6297143586 Call Hot Indian Gi...
Booking open Available Pune Call Girls Shivane  6297143586 Call Hot Indian Gi...Booking open Available Pune Call Girls Shivane  6297143586 Call Hot Indian Gi...
Booking open Available Pune Call Girls Shivane 6297143586 Call Hot Indian Gi...
 
03_Emmanuel Ndiaye_Degroof Petercam.pptx
03_Emmanuel Ndiaye_Degroof Petercam.pptx03_Emmanuel Ndiaye_Degroof Petercam.pptx
03_Emmanuel Ndiaye_Degroof Petercam.pptx
 
The Economic History of the U.S. Lecture 19.pdf
The Economic History of the U.S. Lecture 19.pdfThe Economic History of the U.S. Lecture 19.pdf
The Economic History of the U.S. Lecture 19.pdf
 
Pooja 9892124323 : Call Girl in Juhu Escorts Service Free Home Delivery
Pooja 9892124323 : Call Girl in Juhu Escorts Service Free Home DeliveryPooja 9892124323 : Call Girl in Juhu Escorts Service Free Home Delivery
Pooja 9892124323 : Call Girl in Juhu Escorts Service Free Home Delivery
 
05_Annelore Lenoir_Docbyte_MeetupDora&Cybersecurity.pptx
05_Annelore Lenoir_Docbyte_MeetupDora&Cybersecurity.pptx05_Annelore Lenoir_Docbyte_MeetupDora&Cybersecurity.pptx
05_Annelore Lenoir_Docbyte_MeetupDora&Cybersecurity.pptx
 

dte_4q1999

  • 1. DTE ENERGY COMPANY AND SUBSIDIARY COMPANIES CONDENSED CONSOLIDATED STATEMENT OF INCOME (PRELIMINARY/UNAUDITED) (Dollars in Millions, Expect Per Share Amounts) 3 Months - Dec 1999 After Tax 1999 1998 % Change $ Change EPS Impact * Operating Revenues $1,114 $1,012 10.1% $102 $0.45 Operating Expenses Fuel & Purchased power 272 211 28.9% 61 ($0.27) Operation and maintenance 394 382 3.1% 12 ($0.05) Depreciation and amortization 188 165 13.9% 23 ($0.10) Taxes other than income 66 64 3.1% 2 ($0.01) Total Operating Expenses $919 $822 11.8% $97 ($0.44) Operating Income $195 $190 2.6% $5 $0.01 Interest Expense and Other Interest Expense 81 82 -1.2% ($1) $0.00 Other Expense- net 5 6 -16.7% (1) $0.00 Net Interest Expense and Other $86 $88 -2.3% ($2) ($0.00) Income Before Income Taxes $109 $102 6.9% $7 $0.01 Income Taxes 12 (5) 340.0% 17 ($0.07) Net Income $97 $107 -9.3% ($10) ($0.06) Common Sh. Outstanding - Avg 145 145 0.00% Earnings Per Common Share $0.67 $0.73 -8.1% ($0.06) -0.010 * Earnings impact figures are estimates The Condensed Consolidated Statement of Income (Unaudited) should be read in Differences may exist due to rounding conjunction with the Notes to Consolidated Financial Statements appearing in the Please see additional detail on Page 4 Annual Report to Shareholders, 10K, and 10Q. DTE Investor Relations (313) 235 - 8030 2
  • 2. DTE ENERGY COMPANY AND SUBSIDIARY COMPANIES CONDENSED CONSOLIDATED STATEMENT OF INCOME (PRELIMINARY/UNAUDITED) (Dollars in Millions, Expect Per Share Amounts) 12 Months December, 1999 After Tax 1999 1998 % Change $ Change EPS Impact * Operating Revenues $4,728 $4,223 12.0% $505 $2.26 Operating Expenses Fuel and Purchased power 1,334 1063 25.5% 271 ($1.21) Operation and Maintenance 1,480 1290 14.7% 190 ($0.85) Depreciation and amortization 735 662 11.0% 73 ($0.33) Taxes other than income 277 272 1.8% 5 ($0.02) Total Operating Expenses $3,826 $3,286 16.4% $540 ($2.42) Operating Income $902 $937 -3.7% ($35) ($0.15) Interest Expense and Other Interest Expense 341 318 7.2% 23 ($0.10) Pref. Stock Dividend of Subsidiary - 6 -100.0% (6) $0.03 Other - net 18 15 20.0% (3) ($0.01) Net Interest Expense and Other $359 $340 5.6% $19 ($0.09) Income Before Income Taxes $543 $597 -9.0% ($54) ($0.24) Income Taxes $60 $154 -61.0% (94) $0.52 Net Income $483 $443 9.0% $40 $0.27 Common Sh. Outstanding - Avg 145 145 0.00% Earnings Per Common Share $3.33 $3.05 9.0% $0.27 * Earnings impact figures are estimates The Condensed Consolidated Statement of Income (Unaudited) should be read in Differences may exist due to rounding conjunction with the Notes to Consolidated Financial Statements appearing in the Annual Report to Shareholders, 10K, and 10Q. DTE Investor Relations (313) 235-8030 3
  • 3. DTE ENERGY COMPANY AND SUBSIDIARY COMPANIES Earnings Analysis - Detail 4th Quarter 1999 Change from 12/31/98 After-Tax After-Tax Per Share Impact* Per Share Impact* DTE Energy Beginning Earnings Per Share $0.73 $3.05 Regulated Operating Revenues Net Margin - Higher industrial sales partially offset by higher fuel expense $0.04 $0.12 1998 Purchased Power adjustment (0.04) - Fermi 2 Performance Standard - $0.15 Total Regulated Net Revenues $0.00 $0.27 Regulated Oper. & Maintenance Expense Storms 0.10 0.09 Y2K 0.08 (0.04) Distribution System Enhancements & Maintenance (0.03) (0.09) Generation Maintenance & Reliability (0.03) (0.04) Benefits (0.02) (0.04) Other 0.01 (0.01) Regulated Oper. & Maintenance Expense 0.11 (0.13) Depreciation & Amortization Primarily accelerated depreciation of Fermi 2, sharing mechanism and other plant ($0.11) ($0.27) Interest & Other 0.01 ($0.01) Income Taxes & Preferred Dividends Due to full normalization of Fermi regulatory assets in 1999 ($0.10) $0.31 Regulated Net Income (Detroit Edison) ($0.09) $0.17 Non-Regulated Net Income: Higher income due to increased business at DTE Energy Services and increased market gains at DTE Trading $0.06 $0.18 DTE Energy Holding and DTE Capital Inc. Primarily merger and advertising costs ($0.03) ($0.07) Earnings Per Share Change ($0.06) $0.28 DTE Energy Ending Earnings Per Share $0.67 $3.33 Differences may exist due to rounding. DTE Investor Relations (313) 235-8030 4
  • 4. DTE ENERGY COMPANY AND SUBSIDIARY COMPANIES TRAILING 12-MONTH ANALYSIS - REPORTED EPS* As of December 31, 1999 Detroit Edison 1Q 2Q 3Q 4Q Total EPS Growth (%) 1998 $0.66 $0.64 $0.85 $0.68 $2.83 1999 $0.71 $0.74 $0.95 $0.59 $2.99 5.7% Non-Regulated Subsidiaries (Additional Detail Provided Below) 1Q 2Q 3Q 4Q Total 1998 $0.06 $0.07 $0.07 $0.09 $0.29 1999 $0.10 $0.07 $0.16 $0.15 $0.47 DTE Capital / DTE Holding Company 1Q 2Q 3Q 4Q Total 1998 $0.00 ($0.02) ($0.01) ($0.04) ($0.07) 1999 ($0.02) ($0.05) $0.00 ($0.07) ($0.14) DTE Energy Company 1Q 2Q 3Q 4Q Total EPS Growth (%) 1998 $0.72 $0.69 $0.91 $0.73 $3.05 1999 $0.79 $0.76 $1.11 $0.67 $3.33 9.2% 1999 Non-Regulated Earnings Per Share by Activity * 1Q 2Q 3Q 4Q Total Coal Related $0.11 $0.11 $0.19 $0.15 $0.56 Renewables $0.01 $0.00 $0.01 $0.01 $0.03 Market Development ($0.01) ($0.03) ($0.02) $0.01 ($0.05) Plug Power, LLC ($0.01) ($0.03) ($0.03) ($0.04) ($0.11) Other $0.00 $0.01 $0.01 $0.02 $0.04 Total Non-Regulated Subsidiaries $0.10 $0.07 $0.16 $0.15 $0.47 DTE Capital / DTE Holding Co. ($0.02) ($0.05) $0.00 ($0.07) ($0.14) Total 1999 Non-Regulated EPS $0.08 $0.02 $0.16 $0.08 $0.33 * Differences may exist due to rounding DTE Investor Relations (313) 235-8030 5
  • 5. DTE ENERGY COMPANY AND SUBSIDIARY COMPANIES CONDENSED CONSOLIDATED BALANCE SHEET (PRELIMINARY/UNAUDITED) (Dollars in Millions, Expect Per Share Amounts) Percent ASSETS Dec. 31, 1999 Dec. 31, 1998 Change Current Assets Cash and Cash Equivalents $32 $131 -75.6% Restricted Cash 131 121 8.3% Acounts Receivable Customer (less allowance for doubtful accounts) 388 320 21.3% Accrued Unbilled Revenues 166 153 8.5% Other 144 131 9.9% Inventories (at average cost) Fuel 175 171 2.3% Materials and Supplies 169 166 1.8% Assets from risk management activities 67 14 378.6% Other 38 24 58.3% Total Current Assets $1,310 $1,231 6.4% Investments Nuclear Decommissioning Trust Funds 361 309 16.8% Other 274 261 5.0% $635 $570 11.4% Property Property, Plant and Equipment 11,755 11,121 5.7% Property under Capital Leases 222 242 -8.3% Nuclear Fuel under Capital Lease 663 659 0.6% Construction Work in Progress 106 156 -32.1% $12,746 $12,178 4.7% Less Accumulated Depreciation & Amortization 5,598 5,235 6.9% 7,148 6,943 3.0% Regulatory Assets 2,935 3,091 -5.0% Other Assets 288 252 14.3% Total Assets $12,316 $12,087 1.9% The Condensed Consolidated Balance Sheet (Unaudited) should be read in conjunction with the Notes to Consolidated Financial Statements appearing in the Annual Report to Shareholders, 10K, and 10Q. DTE Investor Relations (313) 235-8030 6
  • 6. DTE ENERGY COMPANY AND SUBSIDIARY COMPANIES CONDENSED CONSOLIDATED BALANCE SHEET (PRELIMINARY/UNAUDITED) (Dollars in Millions, Except Per Share Amounts) Percent LIABILITIES Dec. 31, 1999 Dec. 31, 1998 Change Current Liabilities Accounts Payable $273 $239 14.2% Accrued Interest 57 57 0.0% Dividends Payable 75 75 -0.4% Accrued Payroll 97 101 -4.0% Short-term Borrowings 387 231 67.5% Income taxes 61 69 -11.6% Current Portion Long-term Debt 270 294 -8.2% Current Portion Capital Leases 75 118 -36.4% Liability from Risk Management Activities 52 14 271.4% Other 257 194 32.5% $1,604 $1,392 15.2% Other Liabilities Deferred Income Taxes 1,925 1,888 2.0% Capital Leases 114 127 -10.2% Regulatory Liabilities 262 293 -10.6% Other 564 493 14.4% 2,865 2,801 2.3% Long-Term Debt $3,938 $4,197 -6.2% Shareholder's Equity Common Stock, without par value, 400,000,000 shares authorized, 145,045,159 and 145,071,317 issued and outstanding, respectively 1,950 1,951 0.0% Retained Earnings 1,959 1,747 12.1% Total Shareholder's Equity $3,909 $3,698 5.7% Total Liabilities and Shareholder's Equity $12,316 $12,087 1.9% The Condensed Consolidated Balance Sheet (Unaudited) should be read in conjunction with the Notes to Consolidated Financial Statements appearing in the Annual Report to Shareholders, 10K, and 10Q. DTE Investor Relations (313) 235-8030 7
  • 7. DTE ENERGY COMPANY AND SUBSIDIARY COMPANIES CONDENSED CONSOLIDATED STATEMENT OF CASH FLOWS (PRELIMINARY/UNAUDITED) (Dollars in Millions, Except Per Share Amounts) 12 Months Ended December 31 1999 1998 Operating Activities Net Income $483 $443 Adjustments to reconcile net income to net cash from operating activities: Depreciation and Amortization 697 634 Other (78) (126) Changes in current assets and liabilities: Restricted Cash (10) (67) Accounts Receivable (94) (84) Inventories (5) (35) Payables 30 99 Other 35 (37) Net cash from operating activities $1,058 $827 Investing Activities Plant and Equipment Expenditures (742) (589) Investment in coke oven battery business - (401) Net cash used for investing activities ($742) ($990) Financing Activities Issuance of Long-term Debt $265 $763 Increase (Decrease) in Short-term Borrowings 156 189 Redemption of Long-term Debt (535) (255) Redemption of Preferred Stock (150) Dividends on Common Stock (299) (299) Other - - Net cash used for financing activities ($413) $248 Net Increase (Decrease) in Cash and Temporary Cash Investments (97) 85 Cash and Cash Equivalents at Beginning of the Period 130 45 Cash and Cash Equivalents at End of the Period $33 $130 Supplementary Cash Flow Information Interest paid (excluding interest capitalized) $340 $309 Income Taxes paid 152 160 New Capital lease obligations 114 52 The Condensed Consolidated Statement of Cash Flows (Unaudited) should be read in conjunction with the Notes to Consolidated Financial Statements appearing in the Annual Report to Shareholders, 10K, and 10Q. 8 DTE Investor Relations (313) 235-8030
  • 8. THE DETROIT EDISON COMPANY STATEMENT OF INCOME (PRELIMINARY/UNAUDITED) (Dollars in Millions, Expect Per Share Amounts) 3 Months - Dec 1999 After Tax 1999 1998 % Change $ Change EPS Impact * Operating Revenues $919 $904 1.7% $15 $0.07 Operating Expenses Fuel and Purchased power 218 203 7.4% 15 (0.07) Operation and Maintenance 255 279 -8.6% (24) 0.11 Depreciation and amortization 181 157 15.3% 24 (0.11) Taxes other than income 65 64 1.6% 1 (0.00) Total Operating Expenses $719 $703 2.3% $16 (0.07) Operating Income $200 $201 -0.5% ($1) ($0.00) Interest Expense and Other Interest Expense 66 69 -4.3% (3) $0.01 Other - net 2 2 0.0% - $0.00 Net Interest Expense and Other $68 $71 -4.2% ($3) $0.02 Income Before Income Taxes $132 $130 1.5% $2 $0.02 Income Taxes $47 $30 56.7% $17 $ (0.12) Net Income $85 $100 -15.0% ($15) ($0.10) Preferred Stock Dividends $1 -100.0% ($1) $0.00 Net Income Available for Common Stock $85 $99 -14.1% ($14) ($0.10) * Earnings impact figures are estimates The Condensed Consolidated Statement of Income (Unaudited) should be read in Differences may exist due to rounding conjunction with the Notes to Consolidated Financial Statements appearing in the Annual Report to Shareholders, 10K, and 10Q. DTE Investor Relations (313) 235-8030 10
  • 9. THE DETROIT EDISON COMPANY STATEMENT OF INCOME (PRELIMINARY/UNAUDITED) (Dollars in Millions, Expect Per Share Amounts) 12 Months Dec. 31 After Tax 1999 1998 % Change $ Change EPS Impact * Operating Revenues $4,047 $3,902 3.7% $145 $0.65 Operating Expenses Fuel & Purchased power 1106 1021 8.3% 85 ($0.38) Operation and maintenance 1027 998 2.9% 29 ($0.13) Depreciation and amortization 703 643 9.3% 60 ($0.27) Taxes other than income 275 270 1.9% 5 ($0.02) Total Operating Expenses $3,111 $2,932 6.1% $179 ($0.80) Operating Income $936 $970 -3.5% ($34) ($0.15) Interest Expense and Other Interest Expense 284 277 2.5% $7 ($0.03) Other Expense- net 6 15 -60.0% (9) $0.03 Net Interest Expense and Other $290 $292 -0.7% ($2) $0.01 Income Before Income Taxes $646 $677 -4.6% ($31) ($0.14) Income Taxes 211 260 -18.8% ($49) $0.13 Net Income $435 $417 4.3% $18 ($0.01) Preferred Stock Dividends - $6 -100.0% ($6) 0.03 Net Income Available for Common Stock $435 $411 5.5% $24 $0.16 * Earnings impact figures are estimates The Condensed Consolidated Statement of Income (Unaudited) should be read in Differences may exist due to rounding conjunction with the Notes to Consolidated Financial Statements appearing in the Please see additional detail on Page 4 Annual Report to Shareholders, 10K, and 10Q. DTE Investor Relations (313) 235 - 8030 9
  • 10. DTE ENERGY COMPANY AND SUBSIDIARY COMPANIES SELECTED FINANCIAL RATIOS (PRELIMINARY/UNAUDITED) Twelve Months Ended December 1999 1998 Coverage Ratios (SEC Basis): 2.44 2.71 Ratio of Earnings to Fixed Charges (SEC Basis) Ratio of Earnings to Fixed Charges 2.55 2.80 (Excluding Non-Recourse Debt Interest Expense) 12.8% 12.3% Return on Average Common Equity 12.0% 11.7% Return on Average Common Equity (Detroit Edison - Electirc & Steam) 61.9% 67.5% Common Stock Dividend Payout 123.2% 103.3% Funds Generated Internally for Construction 11.1% 25.5% Effective Federal Income Tax Rate $26.75 $25.49 Book Value Per Common Share Capital Structure 1999 1998 Traditional Method 49.6% 46.8% Common Shareholders' Equity 0.0% 0.0% Preferred Stock 4.9% 4.9% Deeply Subordinated Debt (QUIDS) 45.5% 48.3% Long-Term Debt 100% 100% Total Rating Agency Method 44.5% 42.7% Common Shareholders' Equity (1) 4.4% 4.4% Preferred Stock & Deeply Subordinated Debt (QUIDS) Long-Term Debt (2) 51.1% 52.9% 100% 100% Total Capital Structure (Excluding Non-Recourse Debt) 1999 1998 Traditional Method 51.3% 48.9% Common Shareholders' Equity 0.0% 0.0% Preferred Stock 5.1% 5.1% Deeply Subordinated Debt (QUIDS) 43.6% 46.0% Long-Term Debt 100% 100% Total Rating Agency Method 46.6% 44.8% Common Shareholders' Equity Preferred Stock & Deeply Subordinated Debt (QUIDS) (1) 4.6% 4.7% Long-Term Debt (2) 48.8% 50.5% 100% 100% Total (1) Includes amounts due within one year. (2) Includes amounts due within one year, obligations under capital leases (current and non-current) and short-term debt. DTE Investor Relations (313) 235-8030 11
  • 11. 1999 SALES ANALYSIS (GWH) Sales As 1Q 2Q 3Q 4Q % Chg YTD % Chg % of Category 1999 1999 1999 1999 4Q '98 1999 YTD 99 Total 3,486 Residential 3,237 4,231 3,110 -0.8% 14,064 2.3% 25.3% Commercial 2,504 Secondary 2,683 2,834 2,545 4.0% 10,566 2.7% 19.0% 2,007 Primary 2,390 2,426 2,159 7.2% 8,982 4.3% 16.2% 4,511 Total Commercial 5,073 5,260 4,704 5.4% 19,548 3.4% 35.2% Industrial 1,799 Automotive 1,901 2,282 2,110 16.3% 8,092 9.8% 14.6% 664 Steel 699 749 705 4.6% 2,817 -1.2% 5.1% 1,088 Other Manufacturing 1,293 1,150 1,205 9.3% 4,736 5.7% 8.5% 3,551 Total Industrial 3,893 4,181 4,020 11.9% 15,645 6.4% 28.2% 666 Other 592 642 694 9.3% 2,594 10.1% 4.7% 12,214 Total System Sales 12,795 14,314 12,528 6.0% 51,851 4.3% 93.4% 1,125 1,136 Interconnection 786 625 -29.6% 3,672 -29.5% 6.6% Total Sales 13,339 13,581 14,939 13,664 1.7% 55,523 1.1% 100.0% 1999 Temperature Normalized Sales 1999 1999 Temperature Difference Category Actual Normalized % Residential 14,063 13,622 3.24% Commercial Secondary 10,565 10,389 1.69% Primary 8,981 8,792 2.15% Total Commercial 19,546 19,181 1.90% Industrial Automotive 8,093 8,093 Steel 2,818 2,818 Other Manufacturing 4,738 4,738 Total Industrial 15,649 15,649 Other 2,594 2,594 Total System Sales 51,852 51,046 1.58% Heating and Cooling Degree Day Data 1999 1998 % Change Heating Degree Days 5,788 5,088 13.76% Cooling Degree Days 905 980 -7.65% 12 DTE Investor Relations (313) 235-8030