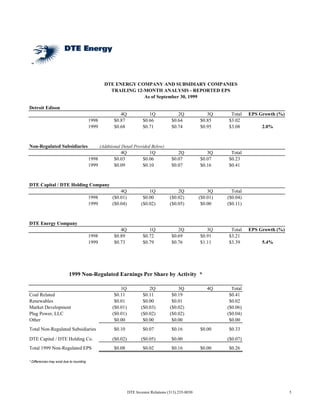
DTE Energy reported financial results for the third quarter of 1999. Operating revenues increased 20.1% to $1.44 billion due to higher net system sales and a performance reserve from Fermi 2. However, operating expenses also increased 24.3% to $1.16 billion primarily because of higher fuel and purchased power costs. As a result, operating income rose modestly to $281 million. Net income increased 21.8% to $161 million compared to $132 million in 1998, contributing to a rise in earnings per share to $1.11 from $0.91 in the previous year. The financial results reflected growth in both the company's regulated and non-regulated operations.
DTE Energy reported financial results for the second quarter and first six months of 1999. Operating revenues increased 8.1% and 8.2% respectively compared to the same periods in 1998. However, higher operating expenses led to a decrease in operating income of 14.9% and 11.4%. Net income increased by 8.9% and 9.8% due to lower income tax expenses. Cash used for investing activities increased as the company spent more on plant and equipment expenditures.
DTE Energy reported financial results for the fourth quarter and full year 1999. For the quarter, operating revenues increased 10.1% to $1.1 billion but net income decreased 9.3% to $97 million due to higher fuel and operating costs. For the full year, operating revenues rose 12.0% to $4.7 billion while net income grew 9.0% to $483 million due to increased industrial sales and non-regulated business income, partially offset by higher fuel expenses. Cash from operating activities totaled $1.1 billion for 1999.
DTE Energy Company reported financial results for the second quarter of 2000. Operating revenues increased 24.2% to $1.428 billion due to higher fuel and purchased power costs. Net income was $108 million, down slightly from $110 million in the previous year. Earnings per share were $0.76, unchanged from the prior year when excluding one-time items. For the six months ended June 30, 2000, operating revenues increased 20.1% to $2.610 billion while net income was $224 million, relatively unchanged from the previous year.
DTE Energy Company reported financial results for the first quarter of 2000. Operating revenues increased 15.4% to $1.182 billion due to a 48.9% rise in fuel and purchased power costs. Net income rose 1.7% to $117 million. Earnings per share increased 2.6% to $0.81, or $0.84 excluding merger costs. Detroit Edison, DTE Energy's regulated utility, saw operating revenues increase 4.1% but net income fell 7.2% due to higher fuel expenses. Non-regulated subsidiaries contributed significantly to earnings growth through new projects and trading gains.
The document is DTE Energy Company's condensed consolidated statement of income and balance sheet for the first quarter of 1999 compared to the same period in 1998. Some key points:
- Operating revenues increased 8.4% to $1,024 million, while operating expenses rose 13.6% to $809 million, resulting in a 7.7% decrease in operating income to $215 million.
- Net income increased 10.6% to $115 million due to higher regulated revenues and lower expenses, as well as improved performance from non-regulated subsidiaries.
- As of March 31, 1999, current assets decreased primarily due to lower cash and cash equivalents, while accounts receivable and inventories
- DTE Energy Company and Subsidiary Companies provided a condensed consolidated statement of income and balance sheet for the third quarter of 2000 compared to the third quarter of 1999.
- Key highlights include operating revenues increased 7.4% to $1.547 billion driven by higher fuel and purchased power costs, while operating income decreased 38.8% to $172 million.
- Net income including one-time items decreased 35.2% to $104 million, while earnings per share decreased 38.8% to $0.73 per share compared to the prior year.
first energy 3Q 08 Consolidated Finan Communityfinance21
This document summarizes FirstEnergy's financial results for the third quarter of 2008 compared to the third quarter of 2007. Key points include:
- Earnings per share increased to $1.55 from $1.36 due to higher wholesale sales prices and lower expenses, partially offset by higher fuel costs.
- Electric deliveries declined 2% due to mild weather while generation revenues increased due to higher wholesale prices. Fuel and purchased power expenses rose.
- Several other factors positively impacted earnings, including lower pension expenses and financing costs.
- Guidance for 2008 earnings per share was increased to $4.30 to $4.40, up from $4.25 to $4.35.
This document provides a summary of FirstEnergy Corp.'s financial results for the third quarter of 2006.
- Normalized non-GAAP earnings were $1.42 per share for Q3 2006, up from $1.04 per share in Q3 2005. GAAP earnings were $1.41 per share for Q3 2006 compared to $1.01 per share in Q3 2005.
- Factors that increased earnings included regulatory changes in Ohio and lower fuel and purchased power costs. Factors that decreased earnings included lower distribution deliveries due to mild weather and lower generation revenues from lower wholesale prices and sales volumes.
- Guidance for 2006 normalized non-GAAP earnings was increased to
DTE Energy reported first quarter earnings of $138 million compared to $117 million in the first quarter of 2000. Revenue from non-regulated businesses increased 251% to $817 million, contributing to increased earnings. The results were positively impacted by the suspension of the fuel clause and the company expects to complete its merger with MCN Energy in June, which is an important part of DTE Energy's growth strategy.
DTE Energy reported a 20% increase in net income for the first quarter of 2004 compared to the same period in 2003. Operating expenses decreased 8% due to lower fuel and operation and maintenance costs. Operating income increased 68% while income from continuing operations rose 79%. Earnings per share from continuing operations were $1.14 for Q1 2004 compared to $0.65 for Q1 2003, an increase of 75%. Significant special items impacting comparability between the periods included a $0.28 per share benefit from a pipeline contract termination in 2004.
Bank of America reported second quarter 2007 results. Net income was $5.8 billion, up 4% from the previous year. Revenue increased 8% due to strong noninterest income growth across all business lines. Credit quality remained sound although provision expenses increased due to reserve builds. The company continued to see increases in deposits, assets under management, retail sales and checking account openings.
This document is an SEC Form 10-Q quarterly report filed by Xcel Energy Inc. for the quarter ended September 30, 2001. It provides consolidated financial statements including statements of income, cash flows, and balance sheets. For the quarter, Xcel Energy reported operating revenues of $3.8 billion and net income of $273 million. Total operating expenses were $3.1 billion. Earnings available for common shareholders were $272 million.
DTE Energy reported second quarter earnings of $0.42 per share, down from $0.55 per share in the second quarter of 2001, excluding merger and restructuring expenses. For the first six months of 2002, earnings per share increased 8% compared to 2001. DTE Energy narrowed its full-year 2002 earnings guidance to $3.75-$3.95 per share and initiated 2003 guidance of $3.90-$4.10 per share. Solid performance from the electric utility and contributions from non-regulated businesses such as coal-based fuels helped achieve results despite uncertain impacts from weather and economic conditions.
This document is FirstEnergy Corp.'s consolidated report for the first quarter of 2008. It provides highlights of financial results including non-GAAP earnings of $0.88 per share, unchanged from the prior year. Increased electric distribution deliveries and generation revenues were offset by higher fuel and purchased power costs. The report also reaffirms earnings guidance for 2008.
This document is an SEC Form 10-Q quarterly report filed by Xcel Energy Inc. for the quarter ended June 30, 2002. It includes consolidated statements of income showing operating revenues and expenses for the quarter and year-to-date, resulting in operating income of $345.6 million and $673 million respectively. It also reports net income of $87.3 million for the quarter and $190.8 million year-to-date, as well as earnings available to common shareholders of $86.2 million and $188.7 million.
The human brain has evolved over time to have three parts - the brain stem, paleomammalian brain, and human brain. As humans migrated to new environments, our brains and heads grew larger to help us adapt. The shift to walking on two legs instead of four allowed energy to be redirected to developing a more complex brain capable of symbolic thought. Key human abilities like theory of mind and dual representation enabled skills like understanding others' perspectives and representing concepts in multiple ways. Our brains continue evolving today.
The document discusses the benefits of exercise for mental health. Regular physical activity can help reduce anxiety and depression and improve mood and cognitive function. Exercise causes chemical changes in the brain that may help protect against mental illness and improve symptoms for those who already suffer from conditions like anxiety and depression.
El documento presenta una introducción sobre cómo manejar archivos y directorios en .NET, incluyendo cómo abrir, leer y escribir archivos usando clases como FileStream y StreamWriter. También cubre temas como mejorar la eficiencia de lectura y escritura usando buffers y almacenamiento en memoria.
Vision is our dominant sense for learning. The eyes receive light which is processed in the brain to form images. These visual images allow us to retain information 65% better than just listening. New technologies are increasingly using visual elements to help students learn complicated concepts by connecting new knowledge to images and diagrams.
DTE Energy reported first quarter earnings of $138 million compared to $117 million in the first quarter of 2000. Revenue from non-regulated businesses increased 251% to $817 million, contributing to increased earnings. The results were positively impacted by the suspension of the fuel clause and the company expects to complete its merger with MCN Energy in June, which is an important part of DTE Energy's growth strategy.
El documento describe cómo ejecutar métodos personalizados durante y después de la serialización mediante atributos como OnSerializingAttribute, OnSerializedAttribute, OnDeserializingAttribute y OnDeserializedAttribute. También explica cómo implementar la interfaz ISerializable para personalizar la serialización.
Neil Jones Brain Research Repeat To Rememberdrpetty
Our memory works through three steps: encoding, storage, and retrieval. Encoding involves transforming information for storage in memory. Stored information is then retrieved for later use. Repeating information through rehearsal helps with encoding, creating familiarity and understanding to better remember the information. Repeating information can be useful for remembering facts like vocabulary or names by constantly recalling it until it is fully understood.
El documento describe el posible uso del ciclo combinado en la industria azucarera. Explica que el ciclo combinado, que usa una turbina de gas y una de vapor acopladas, puede lograr una eficiencia mayor del 10% en comparación con el ciclo Rankine convencional. También analiza diferentes opciones de combustibles como la biomasa gasificada y los desafíos técnicos y económicos de la aplicación del ciclo combinado en la industria azucarera.
Women are more likely to experience certain psychiatric disorders such as depression, with 1 in 4 women experiencing depression at some point. They are also more likely to attempt suicide, though men die by suicide more often. Eating disorders like anorexia predominantly affect women, as do disorders like borderline personality disorder, around 75% of which afflict women. Men are more often diagnosed with schizophrenia, and they are also more likely to abuse drugs. Hormonal and biological differences between men and women as well as different social and environmental factors influence the development and prevalence of various mental health conditions across gender.
DTE Energy reported first quarter earnings of $138 million compared to $117 million in the first quarter of 2000. Revenue from non-regulated businesses increased 251% to $817 million, contributing to increased earnings. The results were positively impacted by the suspension of the fuel clause and the company expects to complete its merger with MCN Energy in June, which is an important part of DTE Energy's growth strategy.
DTE Energy reported a 20% increase in net income for the first quarter of 2004 compared to the same period in 2003. Operating expenses decreased 8% due to lower fuel and operation and maintenance costs. Operating income increased 68% while income from continuing operations rose 79%. Earnings per share from continuing operations were $1.14 for Q1 2004 compared to $0.65 for Q1 2003, an increase of 75%. Significant special items impacting comparability between the periods included a $0.28 per share benefit from a pipeline contract termination in 2004.
Bank of America reported second quarter 2007 results. Net income was $5.8 billion, up 4% from the previous year. Revenue increased 8% due to strong noninterest income growth across all business lines. Credit quality remained sound although provision expenses increased due to reserve builds. The company continued to see increases in deposits, assets under management, retail sales and checking account openings.
This document is an SEC Form 10-Q quarterly report filed by Xcel Energy Inc. for the quarter ended September 30, 2001. It provides consolidated financial statements including statements of income, cash flows, and balance sheets. For the quarter, Xcel Energy reported operating revenues of $3.8 billion and net income of $273 million. Total operating expenses were $3.1 billion. Earnings available for common shareholders were $272 million.
DTE Energy reported second quarter earnings of $0.42 per share, down from $0.55 per share in the second quarter of 2001, excluding merger and restructuring expenses. For the first six months of 2002, earnings per share increased 8% compared to 2001. DTE Energy narrowed its full-year 2002 earnings guidance to $3.75-$3.95 per share and initiated 2003 guidance of $3.90-$4.10 per share. Solid performance from the electric utility and contributions from non-regulated businesses such as coal-based fuels helped achieve results despite uncertain impacts from weather and economic conditions.
This document is FirstEnergy Corp.'s consolidated report for the first quarter of 2008. It provides highlights of financial results including non-GAAP earnings of $0.88 per share, unchanged from the prior year. Increased electric distribution deliveries and generation revenues were offset by higher fuel and purchased power costs. The report also reaffirms earnings guidance for 2008.
This document is an SEC Form 10-Q quarterly report filed by Xcel Energy Inc. for the quarter ended June 30, 2002. It includes consolidated statements of income showing operating revenues and expenses for the quarter and year-to-date, resulting in operating income of $345.6 million and $673 million respectively. It also reports net income of $87.3 million for the quarter and $190.8 million year-to-date, as well as earnings available to common shareholders of $86.2 million and $188.7 million.
The human brain has evolved over time to have three parts - the brain stem, paleomammalian brain, and human brain. As humans migrated to new environments, our brains and heads grew larger to help us adapt. The shift to walking on two legs instead of four allowed energy to be redirected to developing a more complex brain capable of symbolic thought. Key human abilities like theory of mind and dual representation enabled skills like understanding others' perspectives and representing concepts in multiple ways. Our brains continue evolving today.
The document discusses the benefits of exercise for mental health. Regular physical activity can help reduce anxiety and depression and improve mood and cognitive function. Exercise causes chemical changes in the brain that may help protect against mental illness and improve symptoms for those who already suffer from conditions like anxiety and depression.
El documento presenta una introducción sobre cómo manejar archivos y directorios en .NET, incluyendo cómo abrir, leer y escribir archivos usando clases como FileStream y StreamWriter. También cubre temas como mejorar la eficiencia de lectura y escritura usando buffers y almacenamiento en memoria.
Vision is our dominant sense for learning. The eyes receive light which is processed in the brain to form images. These visual images allow us to retain information 65% better than just listening. New technologies are increasingly using visual elements to help students learn complicated concepts by connecting new knowledge to images and diagrams.
DTE Energy reported first quarter earnings of $138 million compared to $117 million in the first quarter of 2000. Revenue from non-regulated businesses increased 251% to $817 million, contributing to increased earnings. The results were positively impacted by the suspension of the fuel clause and the company expects to complete its merger with MCN Energy in June, which is an important part of DTE Energy's growth strategy.
El documento describe cómo ejecutar métodos personalizados durante y después de la serialización mediante atributos como OnSerializingAttribute, OnSerializedAttribute, OnDeserializingAttribute y OnDeserializedAttribute. También explica cómo implementar la interfaz ISerializable para personalizar la serialización.
Neil Jones Brain Research Repeat To Rememberdrpetty
Our memory works through three steps: encoding, storage, and retrieval. Encoding involves transforming information for storage in memory. Stored information is then retrieved for later use. Repeating information through rehearsal helps with encoding, creating familiarity and understanding to better remember the information. Repeating information can be useful for remembering facts like vocabulary or names by constantly recalling it until it is fully understood.
El documento describe el posible uso del ciclo combinado en la industria azucarera. Explica que el ciclo combinado, que usa una turbina de gas y una de vapor acopladas, puede lograr una eficiencia mayor del 10% en comparación con el ciclo Rankine convencional. También analiza diferentes opciones de combustibles como la biomasa gasificada y los desafíos técnicos y económicos de la aplicación del ciclo combinado en la industria azucarera.
Women are more likely to experience certain psychiatric disorders such as depression, with 1 in 4 women experiencing depression at some point. They are also more likely to attempt suicide, though men die by suicide more often. Eating disorders like anorexia predominantly affect women, as do disorders like borderline personality disorder, around 75% of which afflict women. Men are more often diagnosed with schizophrenia, and they are also more likely to abuse drugs. Hormonal and biological differences between men and women as well as different social and environmental factors influence the development and prevalence of various mental health conditions across gender.
The document provides step-by-step instructions for installing and setting up a conversion reactor in HYSYS to model the dehydrogenation of ethylbenzene to styrene. It describes how to add the components and reaction, create a reaction set, attach it to the Peng-Robinson fluid package, install and configure a conversion reactor on the flowsheet, specify feed and operating conditions, and check the conversion calculation.
Tradeshows are an effective marketing tool that fulfill basic human needs to see and interact with others. They provide unique opportunities to make face-to-face connections with customers and prospects. While tradeshows require investment, research shows they can be more cost-effective for making initial contacts than traditional field sales. Exhibitors should select shows strategically, plan pre-show marketing, design their booth for maximum impact, and ensure follow-up on leads to fully realize the ROI potential of tradeshow participation.
Long-term memory (LTM) differs from short-term memory in that LTM can last from days to decades, while short-term memory lasts around 18 seconds. LTM influences our perceptions and what we pay attention to in the environment, providing the framework to which we attach new knowledge. The properties of LTM have important implications for instructional design.
Evaporators are used to reduce the volume of a liquid by boiling it. This concentrates the liquid and removes solvents. There are different types of evaporators that use heat exchange and decreasing pressure between effects to boil liquids. Key components include a heat exchanger, vacuum system, vapor separator and condenser. Process factors like material properties, temperatures, and pressures must be considered during evaporator operation.
DTE Energy reported financial results for the second quarter and first six months of 1999. Operating revenues increased 8.1% and 8.2% respectively compared to the same periods in 1998. However, operating expenses grew at a faster rate, leading to declines in operating income and net income. Higher fuel and purchased power costs and increased operation and maintenance expenses, particularly related to year 2000 remediation, drove overall expense growth.
DTE Energy reported financial results for the fourth quarter and full year 1999. For the quarter, operating revenues increased 10.1% to $1.1 billion but net income decreased 9.3% to $97 million due to higher fuel and operating costs. For the full year, operating revenues rose 12.0% to $4.7 billion and net income increased 9.0% to $483 million. Cash from operations was $1.1 billion for the year.
DTE Energy Company reported financial results for the second quarter of 2000. Operating revenues increased 24.2% to $1.428 billion due to higher fuel and purchased power costs. Net income was $108 million, down slightly from $110 million in the previous year. Earnings per share were $0.76, unchanged from the prior year when excluding one-time items. For the six months ended June 30, 2000, operating revenues increased 20.1% to $2.610 billion, while net income was $224 million, relatively unchanged from the previous year.
DTE Energy Company reported financial results for the first quarter of 2000. Operating revenues increased 15.4% to $1.182 billion due to higher fuel and purchased power expenses. Net income rose 1.7% to $117 million. Earnings per share increased 2.6% to $0.81. Excluding merger costs, EPS rose 6.1% to $0.84. Detroit Edison, DTE Energy's regulated utility, saw revenues increase 4.1% but net income fell 7.2% due to higher fuel expenses. Non-regulated subsidiaries contributed significantly higher earnings from new projects and trading gains.
DTE Energy Company reported financial results for the first quarter of 1999. Operating revenues increased 8.4% to $1.024 billion compared to $945 million in the first quarter of 1998. However, operating expenses rose 13.6% to $809 million, resulting in a 7.7% decline in operating income to $215 million. Net income increased 10.6% to $115 million due to a lower effective tax rate, though earnings per share grew at a slower rate of 9.7% to $0.79 per share. Total sales volumes increased across all customer classes for the first quarter of 1999 compared to the prior year.
- DTE Energy Company and Subsidiary Companies provided a condensed consolidated statement of income and balance sheet for the third quarter of 2000 compared to the third quarter of 1999.
- Key highlights include operating revenues increased 7.4% to $1.547 billion driven by higher fuel and purchased power costs, while operating income decreased 38.8% to $172 million.
- Net income including one-time items decreased 35.2% to $104 million, while earnings per share decreased 38.8% to $0.73 per share compared to the prior year.
DTE Energy reported a 20% increase in net income for the first quarter of 2004 compared to the same period in 2003. Total operating revenues were relatively flat at $2.093 billion for the quarter. Operating expenses declined 8% due to lower fuel and purchased power costs. Operating income increased 68% due to cost reductions. After adjustments including a pipeline contract termination benefit, net income increased 19% and diluted earnings per share rose from $0.92 to $1.09.
This document provides supplemental information for investors regarding Monsanto Company, including forward-looking statements and selected financial highlights from 2005-2008. Key points include that Monsanto is the world's leading agriculture company focused on seeds and traits, with 2008 net sales of $11.3 billion. Financial highlights show significant growth in net income, earnings per share, EBIT, and free cash flow over the period. The document also provides a reconciliation of non-GAAP earnings per share and notes that approximately half of Monsanto's 2008 net sales came from North America.
This document provides supplemental information for investors regarding Monsanto Company, including forward-looking statements and selected financial highlights from 2005-2008. Key points include that Monsanto is the world's leading agriculture company focused on seeds and traits, with 2008 net sales of $11.3 billion, net income of $2 billion, and diluted earnings per share of $3.62. The document also provides a reconciliation of non-GAAP earnings measures and notes that over half of Monsanto's 2008 net sales came from North America.
Monsanto's corn seeds and traits generated 56% of sales and 62% of gross profit in 2008. Key corn products include DEKALB hybrid seeds and popular biotech traits such as YieldGard Corn Borer, Roundup Ready Corn 2, and YieldGard Rootworm. These traits help control pests and weeds and have seen strong adoption rates in major markets like the US, Brazil, and Argentina. Looking ahead, newer "triple stack" products that combine multiple traits are gaining traction.
Monsanto's corn seeds and traits generated 56% of sales and 62% of gross profit in 2008. Key products include DEKALB hybrid corn seed, Roundup Ready corn traits which provide herbicide tolerance, and YieldGard traits which provide insect protection. YieldGard traits have been adopted on over 100 million acres since 1997 and reduce the need for insecticide applications. Roundup Ready traits have been adopted on over 150 million acres since 1998 and simplify weed control. New triple-stack traits combine herbicide tolerance and insect protection.
This document provides supplemental information for investors regarding Monsanto Company, including forward-looking statements and key financial highlights from 2005-2008. It summarizes that Monsanto is a leading global agriculture company focused on seeds and traits, with 2008 net sales of $11.4 billion, net income of $2 billion, and diluted earnings per share of $3.62. Approximately 54% of Monsanto's 2008 net sales came from North America.
The document summarizes the financial performance of a company for the third quarter and first nine months of fiscal years 2007 and 2006. It shows that net sales increased 7% for the quarter and 5% year-to-date. Earnings from continuing operations increased 15% for the quarter and 14% year-to-date. The Household and Specialty segments saw increased sales and earnings growth while International saw moderate growth. Total assets were $3.69 billion with total liabilities of $3.60 billion, leaving stockholders' equity of $159 million.
DTE Energy reported second quarter earnings of $0.42 per share, down from $0.55 per share in the second quarter of 2001, excluding merger and restructuring expenses. For the first six months of 2002, earnings per share increased 8% compared to 2001. DTE Energy narrowed its full-year 2002 earnings guidance to $3.75-$3.95 per share and initiated 2003 guidance of $3.90-$4.10 per share. Solid performance from the electric utility and contributions from non-regulated businesses such as coal-based fuels helped achieve results despite uncertain impacts from weather and economic conditions.
The document summarizes the financial performance of a company for the second quarter and first half of 2006 compared to 2005. It shows that net sales increased 3% in the second quarter and 4% for the first half, while earnings from continuing operations rose 13% and 14% respectively. Earnings per share also increased. By segment, the Specialty Group and International segments saw higher sales and earnings growth, while the Household Group-North America declined slightly. The balance sheet indicates total assets of $3.6 billion with current liabilities of $1.5 billion and long-term debt of $1.5 billion.
This document summarizes the financial performance of a company for the third quarter and first six months of 2007 compared to the same periods in 2006. It shows that net sales increased 8% in the third quarter and 7% for the first six months. Earnings from continuing operations were $92 million in the third quarter and $203 million for the first six months. On a per share basis, diluted earnings from continuing operations were $0.65 per share for the third quarter and $1.41 per share for the first six months. The company's North America segment grew net sales 6% in the third quarter while the International segment grew 17%.
This document summarizes FirstEnergy's financial results for the fourth quarter of 2007. Some key points:
- Normalized non-GAAP earnings were $0.90 per share for Q4 2007, up from $0.84 per share in Q4 2006.
- GAAP earnings for Q4 2007 were $0.88 per share, up from $0.85 per share in Q4 2006.
- For the full year 2007, normalized non-GAAP earnings were $4.23 per share, near the guidance range, and up from $3.88 per share in 2006.
This document provides a consolidated report and financial highlights for FirstEnergy Corp for the 4th quarter of 2007. Some key points:
- Normalized non-GAAP earnings per share for Q4 2007 were $0.90 compared to $0.84 in Q4 2006.
- GAAP earnings per share for Q4 2007 were $0.88 compared to $0.85 in Q4 2006.
- Normalized non-GAAP earnings for 2007 were $4.23 per share, near the top of guidance range.
- 2008 earnings guidance range is $4.15 to $4.35 per share.
Danaher Corporation announced record results for the second quarter of 2008, with net earnings from continuing operations of $363 million, an 18% increase over the second quarter of 2007. Sales increased 25% to $3.28 billion. The company also saw a 22% increase in adjusted net earnings from continuing operations, which excludes certain charges related to an acquisition. For the first six months of 2008, net earnings from continuing operations were $640 million, up 14.5% compared to the same period in 2007. The company's CEO stated that despite economic conditions, the company's businesses are well positioned for the rest of 2008.
Pepco Holdings, Inc. held an analyst conference on October 5-6, 2004 to discuss the company's performance. The presentation included an overview of PHI's businesses, strategy, and corporate governance practices. It noted PHI has $7.1 billion in revenues and focuses on its regulated electric and gas delivery business, which accounts for 72% of operating income. The Power Delivery segment was discussed, which includes the transmission and distribution of electricity to 1.8 million customers across several mid-Atlantic states.
The document discusses Joseph Rigby's presentation on the strategic positioning of Southeast Utilities. It summarizes the company's strategic focus on power delivery, Conectiv Energy, and Pepco Energy Services. It also outlines the goals for the power delivery business, including sales growth, infrastructure investment, operational excellence, and constructive regulatory outcomes to deliver average annual earnings growth of at least 4%. Key infrastructure projects are highlighted.
The document summarizes a presentation given by Joseph M. Rigby, CFO of Pepco Holdings, Inc. (PHI) at an investor conference on March 28, 2006. The presentation outlines PHI's strategy to remain a regional diversified energy delivery and competitive services company focused on operational excellence. It discusses PHI's power delivery business, Conectiv Energy, and Pepco Energy Services. The presentation also provides financial performance summaries and projections showing PHI's ability to cover dividends and capital expenditures with cash from operations.
The document provides an overview and summary of PHI's strategy and performance across its various business segments. PHI aims to remain a regional diversified energy delivery and competitive services company focused on value creation and operational excellence. Key aspects include achieving constructive regulatory outcomes and 4% annual earnings growth for its power delivery utilities, optimizing assets and market opportunities for Conectiv Energy, and expanding Pepco Energy Services into additional markets. Financial performance has been positively impacted by infrastructure investments and sales growth, though earnings have been reduced in some jurisdictions due to higher standard offer service pricing.
This document provides an overview of PHI and its strategy for positioning itself for success in a dynamic industry. PHI's strategy is to remain a diversified regional energy delivery and competitive services company focused on value creation and operational excellence. For its power delivery utility operations, PHI's goals are to operate with excellence, achieve constructive regulatory outcomes, invest in infrastructure, and deliver at least 4% annual average earnings growth. PHI's service territory has a robust economy that is less susceptible to downturns and includes diverse government and private sectors.
This document provides an overview of PHI's 41st EEI Financial Conference held from November 5-8, 2006. It includes sections on PHI's financial performance for Q3 and year-to-date 2006, drivers of performance, sales and customer trends, regulated distribution summaries, upcoming regulatory activities including transmission formula rate filings and rate cases, and PHI's proposed MAPP transmission project. Key highlights are lower sales due to mild weather, lower transmission revenue, and plans to file rate cases in late 2006/early 2007.
This document provides an overview and summary of Power Holdings Inc.'s (PHI) various business segments. It discusses PHI's regulated electric and gas delivery business, which accounts for 67% of operating income. It also summarizes Conectiv Energy's competitive merchant generation and load service business, which accounts for 33% of operating income. Key highlights from rate cases and recent regulatory activities involving PHI's delivery businesses are also provided. The document contains forward-looking statements and non-GAAP financial measures.
The document provides an overview of Pepco Holdings Inc.'s (PHI) power delivery business and regulatory environment. It summarizes PHI's sales and customer growth projections, infrastructure investment strategy including the proposed Mid-Atlantic Power Pathway transmission project and Blueprint for the Future initiative. Recent distribution rate case outcomes for PHI's utilities are also summarized. The document is intended as a presentation for investors on PHI's positioned for success through its regulated electric and gas delivery business.
The document provides an overview of Pepco Holdings Inc.'s (PHI) various businesses including its regulated electric and gas delivery business, competitive energy generation business, and energy services business. It discusses PHI's infrastructure investment strategies, the status of major projects like the Mid-Atlantic Power Pathway, and the company's regulatory environment. Financial projections show expectations for continued investment and growth across PHI's businesses.
The document discusses Pepco Holdings' strategic focus on infrastructure investments and customer programs to position the company for continued success. It outlines plans to invest $1.2 billion in the Mid-Atlantic Power Pathway transmission project through 2014 and $646 million in advanced metering infrastructure and other programs through the company's Blueprint for the Future initiative between 2008-2014. Regulatory support is essential for cost recovery for these investments, which aim to enhance reliability, manage costs and protect the environment for customers.
This document provides an overview of Pepco Holdings' transmission and distribution business. It discusses plans to invest over $5 billion from 2007-2012 to upgrade aging infrastructure and improve reliability. A key project is the $1.05 billion Mid-Atlantic Power Pathway, a 230-mile 500kV transmission line from Northern Virginia to Southern New Jersey to be completed by 2013. The presentation outlines the project timeline, environmental stewardship efforts, and cost recovery approach through PJM and FERC. It also reviews the company's focus on replacing aging transmission equipment to further enhance reliability.
The document provides an overview of Pepco Holdings, Inc.'s (PHI) strategy to build shareholder value. PHI aims to increase investment in infrastructure through its Blueprint programs to modernize its electric grid. It also plans growth for its competitive energy businesses, Conectiv Energy and Pepco Energy Services. PHI expects its regulated Power Delivery business to remain the primary driver of earnings, contributing 60-70% of operating income over the planning period through infrastructure investments and favorable regulatory outcomes.
This document provides an overview of Pepco Holdings, Inc.'s power delivery business. It discusses planned infrastructure investments totaling $4.99 billion from 2008-2012 to improve reliability, support load growth, and implement new technology. A key project is the $1.05 billion Mid-Atlantic Power Pathway transmission line. The document also reviews regulatory highlights, including recent rate cases, and outlines operational and financial summaries for the company's distribution and transmission businesses.
- Pepco Holdings held its annual meeting and provided its annual report to shareholders.
- In 2002, Pepco Holdings earned $210.5 million in consolidated earnings, or $1.61 per share. Earnings were driven by strong performance from regulated utility businesses and some competitive energy businesses.
- The letter discusses the company's strategy, leadership, and financial and operational performance across its various business segments in 2002. It also encourages shareholders to vote and continue supporting the company.
- Pepco Holdings provided its first annual report after merging Pepco and Conectiv in August 2002.
- In 2002, PHI earned $210.5 million, or $1.61 per share, on $4.3 billion in revenue. Excluding merger costs, earnings were $1.74 per share.
- The letter discusses the company's regulated utility and competitive energy businesses, noting stable earnings from utilities and growth potential from competitive businesses. It encourages shareholders to vote and thanks them for their confidence and investment.
This document provides a summary of Pepco Holdings' 2004 annual report and proxy statement. Key points include:
1) Pepco Holdings reported improved financial performance in 2004 with consolidated earnings of $258.7 million, up from $113.5 million in 2003, driven by improved performance of competitive energy businesses.
2) The company made progress on reducing debt and preferred stock by $480 million in 2004 and achieved a total shareholder return of over 22% for 2003-2004.
3) The regulated power delivery business continues as the primary focus and driver of steady cash flow. Earnings from this segment improved to $233.4 million in 2004.
4) Competitive energy businesses also posted
The document provides details on Pepco Holdings' 2003 performance and future plans. It discusses challenges faced in 2003 including an energy trading loss, Mirant's bankruptcy, and Hurricane Isabel. However, actions taken in 2003 such as divesting non-core businesses and reducing risk are expected to set the stage for future earnings growth. The company remains focused on strengthening its core power delivery business and improving customer satisfaction.
This document provides a summary of Pepco Holdings' 2004 annual report and proxy statement. Key points include:
1) Pepco Holdings reported improved financial performance in 2004 with consolidated earnings of $258.7 million, up from $113.5 million in 2003, driven by improved performance of competitive energy businesses.
2) The company made progress on reducing debt and preferred stock by $480 million in 2004 as part of its balance sheet improvement goals.
3) The regulated power delivery business continues as the primary focus due to its stability and cash generation. Earnings from this segment grew to $233.4 million in 2004.
4) Competitive energy businesses also posted profits in 2004 despite challenging markets
The document is the 2005 annual report and proxy statement from PHI (Pepco Holdings Inc.). It discusses PHI's strategy of focusing on stable power delivery and growing energy businesses. In 2005, PHI achieved earnings of $371.2 million and strengthened its balance sheet by paying down over $1 billion in debt. Rising energy prices present challenges for PHI and its customers. The proxy statement announces the annual meeting to elect directors and ratify the independent auditor.
What Lessons Can New Investors Learn from Newman Leech’s Success?Newman Leech
Newman Leech's success in the real estate industry is based on key lessons and principles, offering practical advice for new investors and serving as a blueprint for building a successful career.
13 Jun 24 ILC Retirement Income Summit - slides.pptxILC- UK
ILC's Retirement Income Summit was hosted by M&G and supported by Canada Life. The event brought together key policymakers, influencers and experts to help identify policy priorities for the next Government and ensure more of us have access to a decent income in retirement.
Contributors included:
Jo Blanden, Professor in Economics, University of Surrey
Clive Bolton, CEO, Life Insurance M&G Plc
Jim Boyd, CEO, Equity Release Council
Molly Broome, Economist, Resolution Foundation
Nida Broughton, Co-Director of Economic Policy, Behavioural Insights Team
Jonathan Cribb, Associate Director and Head of Retirement, Savings, and Ageing, Institute for Fiscal Studies
Joanna Elson CBE, Chief Executive Officer, Independent Age
Tom Evans, Managing Director of Retirement, Canada Life
Steve Groves, Chair, Key Retirement Group
Tish Hanifan, Founder and Joint Chair of the Society of Later life Advisers
Sue Lewis, ILC Trustee
Siobhan Lough, Senior Consultant, Hymans Robertson
Mick McAteer, Co-Director, The Financial Inclusion Centre
Stuart McDonald MBE, Head of Longevity and Democratic Insights, LCP
Anusha Mittal, Managing Director, Individual Life and Pensions, M&G Life
Shelley Morris, Senior Project Manager, Living Pension, Living Wage Foundation
Sarah O'Grady, Journalist
Will Sherlock, Head of External Relations, M&G Plc
Daniela Silcock, Head of Policy Research, Pensions Policy Institute
David Sinclair, Chief Executive, ILC
Jordi Skilbeck, Senior Policy Advisor, Pensions and Lifetime Savings Association
Rt Hon Sir Stephen Timms, former Chair, Work & Pensions Committee
Nigel Waterson, ILC Trustee
Jackie Wells, Strategy and Policy Consultant, ILC Strategic Advisory Board
Discovering Delhi - India's Cultural Capital.pptxcosmo-soil
Delhi, the heartbeat of India, offers a rich blend of history, culture, and modernity. From iconic landmarks like the Red Fort to bustling commercial hubs and vibrant culinary scenes, Delhi's real estate landscape is dynamic and diverse. Discover the essence of India's capital, where tradition meets innovation.
How to Identify the Best Crypto to Buy Now in 2024.pdfKezex (KZX)
To identify the best crypto to buy in 2024, analyze market trends, assess the project's fundamentals, review the development team and community, monitor adoption rates, and evaluate risk tolerance. Stay updated with news, regulatory changes, and expert opinions to make informed decisions.
University of North Carolina at Charlotte degree offer diploma Transcripttscdzuip
办理美国UNCC毕业证书制作北卡大学夏洛特分校假文凭定制Q微168899991做UNCC留信网教留服认证海牙认证改UNCC成绩单GPA做UNCC假学位证假文凭高仿毕业证GRE代考如何申请北卡罗莱纳大学夏洛特分校University of North Carolina at Charlotte degree offer diploma Transcript
Falcon stands out as a top-tier P2P Invoice Discounting platform in India, bridging esteemed blue-chip companies and eager investors. Our goal is to transform the investment landscape in India by establishing a comprehensive destination for borrowers and investors with diverse profiles and needs, all while minimizing risk. What sets Falcon apart is the elimination of intermediaries such as commercial banks and depository institutions, allowing investors to enjoy higher yields.
An accounting information system (AIS) refers to tools and systems designed for the collection and display of accounting information so accountants and executives can make informed decisions.
Monthly Market Risk Update: June 2024 [SlideShare]Commonwealth
Markets rallied in May, with all three major U.S. equity indices up for the month, said Sam Millette, director of fixed income, in his latest Market Risk Update.
For more market updates, subscribe to The Independent Market Observer at https://blog.commonwealth.com/independent-market-observer.
In World Expo 2010 Shanghai – the most visited Expo in the World History
https://www.britannica.com/event/Expo-Shanghai-2010
China’s official organizer of the Expo, CCPIT (China Council for the Promotion of International Trade https://en.ccpit.org/) has chosen Dr. Alyce Su as the Cover Person with Cover Story, in the Expo’s official magazine distributed throughout the Expo, showcasing China’s New Generation of Leaders to the World.
1. DTE ENERGY COMPANY AND SUBSIDIARY COMPANIES
CONDENSED CONSOLIDATED STATEMENT OF INCOME (PRELIMINARY/UNAUDITED)
(Dollars in Millions, Expect Per Share Amounts)
3 Months Sept. 30 After Tax
1999 1998 % Change $ Change EPS Impact *
Operating Revenues $1,440 $1,199 20.1% $241 $1.07
Operating Expenses
Fuel & Purchased power 510 359 42.2% 151 ($0.68)
Operation and maintenance 397 338 17.4% 59 ($0.26)
Depreciation and amortization 183 169 8.0% 14 ($0.06)
Taxes other than income 69 67 2.7% 2 ($0.01)
Total Operating Expenses $1,159 $933 24.3% $226 ($1.01)
Operating Income $281 $266 5.4% $15 $0.06
Interest Expense and Other
Interest Expense 95 83 14.5% $12 ($0.05)
Pref. Stock Dividend of Subsidiary 1 -100.0% (1) $0.00
Other Expense- net 4 4 -11.4% (0) $0.00
Net Interest Expense and Other $99 $88 12.1% $11 ($0.05)
Income Before Income Taxes $182 $178 2.2% $4 $0.01
Income Taxes 21 46 -54.0% (25) $0.19
Net Income $161 $132 21.8% $29 $0.20
Common Sh. Outstanding - Avg 145 145 0.00%
Earnings Per Common Share $1.11 $0.91 21.8% $0.20
* Earnings impact figures are estimates The Condensed Consolidated Statement of Income (Unaudited) should be read in
Differences may exist due to rounding conjunction with the Notes to Consolidated Financial Statements appearing in the
Please see additional detail on Page 4 Annual Report to Shareholders, 10K, and 10Q.
DTE Investor Relations (313) 235 - 8030 2
2. DTE ENERGY COMPANY AND SUBSIDIARY COMPANIES
CONDENSED CONSOLIDATED STATEMENT OF INCOME (PRELIMINARY/UNAUDITED)
(Dollars in Millions, Expect Per Share Amounts)
9 Months September 30 After Tax
1999 1998 % Change $ Change EPS Impact *
Operating Revenues $3,614 $3,208 12.7% $406 $1.82
Operating Expenses
Fuel and Purchased power 1,063 852 24.8% 211 ($0.96)
Operation and Maintenance 1,086 906 19.9% 180 ($0.81)
Depreciation and amortization 547 496 10.3% 51 ($0.23)
Taxes other than income 211 207 1.9% 4 ($0.01)
Total Operating Expenses $2,907 $2,461 18.1% $446 ($2.00)
Operating Income $707 $747 -5.4% ($40) ($0.18)
Interest Expense and Other
Interest Expense 260 236 10.2% 24 ($0.11)
Pref. Stock Dividend of Subsidiary - 6 -100.0% (6) $0.03
Other - net 13 9 47.7% (4) ($0.02)
Net Interest Expense and Other $273 $251 8.9% $22 ($0.10)
Income Before Income Taxes $434 $496 -12.6% ($62) ($0.28)
Income Taxes $48 $159 -69.8% (111) $0.62
Net Income $386 $337 14.4% $49 $0.34
Common Sh. Outstanding - Avg 145 145 0.00%
Earnings Per Common Share $2.66 $2.32 14.4% $0.34
* Earnings impact figures are estimates The Condensed Consolidated Statement of Income (Unaudited) should be read in
Differences may exist due to rounding conjunction with the Notes to Consolidated Financial Statements appearing in the
Annual Report to Shareholders, 10K, and 10Q.
DTE Investor Relations (313) 235-8030 3
3. DTE ENERGY COMPANY AND SUBSIDIARY COMPANIES
Earnings Analysis - Detail 3rd Quarter
Change from 09/30/98 After-Tax
Per Share Impact
Beginning Earnings Per Share $0.91
Regulated Operating Revenues
Net System Sales $0.13
Incremental Rate Reduction in 1999 ($0.08)
1998 Fermi 2 Performance Reserve $0.15
Total Regulated Net Revenues $0.20
Regulated Oper. & Maintenance Expense
Storms and Heat-Related Trouble (0.08)
Other (0.04)
Taxes other than income (0.01)
Regulated Oper. & Maintenance Expense ($0.13)
Depreciation & Amortization ($0.06)
Interest Expense ($0.04)
Income Taxes $0.13
Due to full normalization of Fermi regulatory assets in
1999
Regulated Net Income (Detroit Edison) $0.10
Non-Regulated Net Income:
Increased income due to full year operations of Burns
Harbor coke battery, slightly offset by Plug Power
losses $0.08
Subtotal: Non-Regulated Subsidiaries $0.08
DTE Energy Holding and DTE Capital Inc. $0.02
Earnings Per Share Change $0.20
DTE Energy Ending Earnings Per Share $1.11
Differences may exist due to rounding.
DTE Investor Relations (313) 235-8030 4
4. DTE ENERGY COMPANY AND SUBSIDIARY COMPANIES
TRAILING 12-MONTH ANALYSIS - REPORTED EPS
As of September 30, 1999
Detroit Edison
4Q 1Q 2Q 3Q Total EPS Growth (%)
1998 $0.87 $0.66 $0.64 $0.85 $3.02
1999 $0.68 $0.71 $0.74 $0.95 $3.08 2.0%
Non-Regulated Subsidiaries (Additional Detail Provided Below)
4Q 1Q 2Q 3Q Total
1998 $0.03 $0.06 $0.07 $0.07 $0.23
1999 $0.09 $0.10 $0.07 $0.16 $0.41
DTE Capital / DTE Holding Company
4Q 1Q 2Q 3Q Total
1998 ($0.01) $0.00 ($0.02) ($0.01) ($0.04)
1999 ($0.04) ($0.02) ($0.05) $0.00 ($0.11)
DTE Energy Company
4Q 1Q 2Q 3Q Total EPS Growth (%)
1998 $0.89 $0.72 $0.69 $0.91 $3.21
1999 $0.73 $0.79 $0.76 $1.11 $3.39 5.4%
1999 Non-Regulated Earnings Per Share by Activity *
1Q 2Q 3Q 4Q Total
Coal Related $0.11 $0.11 $0.19 $0.41
Renewables $0.01 $0.00 $0.01 $0.02
Market Development ($0.01) ($0.03) ($0.02) ($0.06)
Plug Power, LLC ($0.01) ($0.02) ($0.02) ($0.04)
Other $0.00 $0.00 $0.00 $0.00
Total Non-Regulated Subsidiaries $0.10 $0.07 $0.16 $0.00 $0.33
DTE Capital / DTE Holding Co. ($0.02) ($0.05) $0.00 ($0.07)
Total 1999 Non-Regulated EPS $0.08 $0.02 $0.16 $0.00 $0.26
* Differences may exist due to rounding
DTE Investor Relations (313) 235-8030 5
5. DTE ENERGY COMPANY AND SUBSIDIARY COMPANIES
CONDENSED CONSOLIDATED BALANCE SHEET (PRELIMINARY/UNAUDITED)
(Dollars in Millions, Expect Per Share Amounts)
Percent
ASSETS Sept. 30, 1999 Dec. 31, 1998 Change
Current Assets
Cash and Cash Equivalents $54 $130 -58.6%
Restricted Cash 317 121 161.8%
Acounts Receivable
Customer (less allowance for doubtful
accounts of $21 and $20, respectively) 437 316 38.4%
Accrued Unbilled Revenues 154 153 0.7%
Other 97 135 -27.9%
Inventories (at average cost)
Fuel 148 171 -13.3%
Materials and Supplies 160 167 -4.4%
Other 88 39 125.8%
Total Current Assets $1,455 $1,232 18.1%
Investments
Nuclear Decommissioning Trust Funds 337 309 9.0%
Other 229 261 -12.3%
$566 $570 -0.8%
Property
Property, Plant and Equipment 11,580 11,121 4.1%
Property under Capital Leases 222 242 -8.2%
Nuclear Fuel under Capital Lease 662 659 0.5%
Construction Work in Progress 108 156 -30.6%
$12,572 $12,178 3.2%
Less Accumulated Depreciation & Amortization 5,508 5,235 5.2%
7,065 6,943 1.8%
Regulatory Assets 2,972 3,091 -3.9%
Other Assets 259 252 2.8%
Total Assets $12,316 $12,088 1.9%
The Condensed Consolidated Balance Sheet (Unaudited) should be read in conjunction with the
Notes to Consolidated Financial Statements appearing in the Annual Report to Shareholders, 10K, and 10Q.
DTE Investor Relations (313) 235-8030 6
6. DTE ENERGY COMPANY AND SUBSIDIARY COMPANIES
CONDENSED CONSOLIDATED BALANCE SHEET (PRELIMINARY/UNAUDITED)
(Dollars in Millions, Except Per Share Amounts)
Percent
LIABILITIES Sept. 30, 1999 Dec. 31, 1998 Change
Current Liabilities
Accounts Payable $215 $239 -10.2%
Accrued Interest 53 57 -6.5%
Dividends Payable 75 75 -0.4%
Accrued Payroll 86 101 -15.0%
Short-term Borrowings 296 231 28.2%
Income taxes 73 69 5.3%
Current Portion Long-term Debt 566 294 92.4%
Current Portion Capital Leases 87 118 -26.5%
Other 242 208 16.3%
$1,692 $1,392 21.5%
Other Liabilities
Deferred Income Taxes 1,902 1,888 0.7%
Capital Leases 118 126 -6.5%
Regulatory Liabilities 230 294 -21.7%
Other 532 493 7.9%
2,782 2,801 -0.7%
Long-Term Debt $3,985 $4,197 -5.1%
Shareholder's Equity
Common Stock, without par value, 400,000,000 shares
authorized, 145,045,159 and 145,071,317 issued and
outstanding, respectively 1,950 1,951 0.0%
Retained Earnings 1,908 1,747 9.2%
Total Shareholder's Equity $3,858 $3,698 4.3%
Total Liabilities and Shareholder's Equity $12,316 $12,088 1.9%
The Condensed Consolidated Balance Sheet (Unaudited) should be read in conjunction with the Notes to
Consolidated Financial Statements appearing in the Annual Report to Shareholders, 10K, and 10Q.
DTE Investor Relations (313) 235-8030 7
7. DTE ENERGY COMPANY AND SUBSIDIARY COMPANIES
CONDENSED CONSOLIDATED STATEMENT OF CASH FLOWS
(PRELIMINARY/UNAUDITED)
(Dollars in Millions, Except Per Share Amounts)
9 Months Ended Sept 30
1999 1998
Operating Activities
Net Income $386 $337
Adjustments to reconcile net income to net cash from operating activities:
Depreciation and Amortization 518 474
Other (41) (111)
Changes in current assets and liabilities:
Restricted Cash (196) (70)
Accounts Receivable (85) (89)
Inventories 30 (36)
Payables (44) 51
Other (16) 44
Net cash from operating activities $552 $600
Investing Activities
Plant and Equipment Expenditures (491) (632)
Removal Costs (39) (23)
Investment in coke oven battery business (195)
Net cash used for investing activities ($530) ($850)
Financing Activities
Issuance of Long-term Debt $264 $363
Increase (Decrease) in Short-term Borrowings 65 356
Redemption of Long-term Debt (204) (187)
Redemption of Preferred Stock - (100)
Dividends on Common Stock (224) (224)
Other - 3
Net cash used for financing activities ($99) $211
Net Increase (Decrease) in Cash and Temporary Cash Investments (77) (38)
Cash and Cash Equivalents at Beginning of the Period 131 99
Cash and Cash Equivalents at End of the Period $54 $60
The Condensed Consolidated Statement of Cash Flows (Unaudited) should be read in conjunction with the Notes to
Consolidated Financial Statements appearing in the Annual Report to Shareholders, 10K, and 10Q.
8
DTE Investor Relations (313) 235-8030
8. THE DETROIT EDISON COMPANY
STATEMENT OF INCOME (PRELIMINARY/UNAUDITED)
(Dollars in Millions, Expect Per Share Amounts)
3 Months Sept. 30 After Tax
1999 1998 % Change $ Change EPS Impact *
Operating Revenues $1,211 $1,105 9.6% $106 $0.48
Operating Expenses
Fuel & Purchased power 405 344 17.7% 61 ($0.27)
Operation and maintenance 275 249 10.4% 26 ($0.12)
Depreciation and amortization 176 162 8.6% 14 ($0.06)
Taxes other than income 69 66 4.5% 3 ($0.01)
Total Operating Expenses $925 $821 12.7% $104 ($0.47)
Operating Income $286 $284 0.7% $2 $0.01
Interest Expense and Other
Interest Expense 82 72 13.9% $10 ($0.04)
Other Expense- net 1 3 -66.7% (2) ($0.00)
Net Interest Expense and Other $83 $75 10.7% $8 ($0.04)
Income Before Income Taxes $203 $209 -2.9% ($6) ($0.03)
Income Taxes 65 84 -22.6% ($19) $0.13
Net Income $138 $125 10.4% $13 $0.10
Preferred Stock Dividends - $1 -100.0% ($1) 0.00
Net Income Available for Common Stock $138 $124 11.0% $14 $0.10
* Earnings impact figures are estimates The Condensed Consolidated Statement of Income (Unaudited) should be read in
Differences may exist due to rounding conjunction with the Notes to Consolidated Financial Statements appearing in the
Please see additional detail on Page 4 Annual Report to Shareholders, 10K, and 10Q.
DTE Investor Relations (313) 235 - 8030 9
9. THE DETROIT EDISON COMPANY
STATEMENT OF INCOME (PRELIMINARY/UNAUDITED)
(Dollars in Millions, Expect Per Share Amounts)
9 Months Sept. 30 After Tax
1999 1998 % Change $ Change EPS Impact *
Operating Revenues $3,128 $2,998 4.3% $130 $0.58
Operating Expenses
Fuel and Purchased power 888 818 8.6% 70 (0.31)
Operation and Maintenance 773 719 7.5% 54 (0.24)
Depreciation and amortization 522 486 7.4% 36 (0.16)
Taxes other than income 210 206 1.9% 4 (0.02)
Total Operating Expenses $2,393 $2,229 7.4% $164 (0.74)
Operating Income $735 $769 -4.4% ($34) ($0.15)
Interest Expense and Other
Interest Expense 219 208 5.3% 11 ($0.05)
Other - net 3 13 -76.9% (10) $0.04
Net Interest Expense and Other $222 $221 0.5% $1 ($0.01)
Income Before Income Taxes $513 $548 -6.4% ($35) ($0.16)
Income Taxes $164 $230 -28.6% ($66) $0.38
Net Income $349 $318 9.6% $31 $0.22
Preferred Stock Dividends $6 -100.0% ($6) $0.04
Net Income Available for Common Stock $349 $312 11.6% $36 $0.26
* Earnings impact figures are estimates The Condensed Consolidated Statement of Income (Unaudited) should be read in
Differences may exist due to rounding conjunction with the Notes to Consolidated Financial Statements appearing in the
Annual Report to Shareholders, 10K, and 10Q.
DTE Investor Relations (313) 235-8030 10
10. DTE ENERGY COMPANY AND SUBSIDIARY COMPANIES
SELECTED FINANCIAL RATIOS (PRELIMINARY/UNAUDITED)
Twelve Months Ended
September
1999 1998
Coverage Ratios (SEC Basis):
2.42 2.96
Ratio of Earnings to Fixed Charges (SEC Basis)
Ratio of Earnings to Fixed Charges
2.52 3.10
(Excluding Non-Recourse Debt Interest Expense)
13.2% 13.0%
Return on Average Common Equity
12.7% 12.8%
Return on Average Common Equity (Detroit Edison - Electirc & Steam)
60.7% 64.2%
Common Stock Dividend Payout
135.3% 113.1%
Funds Generated Internally for Construction
8.1% 32.6%
Effective Federal Income Tax Rate
$26.60 $25.25
Book Value Per Common Share
Capital Structure
1999 1998
Traditional Method
49.2% 47.6%
Common Shareholders' Equity
0.0% 0.6%
Preferred Stock
4.9% 4.3%
Deeply Subordinated Debt (QUIDS)
45.9% 47.5%
Long-Term Debt
100% 100%
Total
Rating Agency Method
43.3% 43.0%
Common Shareholders' Equity
(1)
4.3% 4.5%
Preferred Stock & Deeply Subordinated Debt (QUIDS)
Long-Term Debt (2) 52.4% 52.5%
100% 100%
Total
Capital Structure
(Excluding Non-Recourse Debt)
1999 1998
Traditional Method
51.0% 50.1%
Common Shareholders' Equity
0.0% 0.6%
Preferred Stock
5.1% 4.6%
Deeply Subordinated Debt (QUIDS)
43.9% 44.7%
Long-Term Debt
100% 100%
Total
Rating Agency Method
45.2% 45.3%
Common Shareholders' Equity
Preferred Stock & Deeply Subordinated Debt (QUIDS) (1) 4.5% 4.7%
Long-Term Debt (2) 50.3% 50.0%
100% 100%
Total
(1)
Includes amounts due within one year.
(2)
Includes amounts due within one year, obligations under capital leases (current and non-current) and short-term debt.
DTE Investor Relations (313) 235-8030 11
11. 1999 SALES ANALYSIS
(GWH)
Sales As
3Q 3Q % Chg YTD YTD % Chg % of
Category 1999 1998 1999 1999 1998 YTD 99 Total
Residential 4,231 4,149 2.0% 10,954 10,617 3.2% 26.2%
Commercial
Secondary 2,834 2,832 0.1% 8,021 7,838 2.3% 19.2%
Primary 2,426 2,461 -1.5% 6,822 6,596 3.4% 16.3%
Total Commercial 5,260 5,294 -0.6% 14,843 14,434 2.8% 35.5%
Industrial
Automotive 2,282 1,905 19.8% 5,982 5,552 7.7% 14.3%
Steel 749 727 3.0% 2,113 2,177 -2.9% 5.0%
Other Manufacturing 1,150 1,131 1.7% 3,531 3,380 4.5% 8.4%
Total Industrial 4,182 3,764 11.1% 11,626 11,109 4.7% 27.8%
Other 642 570 12.6% 1,900 1,722 10.3% 4.5%
Total System Sales 14,314 13,777 3.9% 39,324 37,883 3.8% 94.0%
Interconnection 620 838 -26.0% 2,532 3,594 -29.6% 6.0%
Total Sales 14,934 14,615 2.2% 41,855 41,477 0.9% 100.0%
Third Quarter Heating and Cooling Degree Day Data
1999 1998 % Change
Heating Degree Days 84 46 82.6%
Cooling Degree Days 647 667 -3.0%
Finance and Investor Relations (313) 235-8030 12