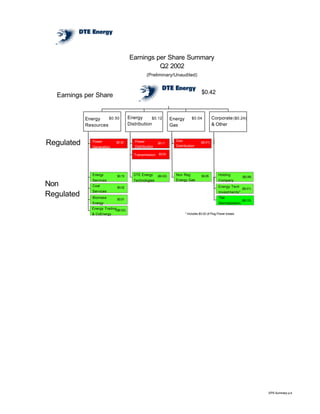
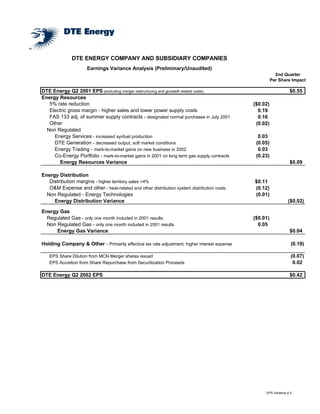
DTE Energy reported second quarter earnings of $0.42 per share, down from $0.55 per share in the second quarter of 2001, excluding merger and restructuring expenses. For the first six months of 2002, earnings per share increased 8% compared to 2001. DTE Energy narrowed its full-year 2002 earnings guidance to $3.75-$3.95 per share and initiated 2003 guidance of $3.90-$4.10 per share. Solid performance from the electric utility and contributions from non-regulated businesses such as coal-based fuels helped achieve results despite uncertain impacts from weather and economic conditions.
DTE Energy reported third quarter earnings of $0.96 per share, up from $0.51 per share in the third quarter of 2001, excluding merger and restructuring expenses. Year-to-date earnings increased 30% compared to 2001. The company's regulated utility operations performed well due to higher residential sales from increased cooling demand and lower fuel costs. Non-regulated businesses such as energy services also contributed significantly to earnings. DTE Energy reaffirmed its guidance for 2002 earnings of $3.75-$3.95 per share and 2003 earnings of $3.90-$4.10 per share, expecting continued challenges from the economy but benefits from cost controls.
DTE Energy reported strong financial results for 2001. Operating earnings excluding merger and restructuring charges were $536 million compared to $484 million in 2000, an increase of 10.7%. Overall earnings were $332 million compared to $468 million in 2000, reflecting merger-related charges. Non-regulated energy businesses exceeded their earnings target, contributing $162 million in net income. Looking ahead, DTE Energy expects its compound annual earnings growth rate to increase to between 6-8% by 2005 and provided earnings guidance of $3.70 to $4.00 per share for 2002.
DTE Energy reported 2000 earnings of $468 million, down slightly from 1999. Earnings were impacted by one-time charges of $0.15 per share for a residential rate reduction and $0.12 per share for merger costs. Excluding these, earnings rose 6.3% to $3.54 per share. Non-regulated businesses contributed earnings of $0.59 per share, up 22% over 1999 due to new projects. While results were mixed due to weather and plant issues, cost controls and growth in commercial sales helped offset impacts.
DTE Energy reported first quarter earnings of $138 million compared to $117 million in the first quarter of 2000. Revenue from non-regulated businesses increased 251% to $817 million, contributing to increased earnings. The results were positively impacted by the suspension of the fuel clause and the company expects to complete its merger with MCN Energy in June, which is an important part of DTE Energy's growth strategy.
DTE Energy reported financial results for the fourth quarter and full year 1999. For the quarter, operating revenues increased 10.1% to $1.1 billion but net income decreased 9.3% to $97 million due to higher fuel and operating costs. For the full year, operating revenues rose 12.0% to $4.7 billion while net income grew 9.0% to $483 million due to increased industrial sales and non-regulated business income, partially offset by higher fuel expenses. Cash from operating activities totaled $1.1 billion for 1999.
This document provides Burlington Northern Santa Fe Corporation's financial results for the 2nd quarter of 2008. It includes:
- Freight revenues increased 16% to $4.35 billion compared to $3.74 billion in 2Q2007, driven by improved yields and higher fuel surcharges.
- Operating income was $714 million compared to $841 million in 2Q2007, with a $474 million increase in fuel expenses and $175 million environmental charge.
- Net income was $350 million compared to $433 million in 2Q2007, with earnings per share of $1.00 compared to $1.20 previously.
- Capital expenditures for 2008 will increase to $2.
DTE Energy reported strong financial results for the first quarter of 2002, with net income of $200 million, a 44% increase over the previous year. Earnings per share increased 27% to $1.24. The results were driven by higher earnings from non-regulated businesses and the addition of DTE Energy's gas distribution business. Despite challenges like a mild winter and slow economic recovery, the company reaffirmed its full-year earnings target of $3.70 to $4.00 per share due to the diversity of its businesses.
- Bank of America reported third quarter 2006 results with total revenue of $18.961 billion, an 11% increase from third quarter 2005, and net income of $5.416 billion, a 20% increase.
- Net interest income was $8.894 billion, a 1% increase, impacted by the sale of Brazilian operations and prior year FAS 133 impact. Noninterest income increased 20% to $10.067 billion.
- Global Consumer & Small Business Banking reported net income of $2.889 billion, a 13% increase, driven by increases in cards, deposits, and debit purchase volume.
Southern California Edison Company (SCE) is one of the largest electric utilities in the US, serving over 4.5 million customers in central and southern California. SCE has operated for over 117 years and is headquartered in Rosemead, California. The document provides an overview of SCE's financial performance from 1998-2002, including operating revenue, expenses, income, balance sheet information and other key metrics. It also discusses regulatory developments affecting SCE and their impact on reported results.
- DTE Energy Company and Subsidiary Companies provided a condensed consolidated statement of income and balance sheet for the third quarter of 2000 compared to the third quarter of 1999.
- Key highlights include operating revenues increased 7.4% to $1.547 billion driven by higher fuel and purchased power costs, while operating income decreased 38.8% to $172 million.
- Net income including one-time items decreased 35.2% to $104 million, while earnings per share decreased 38.8% to $0.73 per share compared to the prior year.
Bank of America reported second quarter 2007 results. Net income was $5.8 billion, up 4% from the previous year. Revenue increased 8% due to strong noninterest income growth across all business lines. Credit quality remained sound although provision expenses increased due to reserve builds. The company continued to see increases in deposits, assets under management, retail sales and checking account openings.
DTE Energy Company reported financial results for the third quarter of 1999. Operating revenues increased 20.1% to $1.44 billion due to higher net system sales and a performance reserve from Fermi 2. Total operating expenses rose 24.3% to $1.16 billion primarily from increased fuel and purchased power costs. As a result, operating income grew 5.4% while net income increased 21.8% and earnings per share rose 21.8% to $1.11.
The Clorox Company reported financial results for the second quarter and first half of fiscal year 2009. Net sales increased 3% to $1.216 billion in the quarter and 7% to $2.6 billion in the first six months. Earnings per share were $0.62 for the quarter and $1.52 for the six month period. The North America segment grew net sales 3% to $1.007 billion and earnings 6% to $273 million in the quarter. International sales were flat at $209 million in the quarter but earnings declined 24% to $29 million. Total assets were $4.398 billion against $4.801 billion in total liabilities as of December 31, 2008.
"2012/2013 Income, Estate and Gift Tax Changes a Result of the 'Fiscal Cliff'...Dinsmore & Shohl LLP
"2012/2013 Income, Estate and Gift Tax Changes a Result of the 'Fiscal Cliff'," Financial Planning Association of Southwestern Ohio, Election Preview Virtual Conference
1) The document provides cautionary statements regarding Southern Company's forward-looking financial information for 2009, noting various factors that could cause actual results to differ from expectations.
2) It summarizes drivers of earnings growth between 2007 and 2008, and provides Southern Company's capital expenditure forecast and major projects for 2009-2011.
3) Southern Company aims for long-term average earnings per share growth of 6% annually and provides earnings per share guidance of $2.30 to $2.45 for 2009.
Energy East Corporation announced its 2007 financial results, reporting earnings per share of $1.62 for the year and $0.47 for the fourth quarter. Earnings per share for the full year decreased 15 cents compared to 2006, primarily due to an adverse electric rate decision in New York and higher average shares outstanding. Earnings per share for the fourth quarter decreased 6 cents year-over-year mainly because of lower electric margins, partially offset by higher natural gas margins. Energy East serves about 3 million customers in upstate New York and New England.
This document summarizes the financial performance of a company for the third quarter and first six months of 2007 compared to the same periods in 2006. It shows that net sales increased 8% in the third quarter and 7% for the first six months. Earnings from continuing operations were $92 million in the third quarter and $203 million for the first six months. On a per share basis, diluted earnings from continuing operations were $0.65 per share for the third quarter and $1.41 per share for the first six months. The company's North America segment grew net sales 6% in the third quarter while the International segment grew 17%.
Omnicom reported its annual financial results for 2003. Key points include:
- Revenue increased 14% to $8.6 billion, with 10% growth domestically and 20% internationally.
- Net income grew 5% to $675.9 million and diluted earnings per share rose 4% to $3.59.
- Operating margins declined slightly to 13.5% due to changes in business mix and increased severance costs.
- The company won over $4 billion in new business and increased its dividend.
- Revenues from the top 250 clients grew over 15%, outpacing total revenue growth.
The document is DTE Energy Company's condensed consolidated statement of income and balance sheet for the first quarter of 1999 compared to the same period in 1998. Some key points:
- Operating revenues increased 8.4% to $1,024 million, while operating expenses rose 13.6% to $809 million, resulting in a 7.7% decrease in operating income to $215 million.
- Net income increased 10.6% to $115 million due to higher regulated revenues and lower expenses, as well as improved performance from non-regulated subsidiaries.
- As of March 31, 1999, current assets decreased primarily due to lower cash and cash equivalents, while accounts receivable and inventories
DTE Energy Company reported financial results for the first quarter of 2000. Operating revenues increased 15.4% to $1.182 billion due to a 48.9% rise in fuel and purchased power costs. Net income rose 1.7% to $117 million. Earnings per share increased 2.6% to $0.81, or $0.84 excluding merger costs. Detroit Edison, DTE Energy's regulated utility, saw operating revenues increase 4.1% but net income fell 7.2% due to higher fuel expenses. Non-regulated subsidiaries contributed significantly to earnings growth through new projects and trading gains.
DTE Energy filed its second quarter 2003 Form 10-Q with the SEC, reporting a loss of $39 million compared to an unaudited loss of $23 million previously announced. This was due to less insurance coverage than expected for an April ice storm. Operating earnings for the quarter were $70 million, in line with the company's full-year 2003 operating earnings guidance of $3.10-$3.30 per share. The earnings revision did not impact the company's operating earnings outlook or internal performance measurements.
DTE Energy reported 2002 earnings of $632 million or $3.83 per diluted share, up 10% from 2001 operating earnings. Earnings for the fourth quarter of 2002 were $203 million or $1.21 per diluted share, down from 2001 operating earnings of $1.43 per diluted share. The company reaffirmed its 2003 earnings guidance of $3.90 to $4.10 per share despite anticipated challenges. By business unit, DTE Energy Resources contributed earnings growth while DTE Energy Distribution saw declines due to storm costs and DTE Energy Gas saw increases.
This annual report summarizes Dollar General's performance for the fiscal year ending February 3, 2006. Some key points:
- Dollar General grew net sales by 12% to $8.6 billion and net income by 2% to $350 million, with earnings per share of $1.08.
- The company opened 734 new stores, including 29 new Dollar General Markets, bringing the total store count to 7,929.
- Initiatives like EZstore and Project Gold Standard aimed to improve store operations and strengthen the organization. Nearly half of stores implemented the EZstore model by year-end.
- Leadership was enhanced with several new executive hires and a reorganization to better
Starbucks had a very successful fiscal year 2007, with revenue reaching $9.4 billion and net earnings of $673 million. However, the company saw slowing customer traffic in U.S. stores. In response, Starbucks' CEO Howard Schultz will lead a transformation of the company to refocus on coffee quality and the customer experience. Plans include improving U.S. stores, expanding internationally, and renewing Starbucks' heritage and innovation. Schultz is confident these steps will ensure long-term success and deliver value for customers, partners, and shareholders.
The document is Starbucks' 2004 annual report which summarizes the company's performance and initiatives that fiscal year. It discusses how Starbucks renewed its focus on coffee roots by expanding coffee education and rare coffee offerings. It highlights global social responsibility efforts including improving conditions for coffee farmers. It also summarizes innovations in music offerings and new products. Starbucks achieved record growth by opening over 1,300 stores globally and increasing revenue over $1 billion to $5.3 billion, exceeding expectations.
The document is an independent auditors' report on the consolidated financial statements of JTH Tax, Inc. and subsidiaries for the years ended April 30, 2008, 2007 and 2006. It provides an unqualified opinion that the financial statements fairly represent the financial position of JTH Tax and its results of operations and cash flows in conformity with US GAAP. The auditor conducted its audits in accordance with auditing standards generally accepted in the US.
This document provides a summary of DTE Energy's business update presentation given at the AGA Financial Forum on May 5, 2008. It discusses DTE Energy's focused strategy of executing strong regulated utility growth and a value-focused non-utility plan. Specifically, it outlines DTE Energy's projected utility earnings growth rates, regulatory environment, and opportunities in areas like renewables. It also summarizes the composition and focus of DTE Energy's non-utility businesses. Finally, it provides an overview of Detroit Edison's general rate case and notes the importance of energy legislation passing in Michigan.
DTE Energy reported second quarter 2001 operating earnings of $70 million compared to $108 million in the second quarter of 2000. While earnings were impacted by Michigan's electric restructuring legislation, the company remains on track to reach its projected full year earnings of $3.50 to $3.60 per share. The acquisition of MCN Energy was completed during the quarter, and earnings are expected to benefit in the second half of the year from the addition of MCN's gas operations and projected cost synergies from the merger. Several non-regulated businesses performed well during the quarter and are also expected to contribute to meeting the company's full year earnings projection.
Norfolk Southern Corporation's 2008 Annual Report summarizes the company's strong financial performance in 2008. Some key highlights include record operating revenues and income, an improved operating ratio of 71.1%, and continued growth in net income and earnings per share. The report also discusses Norfolk Southern's focus on safety, service quality, growing its business, supporting communities, and investing in infrastructure and technology to position the company for long-term success.
The document is Starbucks Corporation's 2005 Annual Report. It summarizes Starbucks' global growth over the past year, with nearly 35 million weekly customers visiting over 10,000 stores worldwide. It discusses Starbucks' expansion into new international markets like Brazil, India, and Russia. It also highlights the company's focus on providing excellent customer service and coffee, supporting coffee farmers, and creating a positive work environment for employees. The annual report emphasizes Starbucks' goal of fostering human connection through each customer interaction.
Starbucks had another successful fiscal year, opening 2,199 new stores globally to bring their total to 12,440 stores in 37 countries, generating $7.8 billion in revenue and $564 million in net earnings. Starbucks continued to innovate with new food and beverage offerings, expanded into new international markets like Brazil and Egypt, and further developed their corporate social responsibility programs. Looking ahead, Starbucks is confident about continued global growth and has set targets to open 2,400 new international stores in fiscal 2007 and achieve 20-25% annual earnings growth over the next 3-5 years.
DTE Energy reported strong financial results for 2001. Operating earnings excluding merger and restructuring charges were $536 million compared to $484 million in 2000, an increase of 10.7%. However, including these charges, reported earnings were $332 million compared to $468 million in 2000, a decrease of 29.1%. Non-regulated energy businesses contributed $162 million in earnings, exceeding the target of $130 million. Looking ahead, DTE Energy expects its compound annual earnings growth rate to increase to between 6-8% by 2005 and provided earnings guidance of $3.70 to $4.00 per share for 2002.
DTE Energy reported third quarter earnings of $0.96 per share, up from $0.51 per share in the third quarter of 2001, excluding merger and restructuring expenses. Year-to-date earnings increased 30% to $2.62 per share. The company's regulated utility operations performed well due to higher residential sales from increased cooling demand and lower fuel costs. Non-regulated businesses such as energy services also contributed significantly to earnings growth. Despite challenges in the industry, DTE Energy reaffirmed its 2002 earnings guidance of $3.75-$3.95 per share and 2003 guidance of $3.90-$4.10 per share, expecting continued cost controls to offset cost pressures.
DTE Energy reported first quarter earnings of $138 million compared to $117 million in the first quarter of 2000. Revenue from non-regulated businesses increased 251% to $817 million, contributing to increased earnings. The results were positively impacted by the suspension of the fuel clause and the company expects to complete its merger with MCN Energy in June, which is an important part of DTE Energy's growth strategy.
DTE Energy reported 2000 earnings of $468 million, or $3.27 per share, compared to $483 million, or $3.33 per share in 1999. Earnings were impacted by one-time charges including a residential rate reduction and merger costs. Excluding these charges, earnings rose 6.3% to $3.54 per share. Non-regulated businesses contributed $84 million in earnings, a 22% increase driven by increased production and new projects. DTE Energy expects continued growth from its non-regulated portfolio.
DTE Energy reported third quarter operating earnings of $84 million compared to $105 million in the third quarter of 2000. Reported earnings were $63 million including merger and restructuring charges. Despite a tough economy, DTE Energy achieved its third quarter earnings target and remains committed to its full year target of $3.50 per share. Lower industrial sales and legislatively mandated rate reductions impacted revenues, while cost reduction programs helped earnings. DTE Energy expects its non-regulated businesses to drive future growth.
DTE Energy reported third quarter operating earnings of $84 million compared to $105 million in the third quarter of 2000. While industrial sales declined due to the economic downturn, residential sales increased. The company remains committed to reaching its 2001 operating earnings goal of $3.50 per share. For 2002, guidance was adjusted slightly to $4 per share operating earnings due to continued economic uncertainty. Non-regulated businesses will continue to be the company's growth platform.
DTE Energy reported second quarter 2001 operating earnings of $70 million compared to $108 million in the second quarter of 2000. While earnings were impacted by Michigan's electric restructuring legislation, the company remains on track to reach its projected full year earnings of $3.50 to $3.60 per share. The acquisition of MCN Energy was completed during the quarter, and earnings are expected to benefit in the second half of the year from the addition of MCN's gas operations and projected cost synergies from the merger. Several non-regulated businesses performed well during the quarter and are also expected to contribute to meeting the company's full year earnings projection.
- DTE Energy Company and Subsidiary Companies provided a condensed consolidated statement of income and balance sheet for the third quarter of 2000 compared to the third quarter of 1999.
- Key highlights include operating revenues increased 7.4% to $1.547 billion driven by higher fuel and purchased power costs, while operating income decreased 38.8% to $172 million.
- Net income including one-time items decreased 35.2% to $104 million, while earnings per share decreased 38.8% to $0.73 per share compared to the prior year.
DTE Energy reported strong financial results for the first quarter of 2002, with net income of $200 million, a 44% increase over the previous year. Earnings per share increased 27% to $1.24. The company benefited from contributions from its non-regulated businesses and its gas distribution utility, which was acquired in 2001. However, mild winter weather reduced gas sales. The company reaffirmed its 2002 earnings target range of $3.70 to $4.00 per share despite challenges from the economy, weather, and electric customer choice programs.
DTE Energy Company reported financial results for the second quarter of 2000. Operating revenues increased 24.2% to $1.428 billion due to higher fuel and purchased power costs. Net income was $108 million, down slightly from $110 million in the previous year. Earnings per share were $0.76, unchanged from the prior year when excluding one-time items. For the six months ended June 30, 2000, operating revenues increased 20.1% to $2.610 billion while net income was $224 million, relatively unchanged from the previous year.
DTE Energy Company reported financial results for the second quarter of 2000. Operating revenues increased 24.2% to $1.428 billion due to higher fuel and purchased power costs. Net income was $108 million, down slightly from $110 million in the previous year. Earnings per share were $0.76, unchanged from the prior year when excluding one-time items. For the six months ended June 30, 2000, operating revenues increased 20.1% to $2.610 billion, while net income was $224 million, relatively unchanged from the previous year.
DTE Energy reported financial results for the fourth quarter and full year 1999. For the quarter, operating revenues increased 10.1% to $1.1 billion but net income decreased 9.3% to $97 million due to higher fuel and operating costs. For the full year, operating revenues rose 12.0% to $4.7 billion and net income increased 9.0% to $483 million. Cash from operations was $1.1 billion for the year.
Bank of America reported third quarter 2005 results with the following key points:
1) Diluted EPS was up 12% year-over-year but down 4% quarter-over-quarter due to higher credit costs and lower securities gains.
2) Revenue grew 16% year-over-year and 4% quarter-over-quarter driven by strong growth across all business segments.
3) Credit costs increased from very low levels in previous quarters as charge-offs moved off recent lows.
This document summarizes Northrop Grumman's Q3 2008 financial results. It highlights increases in sales, earnings per share, cash from operations, and new business awards compared to Q3 2007. The CEO also notes share repurchases, a record backlog, opportunities for growth, and raised guidance for full year EPS. Updates are provided on major defense programs and milestones. The CFO discusses the company's liquidity, risk mitigation efforts, and negotiating better contracts. Projections for full year 2008 sales, margins, cash flow, and earnings are included. Potential impacts of market declines on 2009 pension expenses are also estimated.
- Bank of America reported second quarter 2006 results, with net income of $5.58 billion excluding merger charges, up 4% from the second quarter of 2005.
- The Global Consumer & Small Business Bank saw strong growth, with net income up 42% to $3.11 billion driven by increases in cards and deposits.
- The Global Corporate & Investment Bank reported net income of $1.72 billion, flat compared to the second quarter of 2005.
Viacom reported financial results for the first quarter of 2008 that showed increases in revenue, operating income, and earnings per share compared to the first quarter of 2007. Revenue grew 15% to $3.117 billion. Operating income increased 29% to $567 million. Diluted earnings per share from continuing operations rose 45% to $0.42. Media Networks and Filmed Entertainment, Viacom's two business segments, both saw revenue growth for the quarter despite lower theatrical revenues at Filmed Entertainment. Viacom also provided guidance for 2008-2010 of low double-digit annual growth in diluted earnings per share from continuing operations.
DTE Energy reported financial results for the third quarter of 1999. Operating revenues increased 20.1% to $1.44 billion due to higher net system sales and a performance reserve from Fermi 2. However, operating expenses also increased 24.3% to $1.16 billion primarily because of higher fuel and purchased power costs. As a result, operating income rose modestly to $281 million. Net income increased 21.8% to $161 million compared to $132 million in 1998, contributing to a rise in earnings per share to $1.11 from $0.91 in the previous year. The financial results reflected growth in both the company's regulated and non-regulated operations.
This document summarizes Viacom's financial results for the third quarter of 2008. Revenues increased 4% year-over-year to $3.4 billion. Operating income decreased 15% to $689 million due to an 11% increase in expenses. Adjusted net earnings decreased 22% to $339 million, while adjusted diluted EPS decreased 15% to $0.55. Free cash flow was $564 million for the quarter compared to a significant decrease year-to-date. Total debt was $8.95 billion as of September 30, 2008, while cash on hand was $525 million.
Pepco Holdings, Inc. held an analyst conference on October 5-6, 2004 to discuss the company's performance. The presentation included an overview of PHI's businesses, strategy, and corporate governance practices. It noted PHI has $7.1 billion in revenues and focuses on its regulated electric and gas delivery business, which accounts for 72% of operating income. The Power Delivery segment was discussed, which includes the transmission and distribution of electricity to 1.8 million customers across several mid-Atlantic states.
The document discusses Joseph Rigby's presentation on the strategic positioning of Southeast Utilities. It summarizes the company's strategic focus on power delivery, Conectiv Energy, and Pepco Energy Services. It also outlines the goals for the power delivery business, including sales growth, infrastructure investment, operational excellence, and constructive regulatory outcomes to deliver average annual earnings growth of at least 4%. Key infrastructure projects are highlighted.
The document summarizes a presentation given by Joseph M. Rigby, CFO of Pepco Holdings, Inc. (PHI) at an investor conference on March 28, 2006. The presentation outlines PHI's strategy to remain a regional diversified energy delivery and competitive services company focused on operational excellence. It discusses PHI's power delivery business, Conectiv Energy, and Pepco Energy Services. The presentation also provides financial performance summaries and projections showing PHI's ability to cover dividends and capital expenditures with cash from operations.
The document provides an overview and summary of PHI's strategy and performance across its various business segments. PHI aims to remain a regional diversified energy delivery and competitive services company focused on value creation and operational excellence. Key aspects include achieving constructive regulatory outcomes and 4% annual earnings growth for its power delivery utilities, optimizing assets and market opportunities for Conectiv Energy, and expanding Pepco Energy Services into additional markets. Financial performance has been positively impacted by infrastructure investments and sales growth, though earnings have been reduced in some jurisdictions due to higher standard offer service pricing.
This document provides an overview of PHI and its strategy for positioning itself for success in a dynamic industry. PHI's strategy is to remain a diversified regional energy delivery and competitive services company focused on value creation and operational excellence. For its power delivery utility operations, PHI's goals are to operate with excellence, achieve constructive regulatory outcomes, invest in infrastructure, and deliver at least 4% annual average earnings growth. PHI's service territory has a robust economy that is less susceptible to downturns and includes diverse government and private sectors.
This document provides an overview of PHI's 41st EEI Financial Conference held from November 5-8, 2006. It includes sections on PHI's financial performance for Q3 and year-to-date 2006, drivers of performance, sales and customer trends, regulated distribution summaries, upcoming regulatory activities including transmission formula rate filings and rate cases, and PHI's proposed MAPP transmission project. Key highlights are lower sales due to mild weather, lower transmission revenue, and plans to file rate cases in late 2006/early 2007.
This document provides an overview and summary of Power Holdings Inc.'s (PHI) various business segments. It discusses PHI's regulated electric and gas delivery business, which accounts for 67% of operating income. It also summarizes Conectiv Energy's competitive merchant generation and load service business, which accounts for 33% of operating income. Key highlights from rate cases and recent regulatory activities involving PHI's delivery businesses are also provided. The document contains forward-looking statements and non-GAAP financial measures.
The document provides an overview of Pepco Holdings Inc.'s (PHI) power delivery business and regulatory environment. It summarizes PHI's sales and customer growth projections, infrastructure investment strategy including the proposed Mid-Atlantic Power Pathway transmission project and Blueprint for the Future initiative. Recent distribution rate case outcomes for PHI's utilities are also summarized. The document is intended as a presentation for investors on PHI's positioned for success through its regulated electric and gas delivery business.
The document provides an overview of Pepco Holdings Inc.'s (PHI) various businesses including its regulated electric and gas delivery business, competitive energy generation business, and energy services business. It discusses PHI's infrastructure investment strategies, the status of major projects like the Mid-Atlantic Power Pathway, and the company's regulatory environment. Financial projections show expectations for continued investment and growth across PHI's businesses.
The document discusses Pepco Holdings' strategic focus on infrastructure investments and customer programs to position the company for continued success. It outlines plans to invest $1.2 billion in the Mid-Atlantic Power Pathway transmission project through 2014 and $646 million in advanced metering infrastructure and other programs through the company's Blueprint for the Future initiative between 2008-2014. Regulatory support is essential for cost recovery for these investments, which aim to enhance reliability, manage costs and protect the environment for customers.
This document provides an overview of Pepco Holdings' transmission and distribution business. It discusses plans to invest over $5 billion from 2007-2012 to upgrade aging infrastructure and improve reliability. A key project is the $1.05 billion Mid-Atlantic Power Pathway, a 230-mile 500kV transmission line from Northern Virginia to Southern New Jersey to be completed by 2013. The presentation outlines the project timeline, environmental stewardship efforts, and cost recovery approach through PJM and FERC. It also reviews the company's focus on replacing aging transmission equipment to further enhance reliability.
The document provides an overview of Pepco Holdings, Inc.'s (PHI) strategy to build shareholder value. PHI aims to increase investment in infrastructure through its Blueprint programs to modernize its electric grid. It also plans growth for its competitive energy businesses, Conectiv Energy and Pepco Energy Services. PHI expects its regulated Power Delivery business to remain the primary driver of earnings, contributing 60-70% of operating income over the planning period through infrastructure investments and favorable regulatory outcomes.
This document provides an overview of Pepco Holdings, Inc.'s power delivery business. It discusses planned infrastructure investments totaling $4.99 billion from 2008-2012 to improve reliability, support load growth, and implement new technology. A key project is the $1.05 billion Mid-Atlantic Power Pathway transmission line. The document also reviews regulatory highlights, including recent rate cases, and outlines operational and financial summaries for the company's distribution and transmission businesses.
- Pepco Holdings held its annual meeting and provided its annual report to shareholders.
- In 2002, Pepco Holdings earned $210.5 million in consolidated earnings, or $1.61 per share. Earnings were driven by strong performance from regulated utility businesses and some competitive energy businesses.
- The letter discusses the company's strategy, leadership, and financial and operational performance across its various business segments in 2002. It also encourages shareholders to vote and continue supporting the company.
- Pepco Holdings provided its first annual report after merging Pepco and Conectiv in August 2002.
- In 2002, PHI earned $210.5 million, or $1.61 per share, on $4.3 billion in revenue. Excluding merger costs, earnings were $1.74 per share.
- The letter discusses the company's regulated utility and competitive energy businesses, noting stable earnings from utilities and growth potential from competitive businesses. It encourages shareholders to vote and thanks them for their confidence and investment.
This document provides a summary of Pepco Holdings' 2004 annual report and proxy statement. Key points include:
1) Pepco Holdings reported improved financial performance in 2004 with consolidated earnings of $258.7 million, up from $113.5 million in 2003, driven by improved performance of competitive energy businesses.
2) The company made progress on reducing debt and preferred stock by $480 million in 2004 and achieved a total shareholder return of over 22% for 2003-2004.
3) The regulated power delivery business continues as the primary focus and driver of steady cash flow. Earnings from this segment improved to $233.4 million in 2004.
4) Competitive energy businesses also posted
The document provides details on Pepco Holdings' 2003 performance and future plans. It discusses challenges faced in 2003 including an energy trading loss, Mirant's bankruptcy, and Hurricane Isabel. However, actions taken in 2003 such as divesting non-core businesses and reducing risk are expected to set the stage for future earnings growth. The company remains focused on strengthening its core power delivery business and improving customer satisfaction.
This document provides a summary of Pepco Holdings' 2004 annual report and proxy statement. Key points include:
1) Pepco Holdings reported improved financial performance in 2004 with consolidated earnings of $258.7 million, up from $113.5 million in 2003, driven by improved performance of competitive energy businesses.
2) The company made progress on reducing debt and preferred stock by $480 million in 2004 as part of its balance sheet improvement goals.
3) The regulated power delivery business continues as the primary focus due to its stability and cash generation. Earnings from this segment grew to $233.4 million in 2004.
4) Competitive energy businesses also posted profits in 2004 despite challenging markets
The document is the 2005 annual report and proxy statement from PHI (Pepco Holdings Inc.). It discusses PHI's strategy of focusing on stable power delivery and growing energy businesses. In 2005, PHI achieved earnings of $371.2 million and strengthened its balance sheet by paying down over $1 billion in debt. Rising energy prices present challenges for PHI and its customers. The proxy statement announces the annual meeting to elect directors and ratify the independent auditor.
^%$Zone1:+971)581248768’][* Legit & Safe #Abortion #Pills #For #Sale In #Duba...mayaclinic18
Whatsapp (+971581248768) Buy Abortion Pills In Dubai/ Qatar/Kuwait/Doha/Abu Dhabi/Alain/RAK City/Satwa/Al Ain/Abortion Pills For Sale In Qatar, Doha. Abu az Zuluf. Abu Thaylah. Ad Dawhah al Jadidah. Al Arish, Al Bida ash Sharqiyah, Al Ghanim, Al Ghuwariyah, Qatari, Abu Dhabi, Dubai.. WHATSAPP +971)581248768 Abortion Pills / Cytotec Tablets Available in Dubai, Sharjah, Abudhabi, Ajman, Alain, Fujeira, Ras Al Khaima, Umm Al Quwain., UAE, buy cytotec in Dubai– Where I can buy abortion pills in Dubai,+971582071918where I can buy abortion pills in Abudhabi +971)581248768 , where I can buy abortion pills in Sharjah,+97158207191 8where I can buy abortion pills in Ajman, +971)581248768 where I can buy abortion pills in Umm al Quwain +971)581248768 , where I can buy abortion pills in Fujairah +971)581248768 , where I can buy abortion pills in Ras al Khaimah +971)581248768 , where I can buy abortion pills in Alain+971)581248768 , where I can buy abortion pills in UAE +971)581248768 we are providing cytotec 200mg abortion pill in dubai, uae.Medication abortion offers an alternative to Surgical Abortion for women in the early weeks of pregnancy. Zone1:+971)581248768’][* Legit & Safe #Abortion #Pills #For #Sale In #Dubai Abu Dhabi Sharjah Deira Ajman Fujairah Ras Al Khaimah%^^%$Zone1:+971)581248768’][* Legit & Safe #Abortion #Pills #For #Sale In #Dubai Abu Dhabi Sharjah Deira Ajman Fujairah Ras Al Khaimah%^^%$Zone1:+971)581248768’][* Legit & Safe #Abortion #Pills #For #Sale In #Dubai Abu Dhabi Sharjah Deira Ajman Fujairah Ras Al Khaimah%^^%$Zone1:+971)581248768’][* Legit & Safe #Abortion #Pills #For #Sale In #Dubai Abu Dhabi Sharjah Deira Ajman Fujairah Ras Al Khaimah%^^%$Zone1:+971)581248768’][* Legit & Safe #Abortion #Pills #For #Sale In #Dubai Abu Dhabi Sharjah Deira Ajman Fujairah Ras Al Khaimah%^^%$Zone1:+971)581248768’][* Legit & Safe #Abortion #Pills #For #Sale In #Dubai Abu Dhabi Sharjah Deira Ajman Fujairah Ras Al Khaimah%^^%$Zone1:+971)581248768’][* Legit & Safe #Abortion #Pills #For #Sale In #Dubai Abu Dhabi Sharjah Deira Ajman Fujairah Ras Al Khaimah%^^%$Zone1:+971)581248768’][* Legit & Safe #Abortion #Pills #For #Sale In #Dubai Abu Dhabi Sharjah Deira Ajman Fujairah Ras Al Khaimah%^^%$Zone1:+971)581248768’][* Legit & Safe #Abortion #Pills #For #Sale In #Dubai Abu Dhabi Sharjah Deira Ajman Fujairah Ras Al Khaimah%^^%$Zone1:+971)581248768’][* Legit & Safe #Abortion #Pills #For #Sale In #Dubai Abu Dhabi Sharjah Deira Ajman Fujairah Ras Al Khaimah%^^%$Zone1:+971)581248768’][* Legit & Safe #Abortion #Pills #For #Sale In #Dubai Abu Dhabi Sharjah Deira Ajman Fujairah Ras Al Khaimah%^^%$Zone1:+971)581248768’][* Legit & Safe #Abortion #Pills #For #Sale In #Dubai Abu Dhabi Sharjah Deira Ajman Fujairah Ras Al Khaimah%^^%$Zone1:+971)581248768’][* Legit & Safe #Abortion #Pills #For #Sale In #Dubai Abu Dhabi Sharjah Deira Ajman Fujairah Ras Al Khaimah%^^%$Zone1:+971)581248768’][* Legit & Safe #Abortion #Pills #For #Sale In #Dubai Abu Dhabi Sharjah Deira Ajman
Understanding how timely GST payments influence a lender's decision to approve loans, this topic explores the correlation between GST compliance and creditworthiness. It highlights how consistent GST payments can enhance a business's financial credibility, potentially leading to higher chances of loan approval.
Abhay Bhutada, the Managing Director of Poonawalla Fincorp Limited, is an accomplished leader with over 15 years of experience in commercial and retail lending. A Qualified Chartered Accountant, he has been pivotal in leveraging technology to enhance financial services. Starting his career at Bank of India, he later founded TAB Capital Limited and co-founded Poonawalla Finance Private Limited, emphasizing digital lending. Under his leadership, Poonawalla Fincorp achieved a 'AAA' credit rating, integrating acquisitions and emphasizing corporate governance. Actively involved in industry forums and CSR initiatives, Abhay has been recognized with awards like "Young Entrepreneur of India 2017" and "40 under 40 Most Influential Leader for 2020-21." Personally, he values mindfulness, enjoys gardening, yoga, and sees every day as an opportunity for growth and improvement.
Economic Risk Factor Update: June 2024 [SlideShare]Commonwealth
May’s reports showed signs of continued economic growth, said Sam Millette, director, fixed income, in his latest Economic Risk Factor Update.
For more market updates, subscribe to The Independent Market Observer at https://blog.commonwealth.com/independent-market-observer.
OJP data from firms like Vicinity Jobs have emerged as a complement to traditional sources of labour demand data, such as the Job Vacancy and Wages Survey (JVWS). Ibrahim Abuallail, PhD Candidate, University of Ottawa, presented research relating to bias in OJPs and a proposed approach to effectively adjust OJP data to complement existing official data (such as from the JVWS) and improve the measurement of labour demand.
Falcon stands out as a top-tier P2P Invoice Discounting platform in India, bridging esteemed blue-chip companies and eager investors. Our goal is to transform the investment landscape in India by establishing a comprehensive destination for borrowers and investors with diverse profiles and needs, all while minimizing risk. What sets Falcon apart is the elimination of intermediaries such as commercial banks and depository institutions, allowing investors to enjoy higher yields.
2. Elemental Economics - Mineral demand.pdfNeal Brewster
After this second you should be able to: Explain the main determinants of demand for any mineral product, and their relative importance; recognise and explain how demand for any product is likely to change with economic activity; recognise and explain the roles of technology and relative prices in influencing demand; be able to explain the differences between the rates of growth of demand for different products.
1. July 30, 2002
DTE ENERGY REPORTS SECOND QUARTER EARNINGS OF $0.42 PER SHARE;
TIGHTENS 2002 EARNINGS TARGET TO $3.75 - $3.95, INITIATES 2003 GUIDANCE
OF $3.90 - $4.10
DETROIT – DTE Energy Company (NYSE: DTE) today announced 2002 second quarter
earnings of $68 million, or $0.42 per diluted share, down from $81 million, or $0.55 per diluted
share (excluding merger and restructuring expenses and goodwill amortization) in the second
quarter of 2001. Reported earnings for the second quarter of 2001 were an $87 million loss, or a
loss of $0.60 per basic and diluted share, including the impact of merger and restructuring
charges and goodwill amortization. During the second quarter of 2001, the company recorded
$164 million in after-tax merger and restructuring charges related to the MCN merger.
Year-to-date earnings per share increased 8 percent to $1.66 from $1.53 in 2001 (excluding
merger and restructuring expenses and goodwill amortization). Net income for the six-month
period increased 22 percent to $268 million, from $220 million in 2001.
“Our solid results this quarter demonstrate the strength of our diverse and integrated business
portfolio,” said Anthony F. Earley Jr., DTE Energy chairman and chief executive officer.
“Contributions from our non-regulated businesses, as well as sound performance at our electric
utility, allowed us to achieve second quarter results that position us well for the balance of the
year. The uncertain impact of weather and the pace of economic recovery will continue to affect
our business, but I am confident that we can achieve our 2002 earnings goals. Our expected
earnings range for the full year is narrowed to $3.75 - $3.95 per diluted share, from our
previously issued guidance of $3.70 - $4.00 per diluted share. In addition, we are providing our
initial expectations of earnings for 2003 of $3.90 - $4.10 per diluted share, which anticipates
continued solid growth in a difficult industry environment.”
Compared with the second quarter of 2001, several factors impacted earnings:
• Increased earnings from the electric utility business, primarily driven by an increase in
residential sales due to warm June weather, as well as lower fuel and purchased power costs.
• Non-regulated earnings were down year-over-year driven by the absence of mark-to-market
gains in the second quarter of 2002 as compared to the prior year. This gain was related to
gas supply contracts that have largely been hedged to reduce future earnings volatility.
• Several non-regulated businesses provided increased earnings contributions. This was led by
the coal-based fuels business that had higher synfuel production, and the non-regulated
natural gas business, which was acquired as part of the MCN merger.
• Quarterly timing of the company’s tax credit normalization adjustments had a negative
impact on earnings of approximately 8 cents versus last year. DTE Energy earns tax credits
consistently throughout the year as a result of its synthetic fuels business, but accounting
2. rules mandate tax adjustments to retime tax credit recognition to reflect the distribution of
pre-tax income. This generally results in negative tax adjustments for the second and third
quarters and positive tax adjustments in the first and fourth quarters and does not impact total
year earnings.
• Common stock shares issued as a result of DTE Energy’s merger with MCN Energy and
shares repurchased with the proceeds from the securitization bond issuance resulted in an
increase in the average number of common shares of stock outstanding from 145 million to
162 million.
David E. Meador, DTE Energy senior vice president and chief financial officer added:
“During this turbulent period for our industry, DTE Energy’s diversity of earnings around our
core competencies continues to be a strength for our company. We are focused on delivering
consistent and solid earnings growth to our shareholders. Our recent equity issuance strengthens
an already solid balance sheet and credit rating, and places us in an enhanced position to execute
our growth strategy. We remain committed to achieving 6% earnings growth, and we believe that
this goal, coupled with our 5.5% dividend yield, provides an attractive and low risk return to our
shareholders.”
On July 31, DTE Energy will be conducting a meeting with the financial community to
discuss second quarter earnings and to provide a general business update. The live webcast of
this meeting begins at 9:00 am EST, and the accompanying presentation materials will be
available at www.DTEEnergy.com .
DTE Energy is a Detroit-based diversified energy company involved in the development and management of
energy-related businesses and services nationwide. DTE Energy's largest operating subsidiaries are Detroit Edison, an
electric utility serving 2.1 million customers in Southeastern Michigan, and MichCon, a natural gas utility serving 1.2
million customers in Michigan. Information about DTE Energy is available at http://www.dteenergy.com.
The information contained in this document is as of the date of this press release. DTE Energy expressly
disclaims any current intention to update any forward-looking statements contained in this document as a result of new
information or future events or developments. Words such as quot;anticipatequot; and quot;projectedquot; signify forward-looking
statements. Forward-looking statements are not guarantees of future results and conditions but rather are subject to
various risks and uncertainties. This press release contains forward-looking statements about DTE Energy’s financial
results and estimates of future prospects that involve risks and uncertainties that may cause actual results to differ
materially. Factors that may impact forward-looking statements include, but are not limited to, access to the capital
markets, the level of borrowings, weather, actual sales, changes in the cost of fuel and purchased power due to the
suspension of the Power Supply Cost Recovery mechanism, changes in the cost of natural gas, the effects of
competition and the implementation of electric and gas Customer Choice programs, the impact of changes in and
interpretations of tax laws, the timing of the accretive effects of DTE Energy’s merger with MCN Energy, and the
contributions to earnings by non-regulated businesses. This press release should also be read in conjunction with the
forward-looking statements in DTE Energy’s, MichCon’s and Detroit Edison’s 2001 Form 10-K Item 1, and in
conjunction with other SEC reports filed by DTE Energy, MichCon and Detroit Edison.
Analysts – For Further Information:
Investor Relations (313) 235-8030
3. DTE ENERGY COMPANY AND SUBSIDIARY COMPANIES
CONDENSED CONSOLIDATED STATEMENT OF INCOME (PRELIMINARY/UNAUDITED)
(Dollars in Millions, Expect Per Share Amounts)
3 Months - June 6 Months - June
2001* 2001*
2002 % Change 2002 % Change
Operating Revenues $1,981 $1,790 11% $4,381 $3,632 21%
Operating Expenses
Fuel, gas & purchased power $907 $908 - $2,130 $1,856 15%
Operation and maintenance 603 453 33% 1,141 836 36%
Depreciation and amortization 186 188 -1% 380 372 2%
Taxes other than income 86 77 12% 184 158 16%
Merger and restructuring charges - 252 n/m - 254 n/m
Total Operating Expenses $1,782 $1,878 -5% $3,835 $3,476 10%
Operating Income $199 ($88) 326% $546 $156 250%
Interest Expense and Other
Interest Expense $137 $104 32% $274 $195 41%
Pref. Stock Dividend of Subsidiary 6 2 200% 13 2 550%
Other (Income)/Expense - net (8) (5) 60% (6) (6) 0%
Total Interest Expense and Other $135 $101 34% $281 $191 47%
Income Before Income Taxes $64 ($189) 134% $265 ($35) 857%
Income Taxes (4) (102) 96% (3) (83) 96%
Cumulative Effect of Accounting Change, net of tax
- - n/m - 3 n/m
Net Income - Including Merger Related Items $68 ($87) 178% $268 $51 425%
Earnings per Diluted Share Including Merger Related
Items $0.42 ($0.60) 170% $1.66 $0.36 361%
Merger Related Items
Merger and Restructuring Charges - net of tax - 1.12 n/m - 1.14 n/m
Goodwill - 0.03 n/m - 0.03 n/m
Earnings per Share Excluding Merger Related Items $0.42 $0.55 -24% $1.66 $1.53 8%
Average Common Shares Outstanding (Diluted) 162 145 12% 162 144 13%
* 2001 data includes only one month (June) of contribution from The Condensed Consolidated Statement of Income (Unaudited) should be read in
the former MCN entities conjunction with the Notes to Consolidated Financial Statements appearing in the
Annual Report to Shareholders, 10K, and 10Q.
n/m - not meaningful
DTE Income Statement p.3
4. Earnings per Share Summary
Q2 2002
(Preliminary/Unaudited)
$0.42
Earnings per Share
Energy Corporate ($0.24)
$0.50 $0.12 $0.04
Energy Energy
Distribution & Other
Resources Gas
Gas
Regulated Power Power
$0.35 ($0.01)
$0.11
Distribution
Distribution
Generation
Transmission $0.03
Energy DTE Energy Non Reg Holding
$0.15 ($0.02) $0.05 ($0.08)
Energy Gas
Services Technologies Company
Non Coal Energy Tech
$0.02 ($0.01)
Services Investments*
Regulated Biomass Tax
$0.01 ($0.15)
Energy Normalization
Energy Trading($0.03)
* Includes $0.02 of Plug Power losses
& CoEnergy
EPS Summary p.4
5. DTE ENERGY COMPANY AND SUBSIDIARY COMPANIES
Earnings Variance Analysis (Preliminary/Unaudited)
2nd Quarter
Per Share Impact
DTE Energy Q2 2001 EPS (excluding merger restructuring and goodwill related costs) $0.55
Energy Resources
5% rate reduction ($0.02)
Electric gross margin - higher sales and lower power supply costs 0.19
FAS 133 adj. of summer supply contracts - designated normal purchases in July 2001 0.16
Other (0.02)
Non Regulated
Energy Services - increased synfuel production 0.03
DTE Generation - decreased output, soft market conditions (0.05)
Energy Trading - mark-to-market gains on new business in 2002 0.03
Co-Energy Portfolio - mark-to-market gains in 2001 on long term gas supply contracts (0.23)
Energy Resources Variance $0.09
Energy Distribution
Distribution margins - higher territory sales +4% $0.11
O&M Expense and other - heat-related and other distribution system distribution costs (0.12)
Non Regulated - Energy Technologies (0.01)
Energy Distribution Variance ($0.02)
Energy Gas
Regulated Gas - only one month included in 2001 results ($0.01)
Non Regulated Gas - only one month included in 2001 results 0.05
Energy Gas Variance $0.04
Holding Company & Other - Primarily effective tax rate adjustment, higher interest expense (0.19)
(0.07)
EPS Share Dilution from MCN Merger shares issued
0.02
EPS Accretion from Share Repurchase from Securitization Proceeds
DTE Energy Q2 2002 EPS $0.42
EPS Variance p.5
6. Net Income Summary
(Preliminary/Unaudited)
Regulated Performance
(Net Income $M)
Q2 2002 Q2 2001** Change
Energy Resources $57.2 $11.7 $45.5
23.1 25.8 (2.7)
Energy Distribution
(including Transmission)
(0.9) 0.8 (1.7)
Energy Gas
Total Regulated $79.4 $38.3 $41.1
Non Regulated Performance
(Net Income $M)
Q2 2002 Q2 2001** Change
Energy Resources
Energy Services
Coal Based Fuels 33.9 25.4 $8.5
On Site Energy Projects 2.3 2.4 ($0.1)
Merchant Generation (1.4) 6.3 ($7.7)
Other (10.0) (7.9) ($2.1)
Coal Services 2.7 5.3 (2.6)
Biomass Energy 1.4 1.0 0.4
Energy Trading & Large mark-to-
CoEnergy Portfolio (5.4) 24.2 (29.6) market gain in
Q2 2001
Subtotal 23.5 56.7 (33.2)
Energy Gas 7.7 1.0 6.7
Energy Distribution
Energy Technologies (3.8) (2.7) (1.1)
Other
Plug Power (2.4) (3.5) 1.1
Other (0.7) (0.2) (0.5)
Total Non Regulated* $24.3 $51.3 ($27.0)
* Excludes holding company items
** Excludes merger related items
Net Income Summary p.6
7. DTE ENERGY COMPANY
CONDENSED CONSOLIDATED BALANCE SHEET (PRELIMINARY/UNAUDITED)
(Dollars in Millions)
Jun. 30 Dec. 31 Percent LIABILITIES AND Jun. 30 Dec. 31 Percent
ASSETS 2002 2001 Change SHAREHOLDERS' EQUITY 2002 2001 Change
Current Assets Current Liabilities
Cash and Cash Equivalents $82 $268 -69% Accounts Payable $689 $697 -1%
Restricted Cash 152 157 -3% Accrued Interest 127 118 8%
Accounts Receivable 1,491 1,352 10% Dividends Payable 89 84 6%
Accrued gas cost recovery 53 14 279% Accrued Payroll 104 108 -4%
Inventories (at average cost) Short-term Borrowings 515 681 -24%
Fuel and Gas 374 343 9% Income Taxes 15 54 -72%
Materials and Supplies 161 162 -1% Current Portion Long-term Debt 628 516 22%
Asset from Risk Mgmt & Trading Activities 503 400 26% Liab. From Risk Mgmt & Trading 559 425 32%
Deferred Income Taxes - 47 n/m Other 376 495 -24%
Other 117 83 41% $3,102 $3,178 -2%
$2,933 $2,826 4% Other Liabilities
Deferred Income Taxes $1,420 $1,478 -4%
Regulatory Liabilities 180 187 -4%
Investments Unamortized investment tax credit 175 180 -3%
Nuclear Decommissioning Trust Funds $413 $417 -1% Liab. From Risk Mgmt & Trading 549 313 75%
Other 493 615 -20% Nuclear decommissioning 413 417 -1%
$906 $1,032 -12% Other 901 958 -6%
$3,638 $3,533 3%
Property Long-Term Debt
Property, Plant and Equipment $18,029 $17,067 6% Mortgage Bonds, Notes & Other $5,707 $5,892 -3%
Less: Acc. Depreciation & Amortization 8,366 7,524 11% Securitization Bonds $1,625 $1,673 -3%
$9,663 $9,543 1% Equity Linked Debt $194 - n/m
Capital lease obligations $87 $89 -2%
$7,613 $7,654 -1%
Other Assets
Preferred securities of subsidiaries
Goodwill $2,084 $2,003 4% $271 $274 -1%
Regulatory Assets 1,183 1,204 -2%
Securitized Regulatory Assets 1,656 1,692 -2% Shareholders' Equity
Assets from risk management & trading 342 149 130% $3,050 $2,811 9%
Common Stock
Prepaid pension assets 438 473 -7% Retained Earnings 1,941 1,846 5%
Other 299 306 -2% Accumulated other comprehensive loss (111) (68) 63%
$6,002 $5,827 3% $4,880 $4,589 6%
Total Liabilities and Shareholders' Equity
Total Assets $19,504 $19,228 1% $19,504 $19,228 1%
The Condensed Consolidated Balance Sheet (Unaudited) should be read in conjunction with the
Notes to Consolidated Financial Statements appearing in the Annual Report to Shareholders, Form 10K, and 10Q.
n/m - not meaningful
DTE Balance Sheet p.7
8. Detroit Edison
Statement of Income (Preliminary/Unaudited)
(Dollars in Millions)
3 Months - June 6 Months - June
2001 2000
2002 % Change 2001 % Change
$962 $992 -3% $1,891 $2,016 -6%
Operating Revenues
Operating Expenses
$239 $354 -32% $440 $623 -29%
Fuel and Purchased power
328 290 13% 612 546 12%
Operation and Maintenance
138 160 -14% 285 334 -15%
Depreciation and amortization
65 72 -10% 136 151 -10%
Taxes other than income
- 163 n/m - 163 n/m
Merger and Restructuring Charges
$770 $1,039 -26% $1,473 $1,817 -19%
Total Operating Expenses
$192 ($47) 509% $418 $199 110%
Operating Income
Interest Expense and Other
$78 $78 0% $156 $150 4%
Interest Expense
1 - n/m 11 5 120%
Other - net
$79 $78 1% $167 $155 8%
Total Interest Expense and Other
$113 ($125) 190% $251 $44 470%
Income Before Income Taxes
$39 ($48) 181% $84 $5 1580%
Income Taxes
Income (Loss) Before Cumulative Effect of a Change
in Accounting Principle $74 ($77) 196% $167 $39 328%
Cumulative Effect of a Change in Accounting
Principle, Net of Tax - - n/m - (3) n/m
$74 ($77) 196% $167 $36 364%
Net Income (Loss) including merger related items
Merger Related Charges - 106 n/m - $106 n/m
Net Income excluding merger related items $74 $29 155% $167 $142 18%
The Condensed Consolidated Statement of Income (Unaudited) should be read in
conjunction with the Notes to Consolidated Financial Statements appearing in the
Annual Report to Shareholders, Form 10K, and Form 10Q.
n/m - not meaningful
Reg Electric Inc. Statement p.8
9. MichCon
Statement of Income (Preliminary/Unaudited)
(Dollars in Millions, Except Per Share Amounts)
3 Months - June 30 6 Months - June 30
2002 2001* % Change 2002 2001* % Change
Operating Revenues $235 $182 29% $825 $658 25%
Operating Expenses
Cost of Gas $116 $145 -20% $501 $353 42%
Operation and Maintenance 88 66 33% 154 130 18%
Depreciation and Amortization 27 27 0% 53 53 0%
Taxes other than income 11 10 10% 27 27 0%
- -
Merger and Restructuring Charges 101 n/m 102 n/m
- -
Property write-down 33 n/m 33 n/m
Total Operating Expenses $275 $349 -21% $768 $665 15%
Operating Income ($40) ($167) 76% $57 ($7) 914%
Interest Expense and Other
Interest Income $2 $2 0% $6 $5 20%
Interest on long-term debt (12) (11) 9% (26) (21) 24%
Other interest expense (4) (2) 100% (6) (6) 0%
- -
Loss on joint venture held for sale (7) n/m (7) n/m
Equity in earnings of joint ventures 1 1 0% 1 1 0%
Other 1 (1) 200% 1 0 n/m
Total Interest Expense and Other ($12) ($18) -33% ($24) ($28) -14%
Income Before Income Taxes ($52) ($185) 72% $33 ($35) 194%
Income Taxes ($18) ($65) 72% $12 ($12) 200%
Net Income (Loss) including merger related
($34) ($120) 72% $21 ($23) 191%
charges and Purchase Accounting Adjustments**
Merger Related Charges - 66 n/m - 66 n/m
Purchase Accounting Adjustment 33 - n/m 33 - n/m
Net Income (Loss) excluding merger related
charges ($1) ($54) 98% $54 $43 25%
The Condensed Consolidated Statement of Income
(Unaudited) should be read in conjunction with the
Notes to Consolidated Financial Statements appearing
in the not meaningful to Shareholders, 10K, and 10Q.
n/m - Annual Report
*DTE Energy 2001 consolidated results only includes one month (June) results
** Purchase accounting adjustments reverse losses reflected in regulated gas operations that have been eliminated at DTE Energy
Reg Gas Inc Statement p.9
10. Sales Analysis
Electric - Detroit Edison Service Area (GWh)
2nd Quarter % Change
from 2Q 2001
Category 2000 2001 2002
Residential 3,270 3,236 3,528 9.0%
Commercial 4,959 4,942 5,150 4.2%
Industrial 4,189 3,720 3,730 0.3%
Other 614 629 634 0.8%
Total System Sales 13,032 12,527 13,042 4.1%
Mitigation 40 N/A N/A N/A
Total Sales 13,072 12,527 13,042 4.1%
Gas Distribution - MichCon (MCF)
% Change
2nd Quarter
from 2001
Category 2000 2001 2002
Residential 18,759,714 17,849,568 22,044,213 23.5%
Commercial 5,192,206 5,489,233 7,122,666 29.8%
Industrial 308,410 330,247 306,361 -7.2%
Total Sales 24,260,330 23,669,048 29,473,240 24.5%
Heating and Cooling Degree Day Data
2nd Quarter % Change
2000 2001 2002 from 2Q 2001
Heating Degree Days 694 586 843 43.9%
Normal 812 812 812
% over (under) Normal -15% -28% 4%
Cooling Degree Days 238 233 256 9.9%
Normal 154 154 154
% over (under) Normal 55% 51% 66%
DTE Sales p.10
11. KEY TO COMPANY REPORTING METHODOLOGY
DTE Energy has shifted to business unit reporting for both internal and external purposes. This
method is more reflective of DTE Energy’s business operation. Overall this type of presentation will
provide more in depth and useful information to the financial community. In large part, the change in
segmentation is only a reclassification of the old components. The exception to this is the electric
utility, which is divided into three components: Energy Distribution – Regulated, Energy Resources
– Regulated and International Transmission Company.
The first schedule below shows the components of the current business breakdown. The second
schedule reconciles the current and the previous methodology.
Current Methodology
Energy Resources Energy Gas
Regulated Regulated
Detroit Edison Power Generation MichCon
Non-Regulated Citizens
Energy Services Southern Missouri Gas
Non-Regulated
Coal Services
Biomass Energy Pipeline & Processing
Energy Trading & CoEnergy Exploration & Production
Energy Distribution Corporate and Other
Regulated Holding Company
Non-Regulated
Detroit Edison LDC
International Transmission Company Energy Technology Investments
Non-Regulated including Plug Power
Energy Technologies
Previous Methodology
Detroit Edison MichCon
Regulated Energy Resources Regulated Energy Gas
Regulated Energy Distribution
International Transmission Company
Non-Regulated Holding Company
Non-Regulated Energy Resources
Non-Regulated Energy Distribution
Non-Regulated Gas
Non-Regulated Corporate and Other
Glossary p.11