Downloaded 104 times
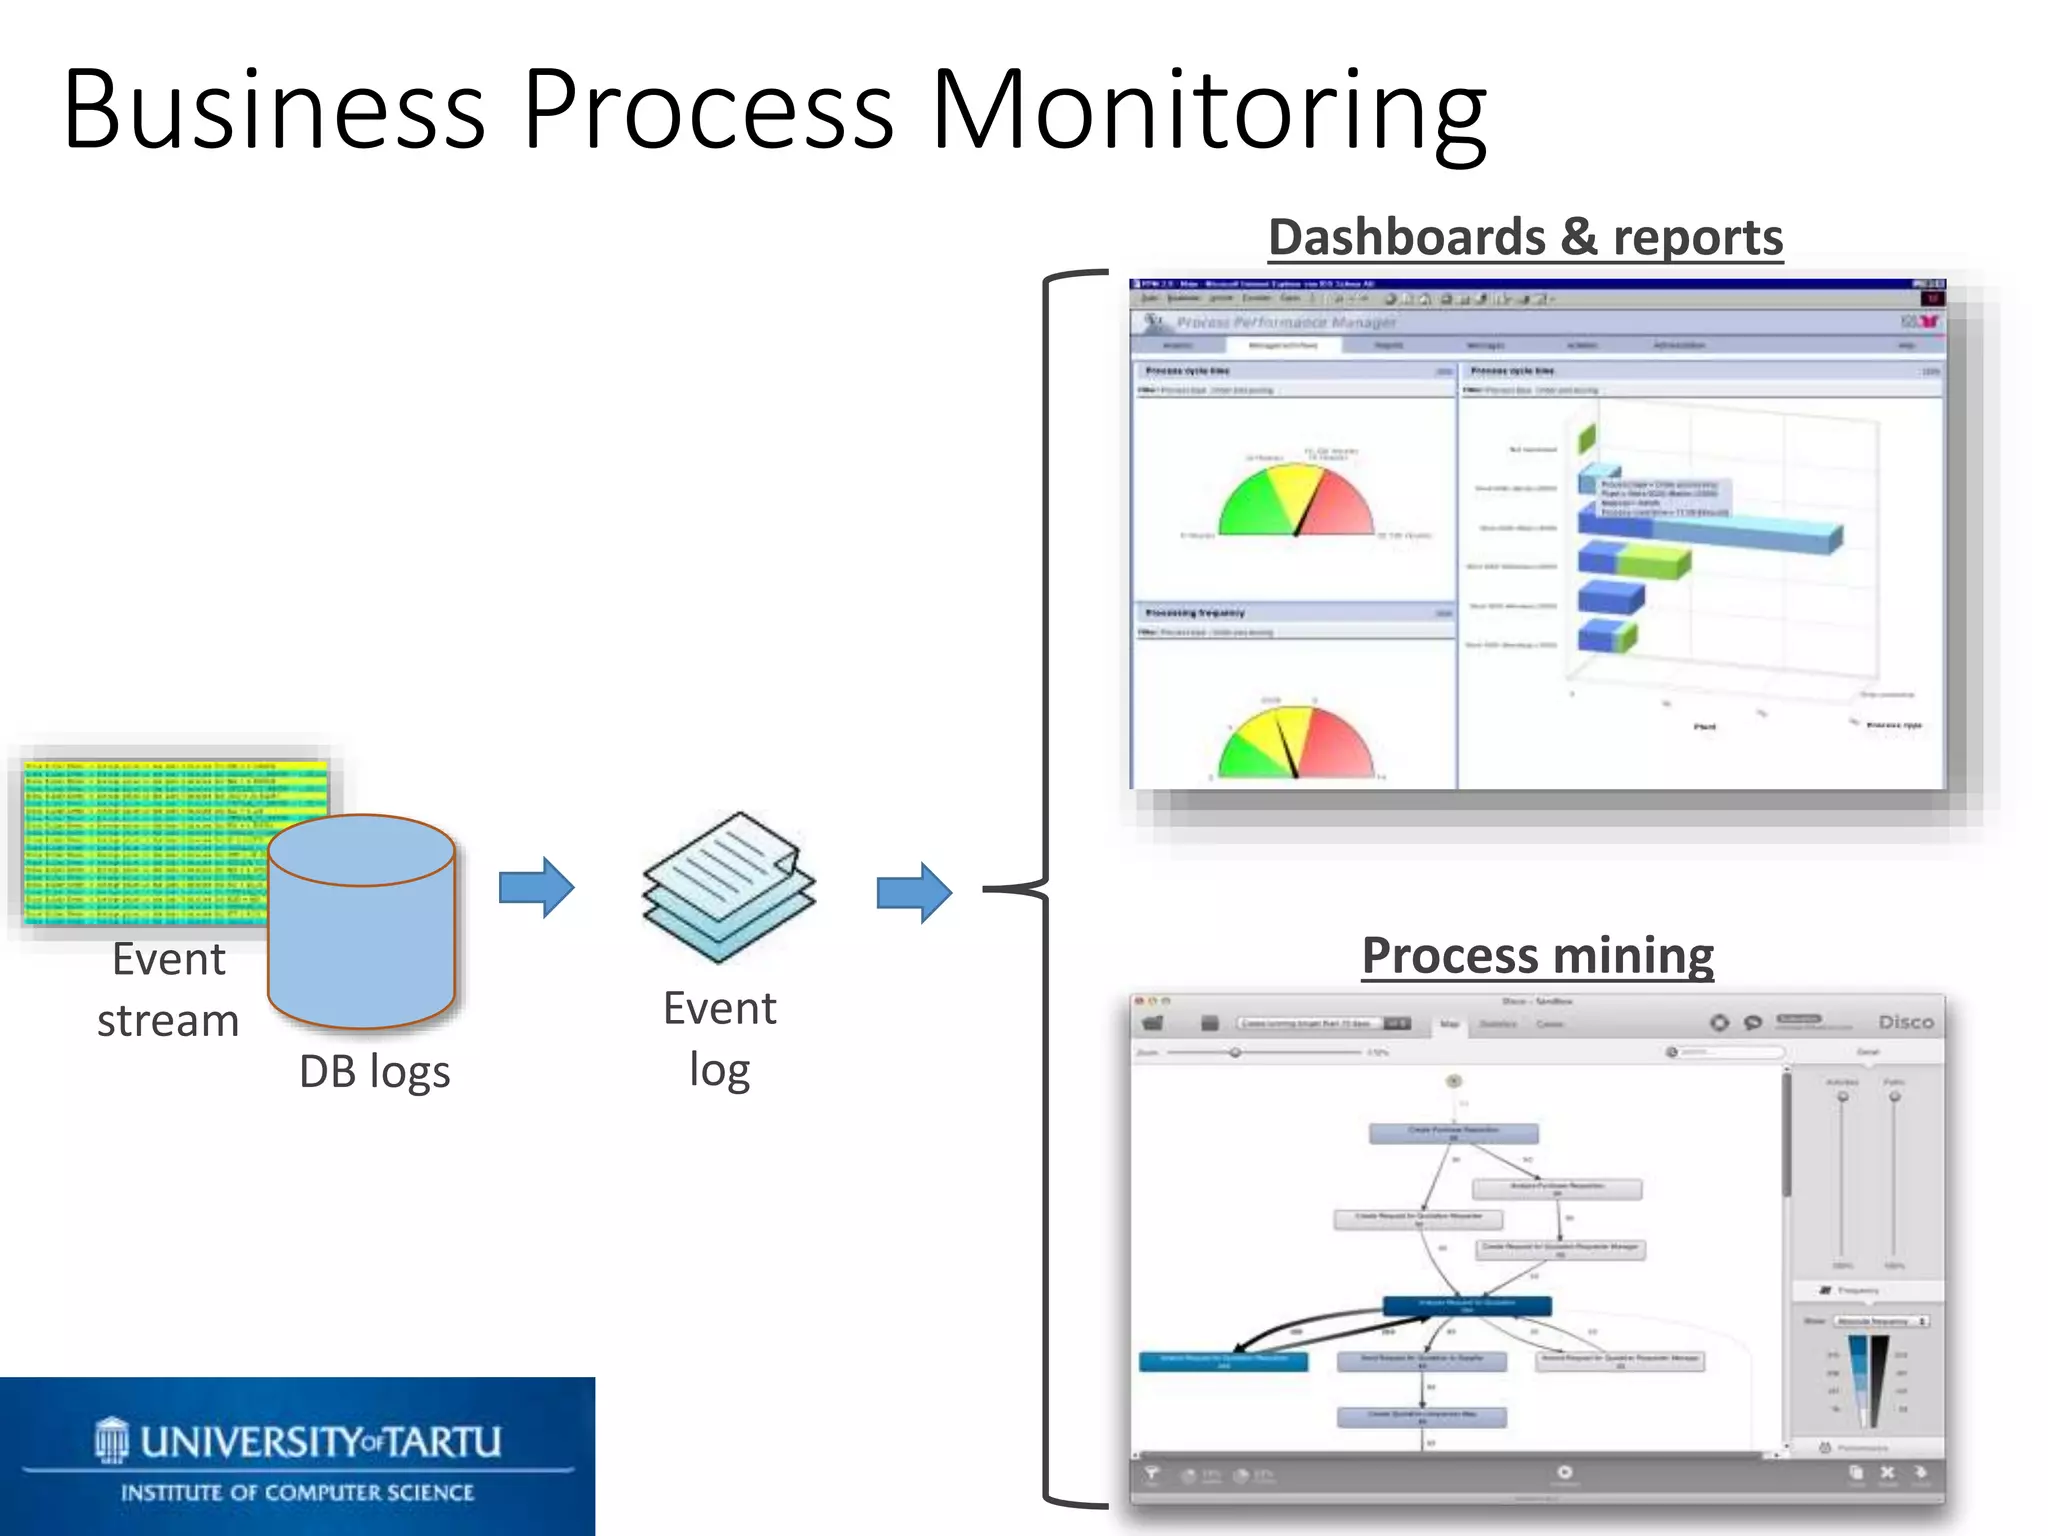
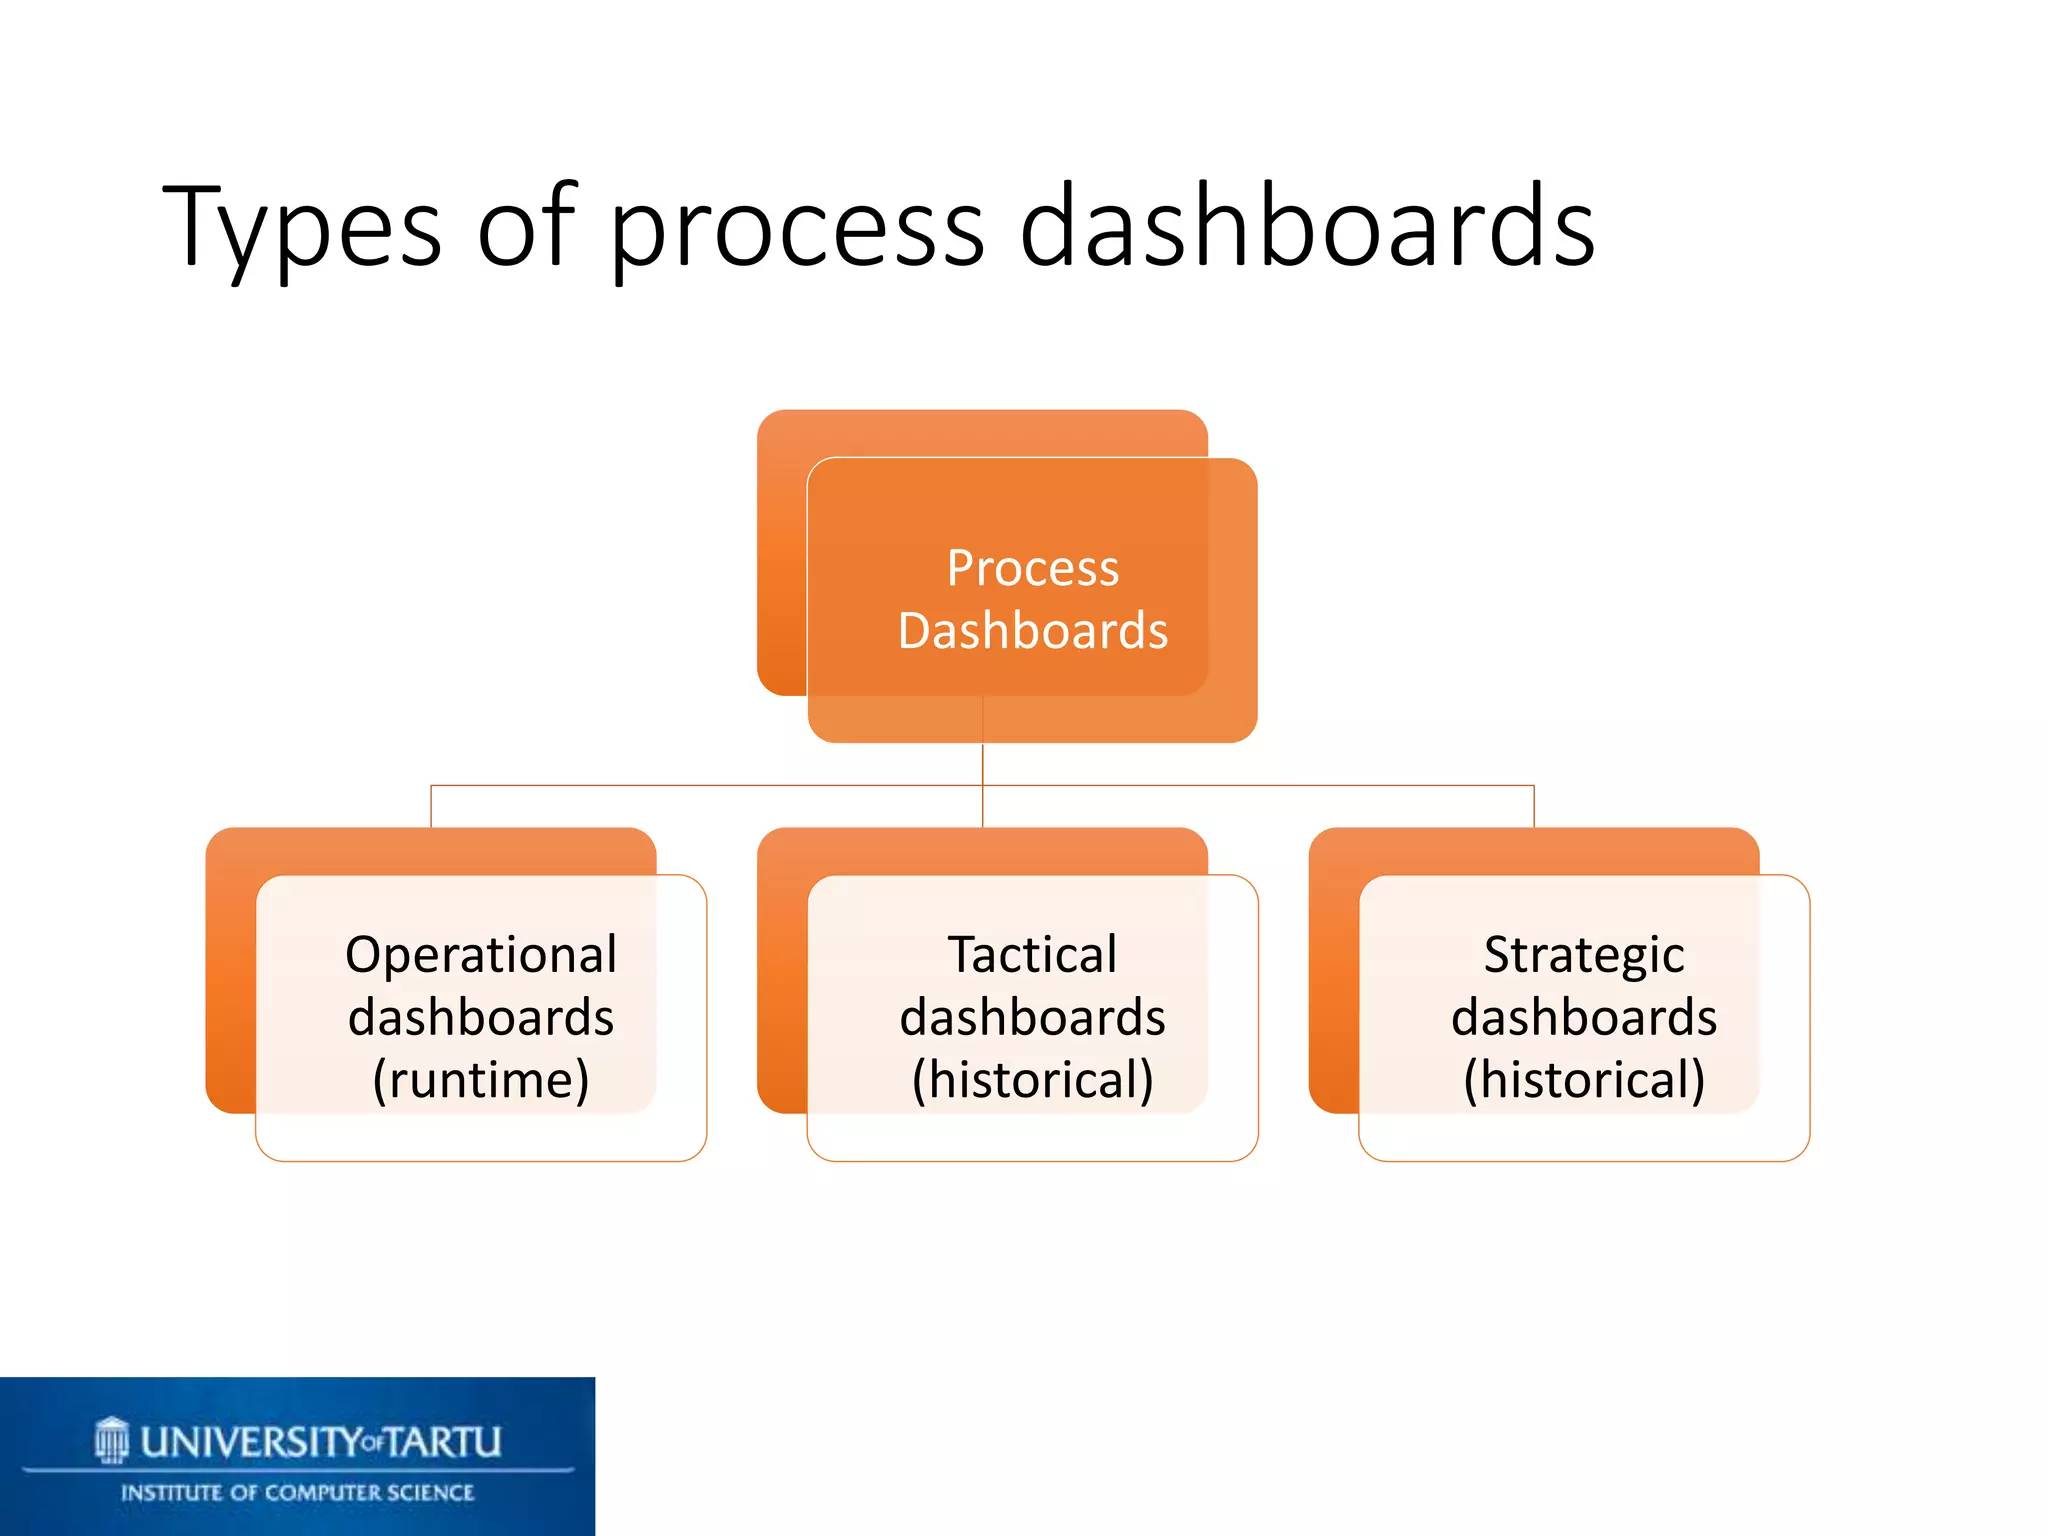
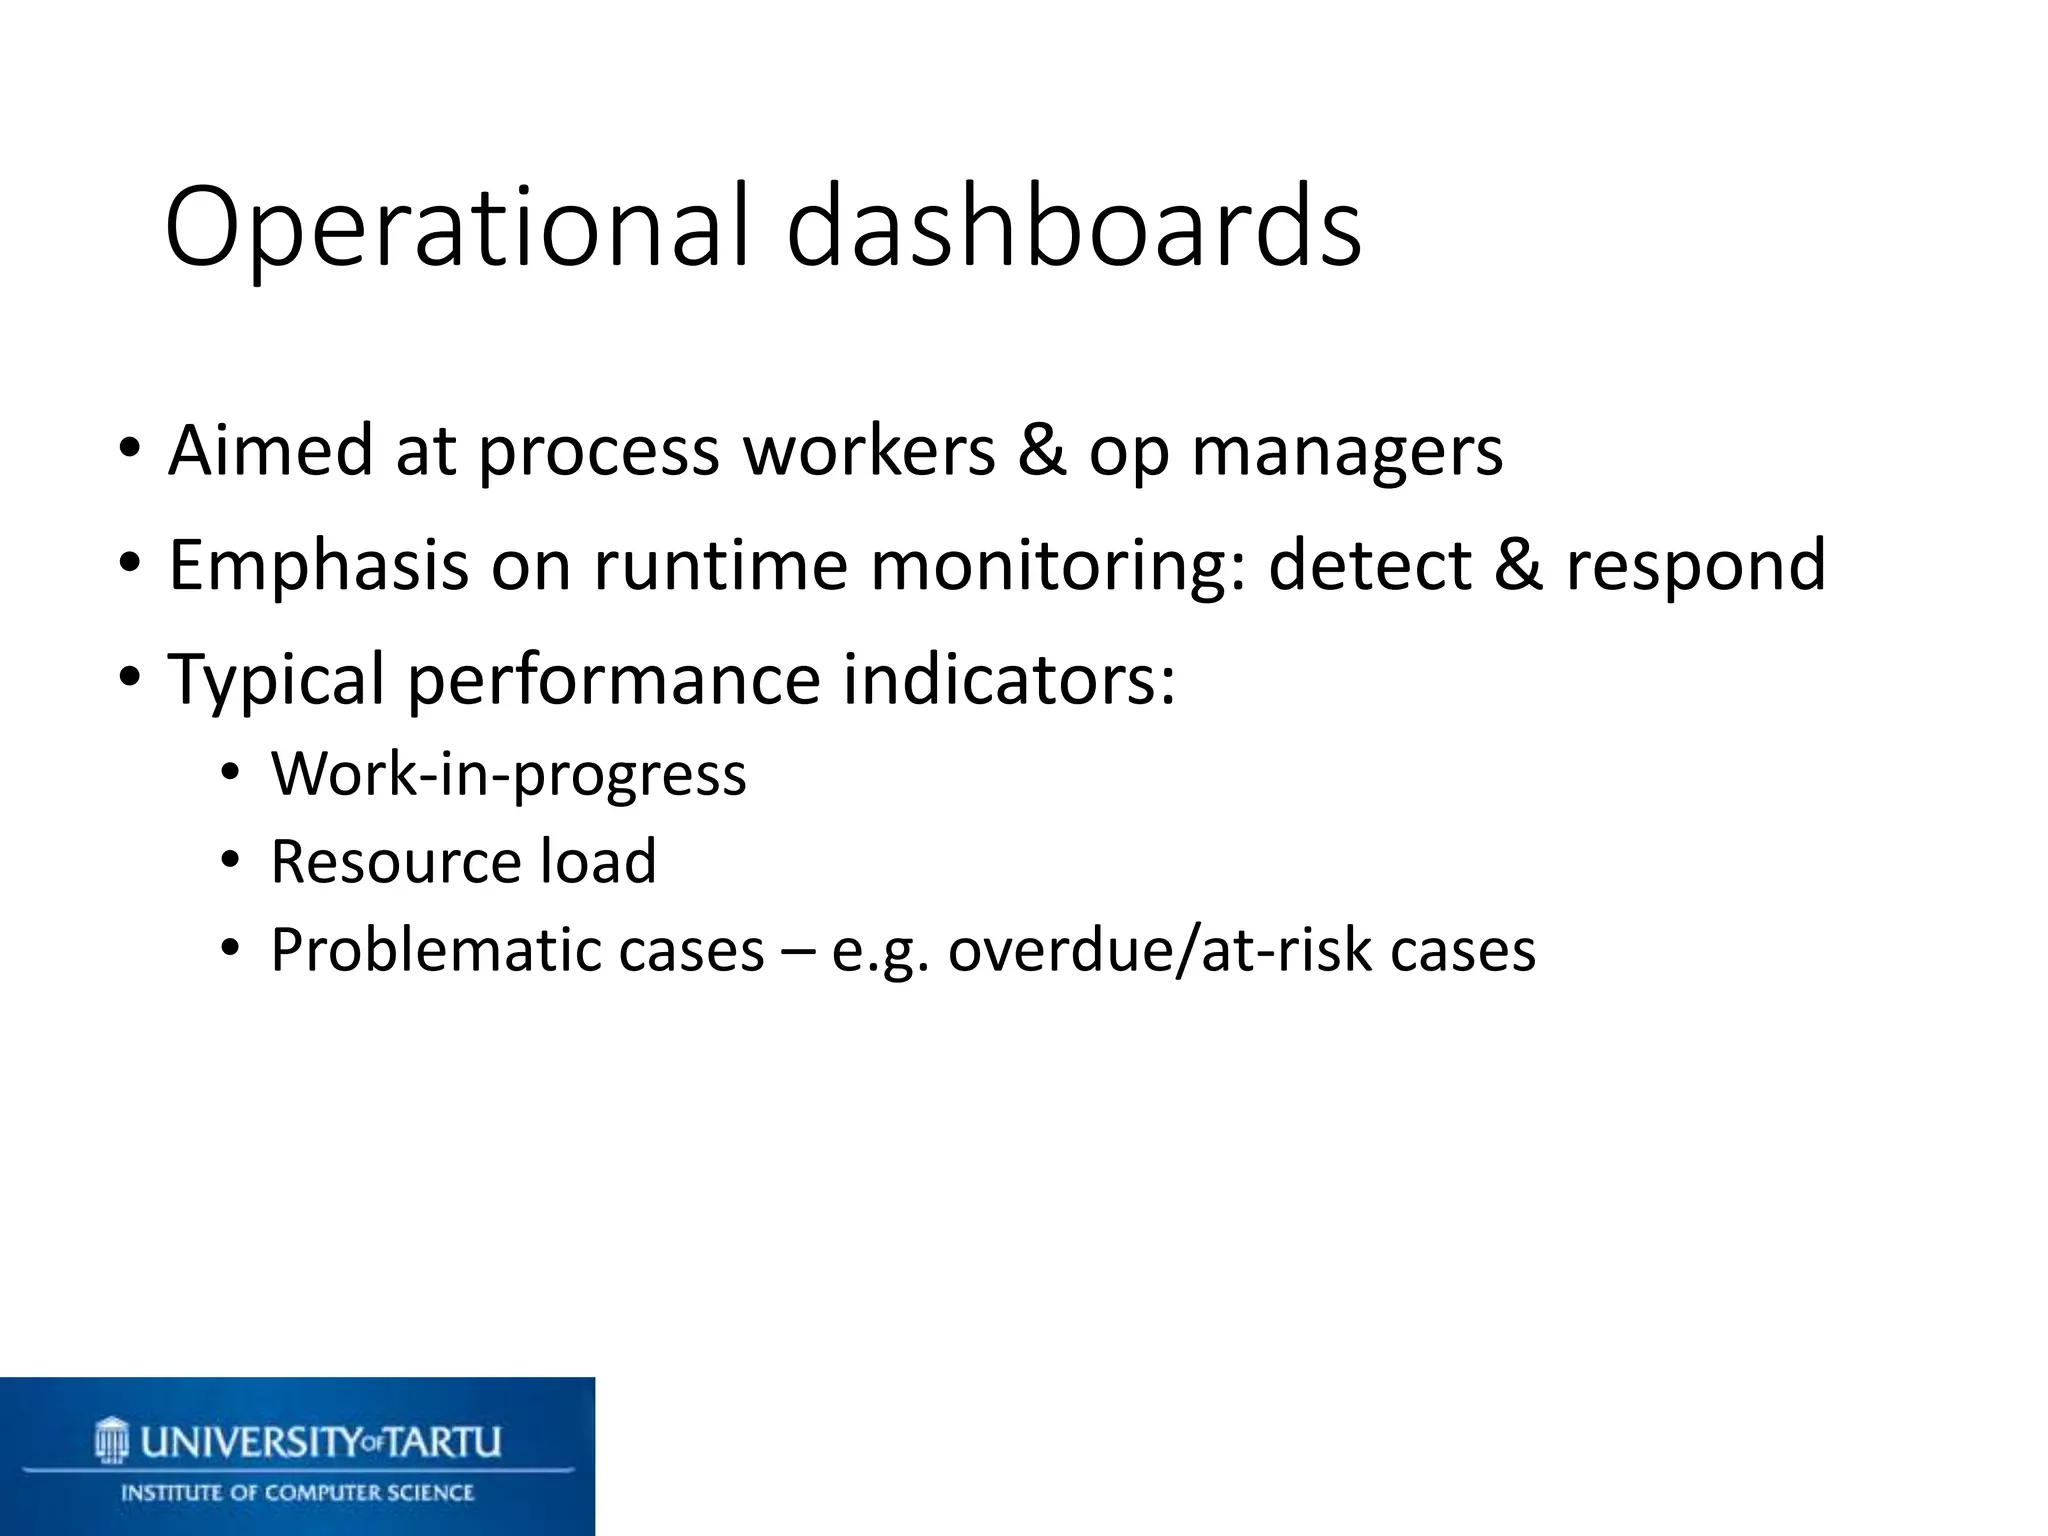
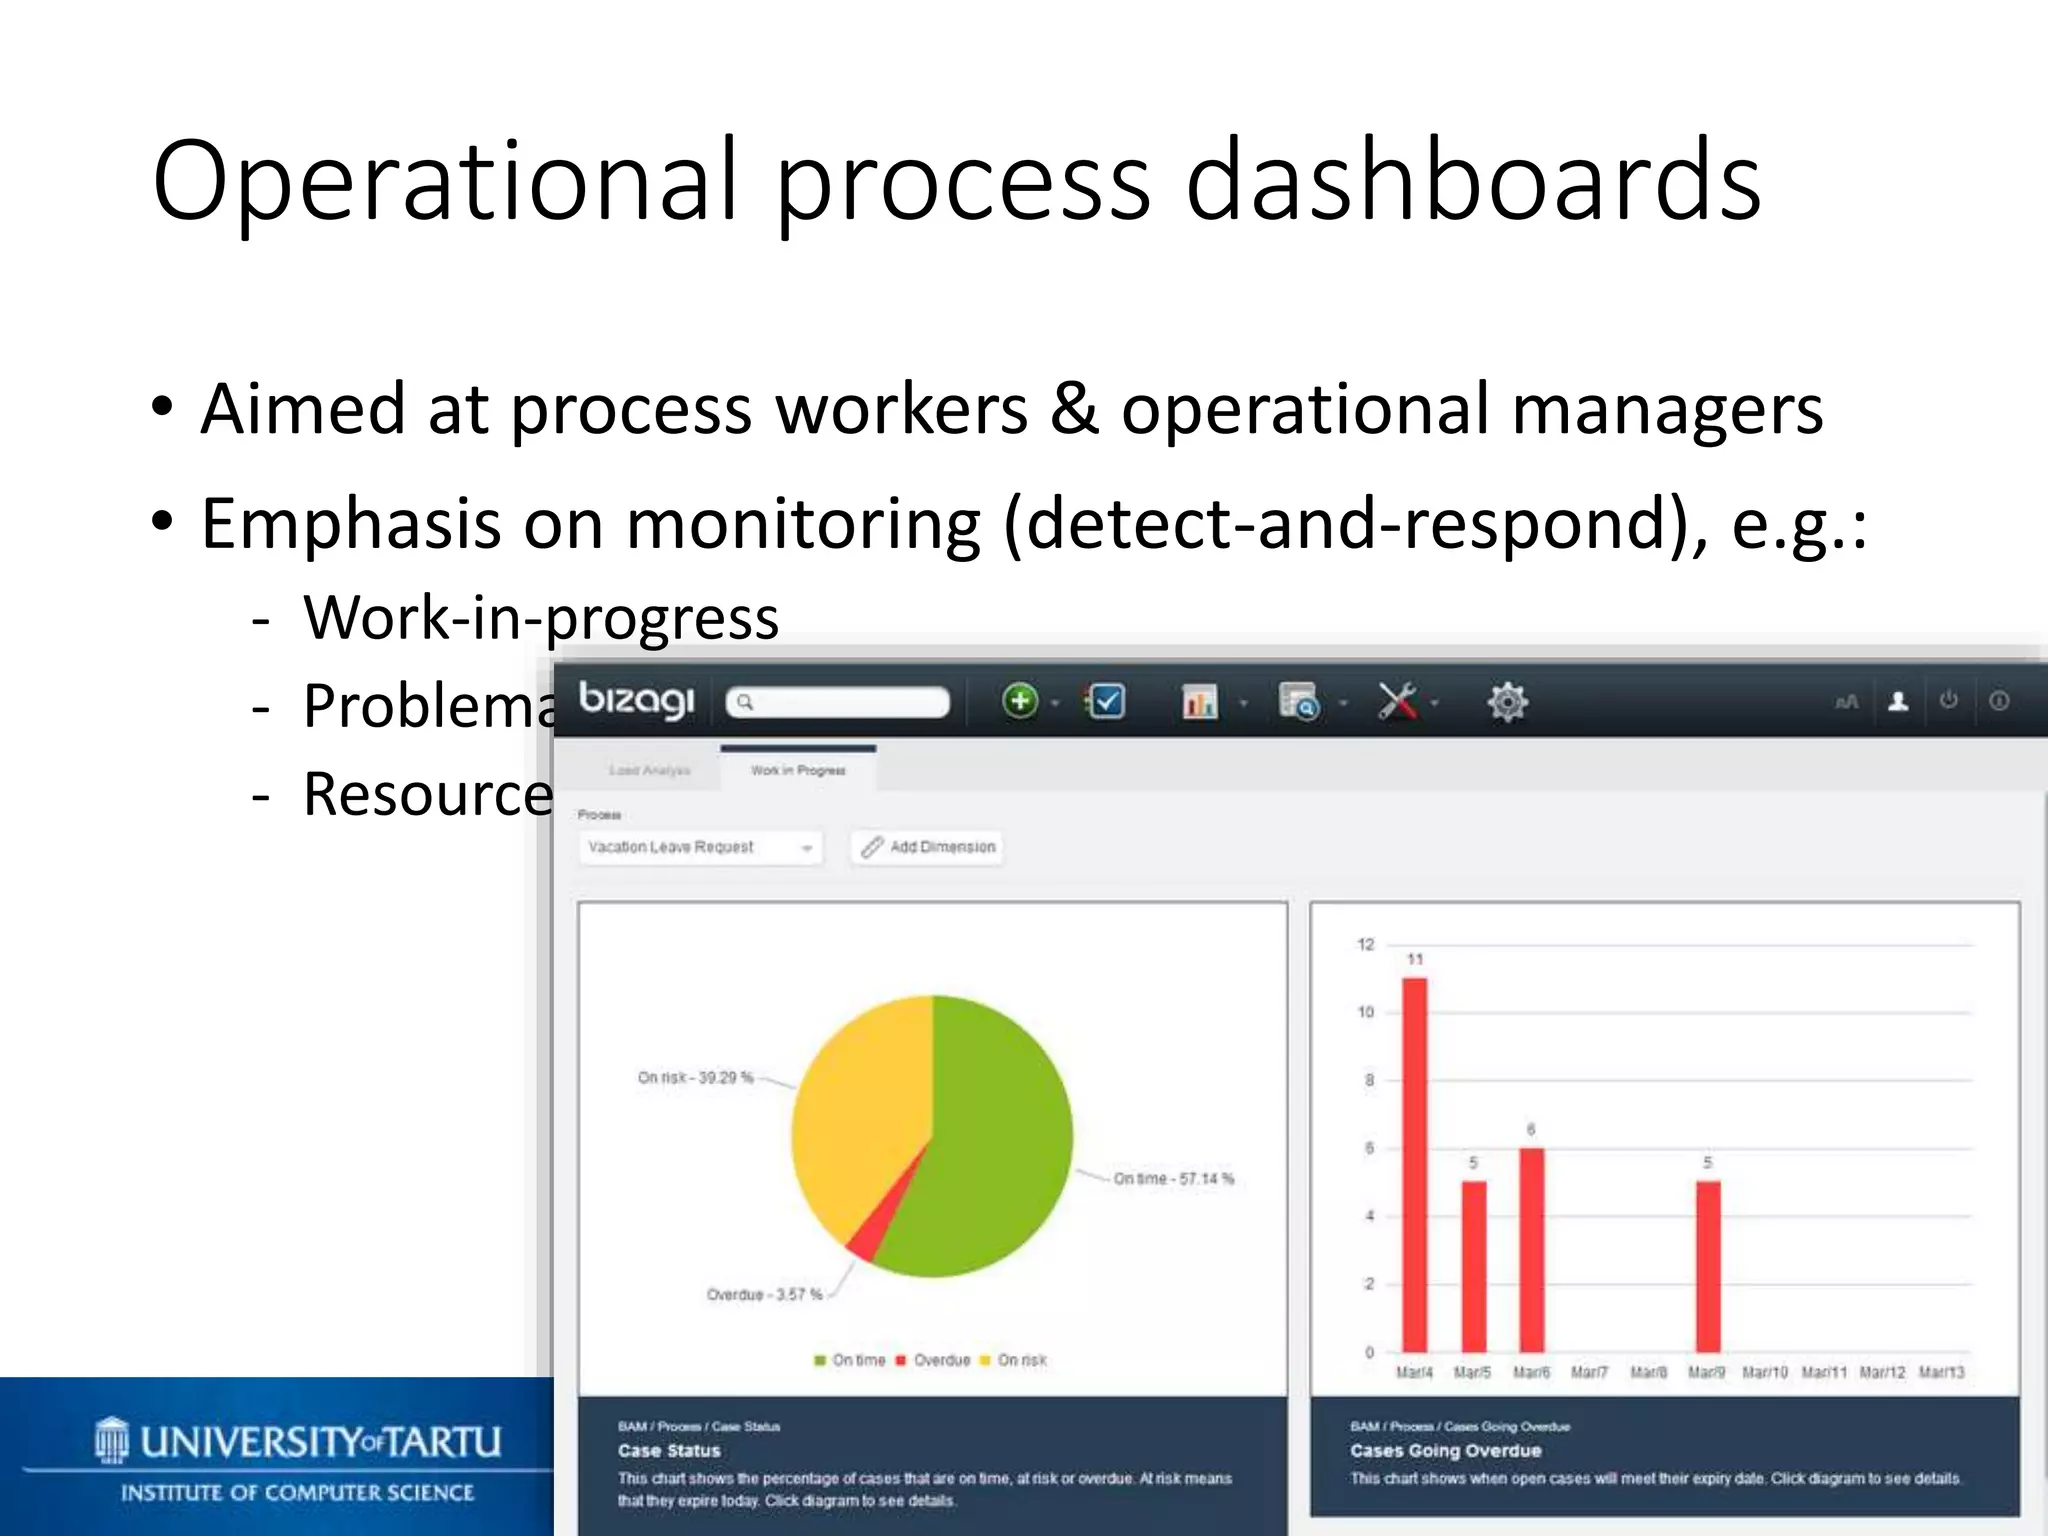
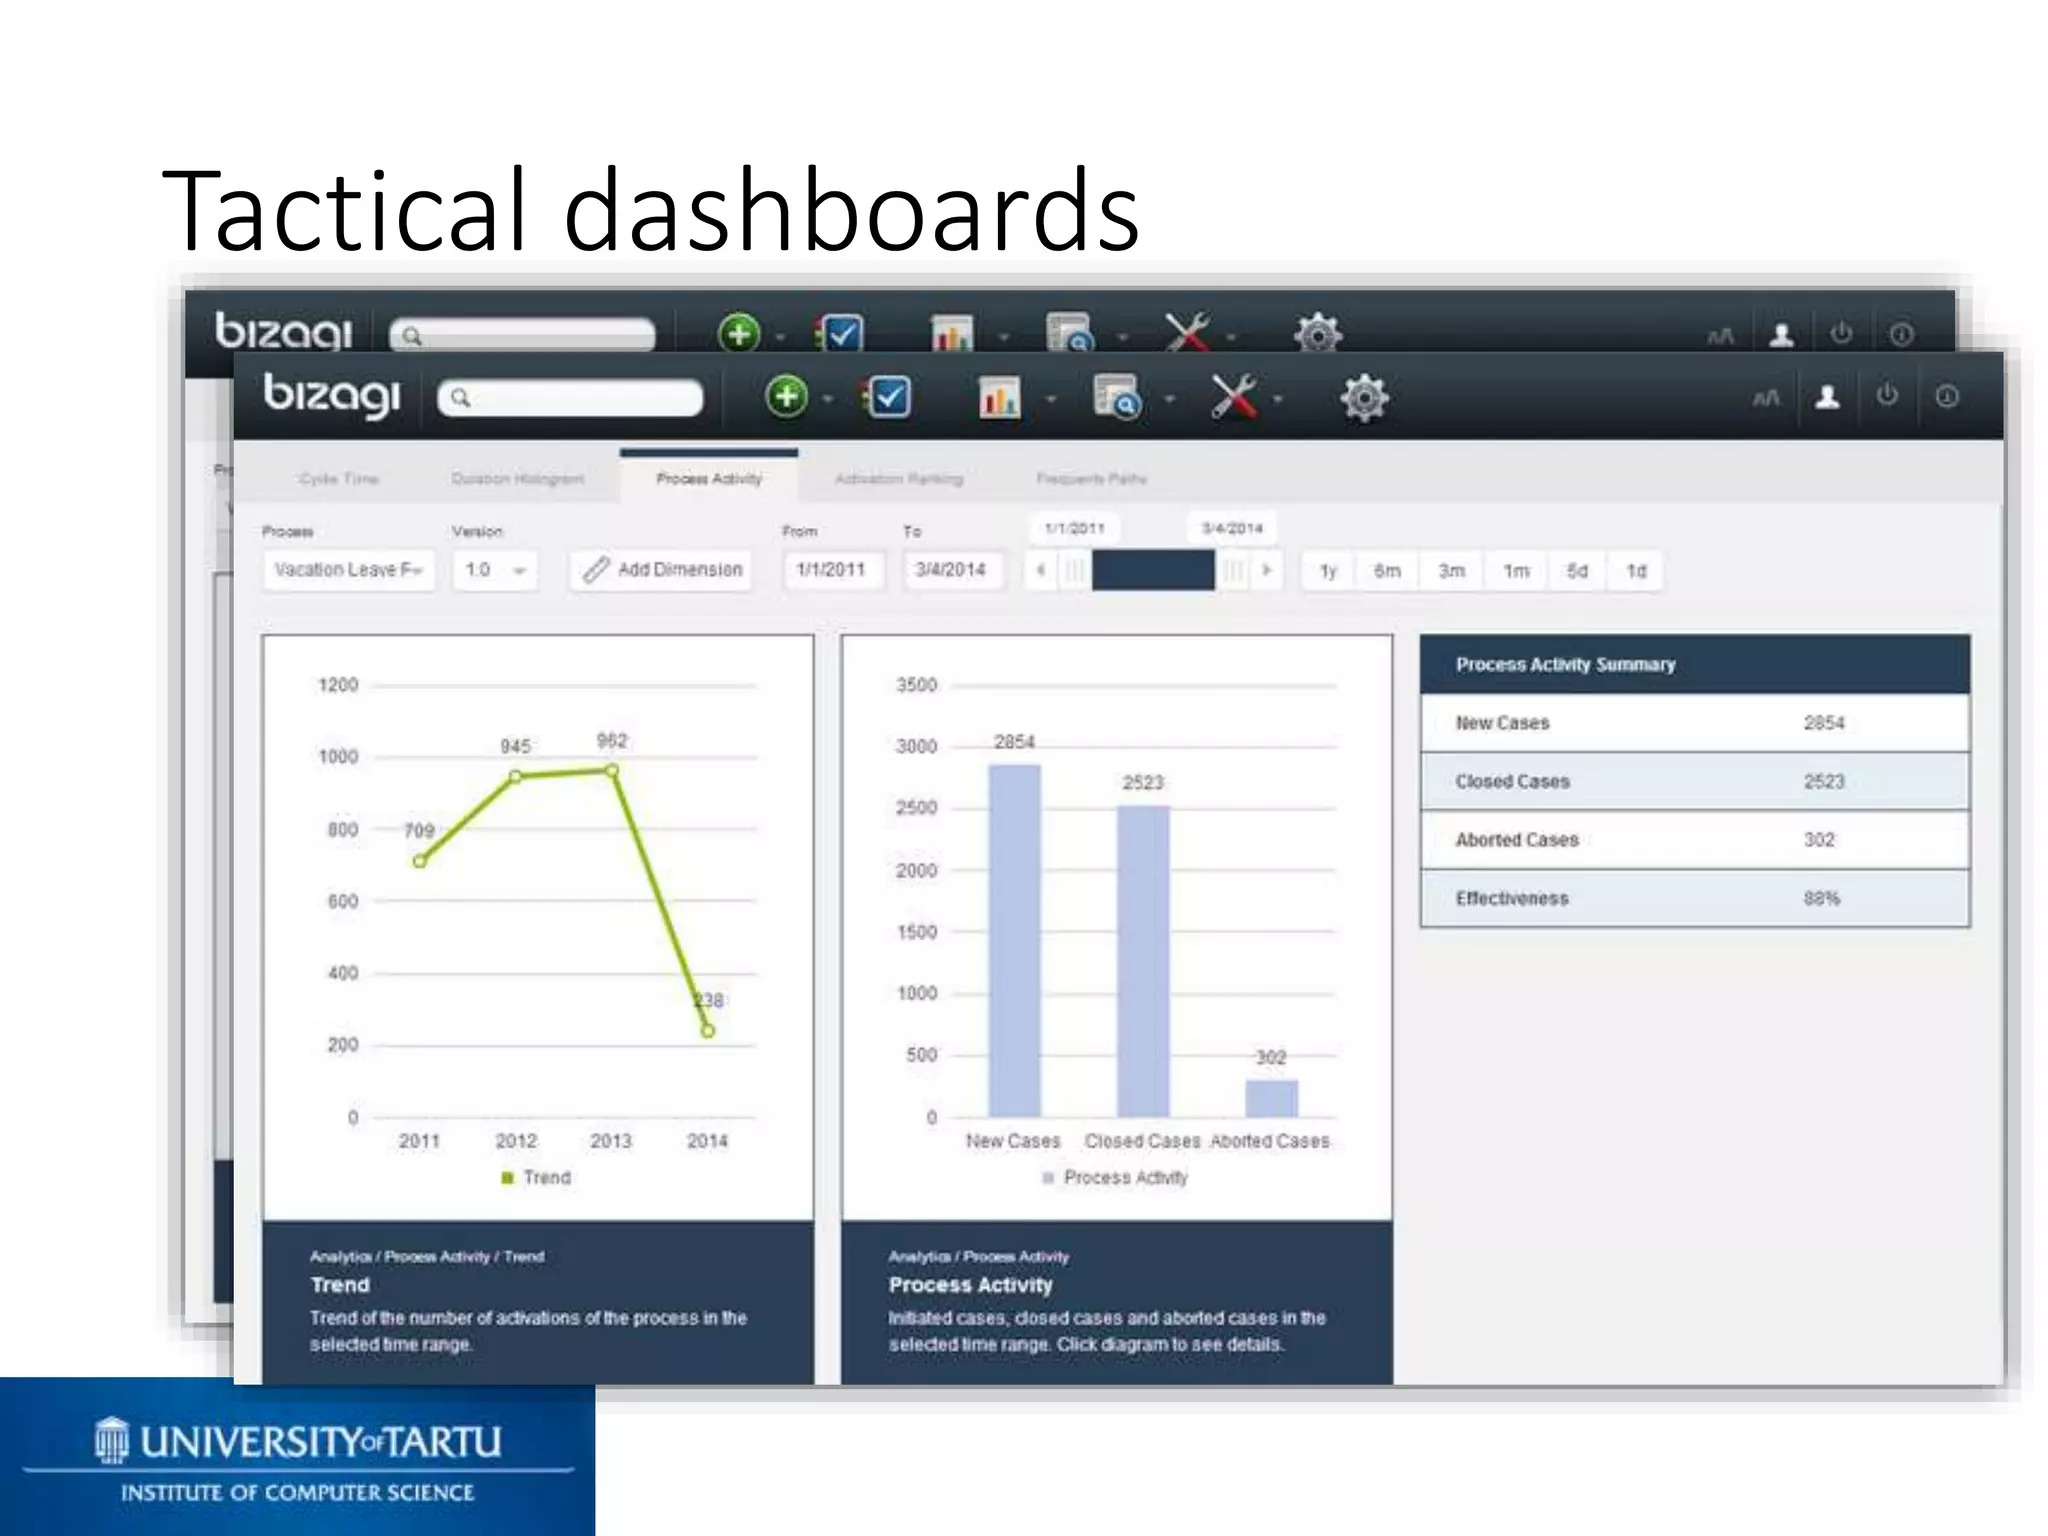
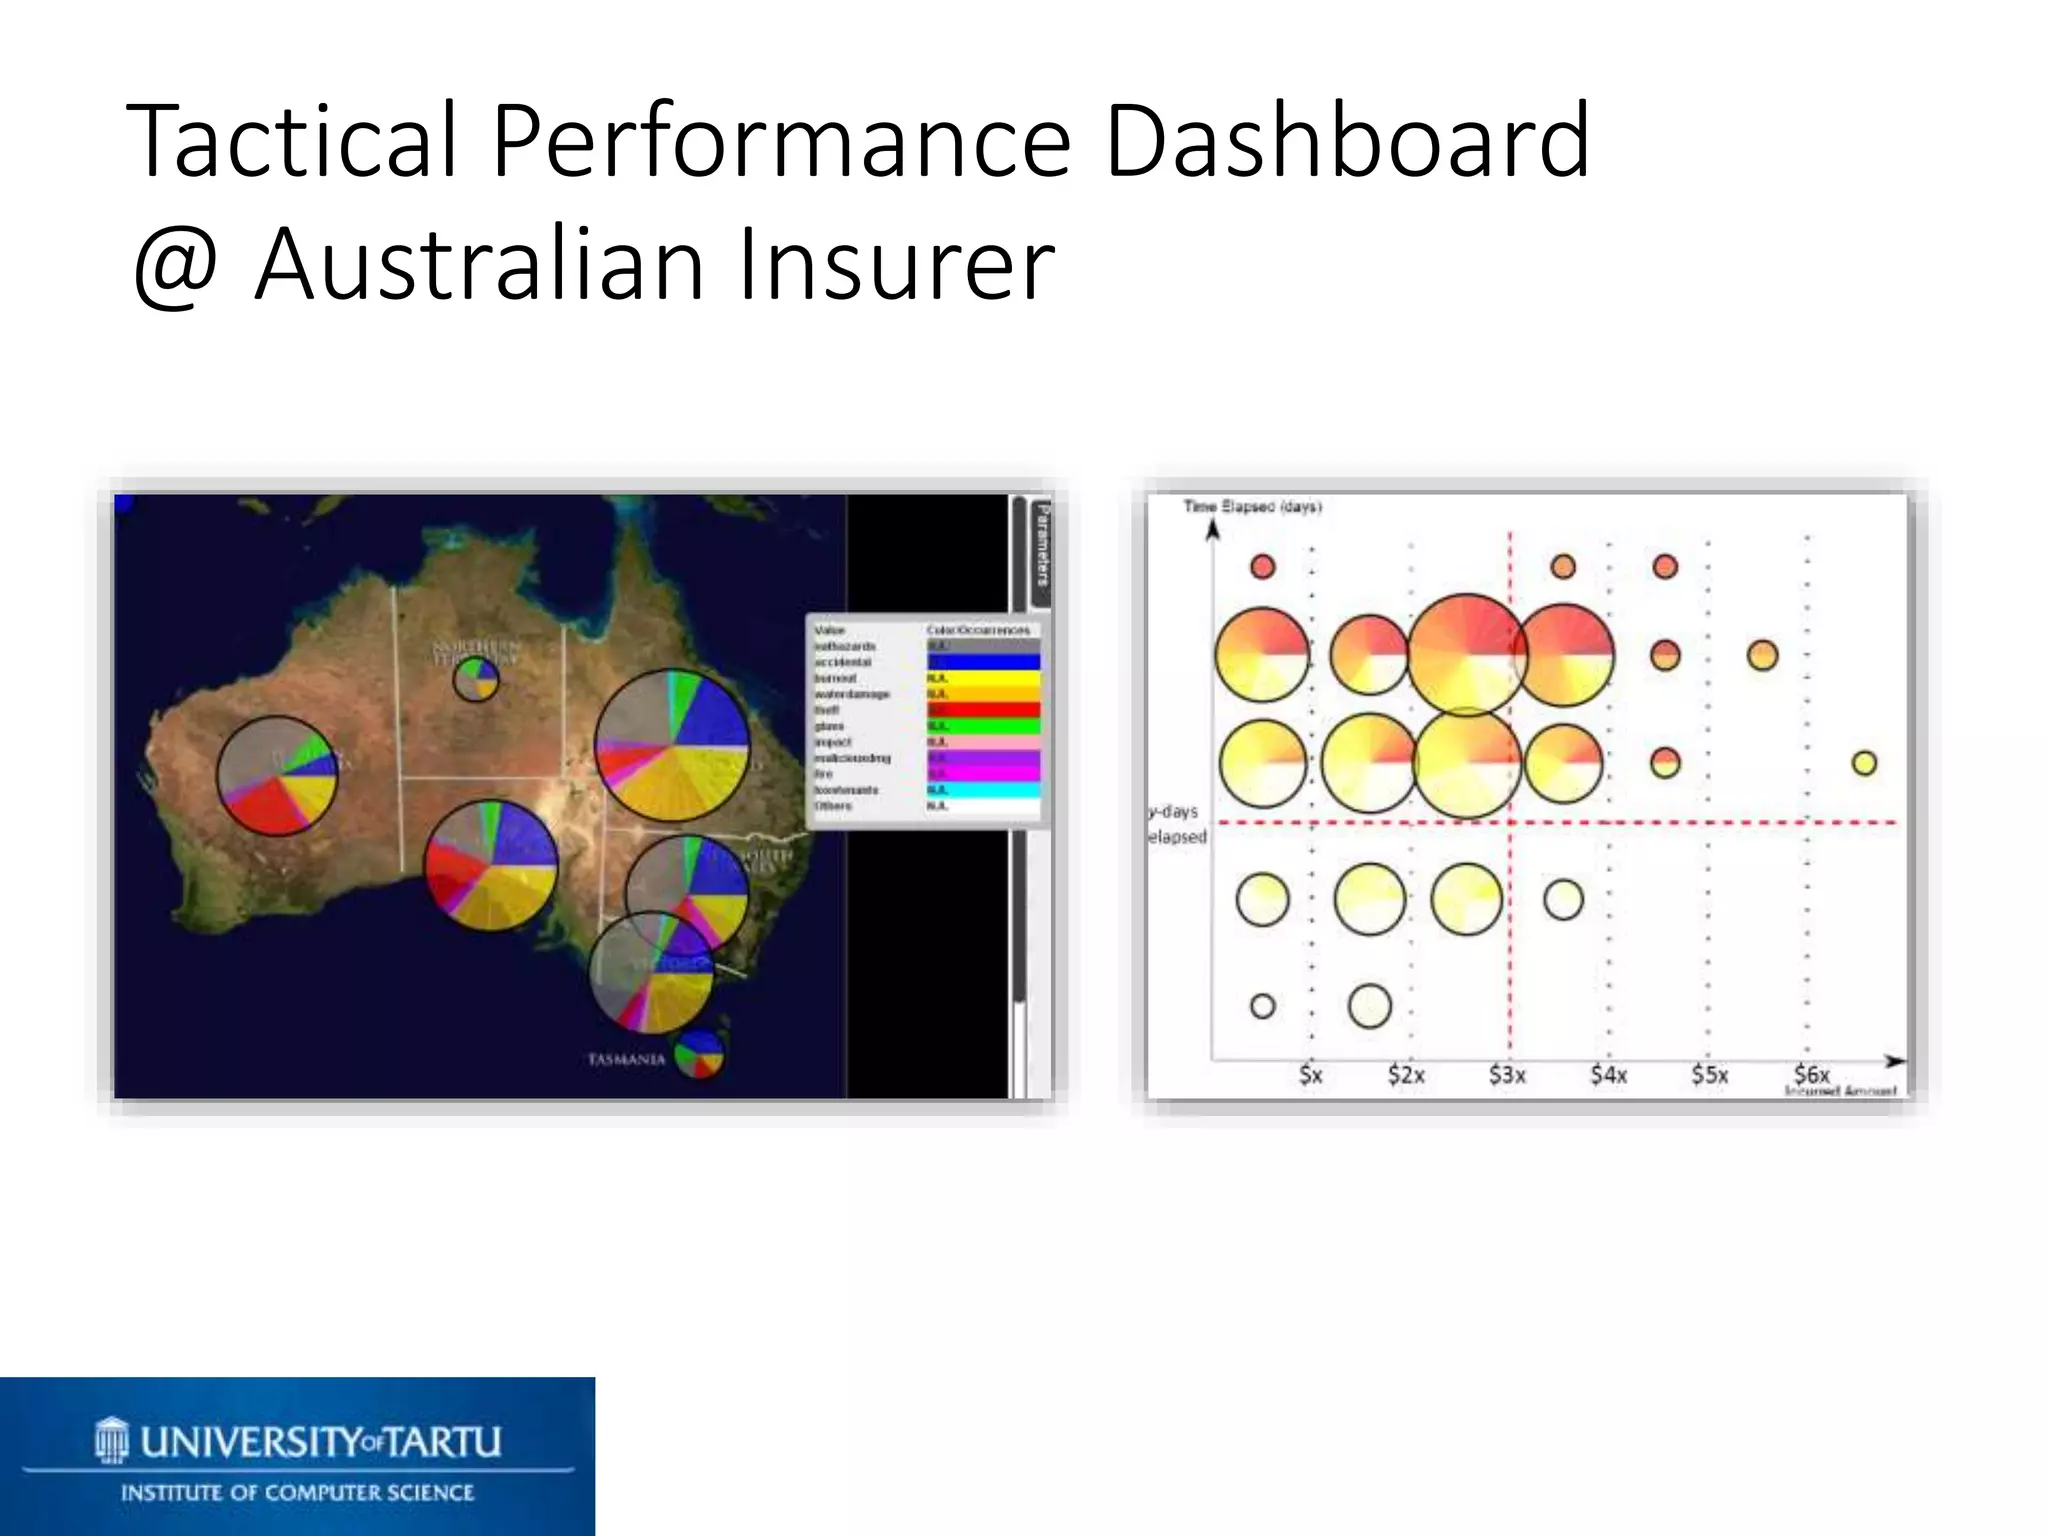
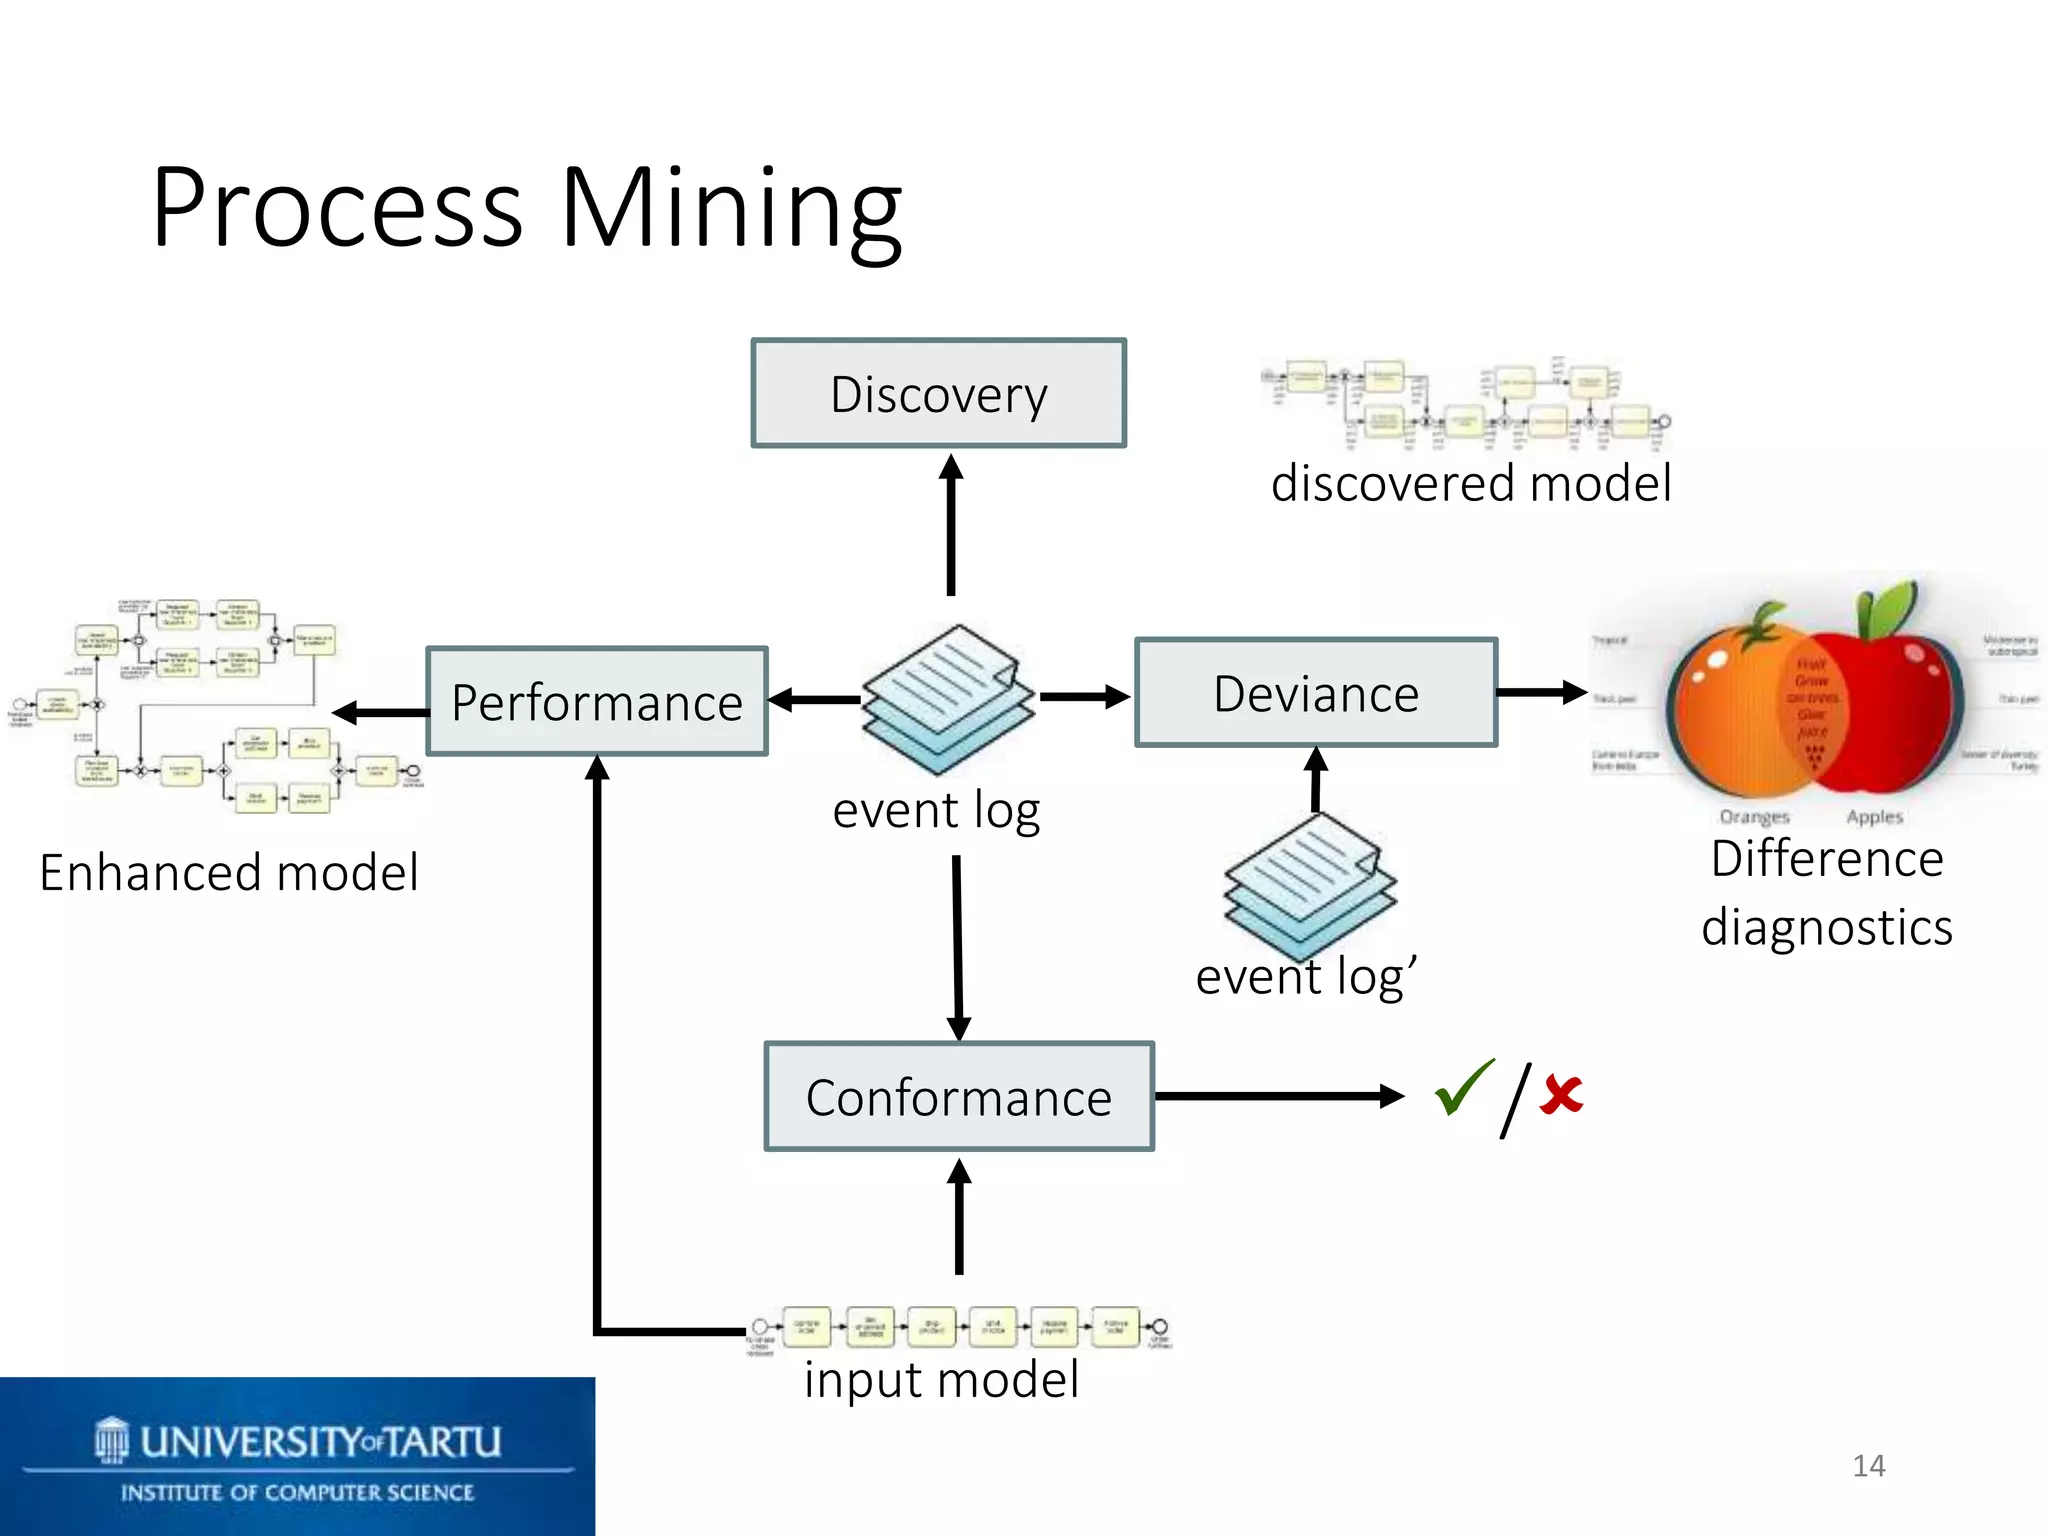
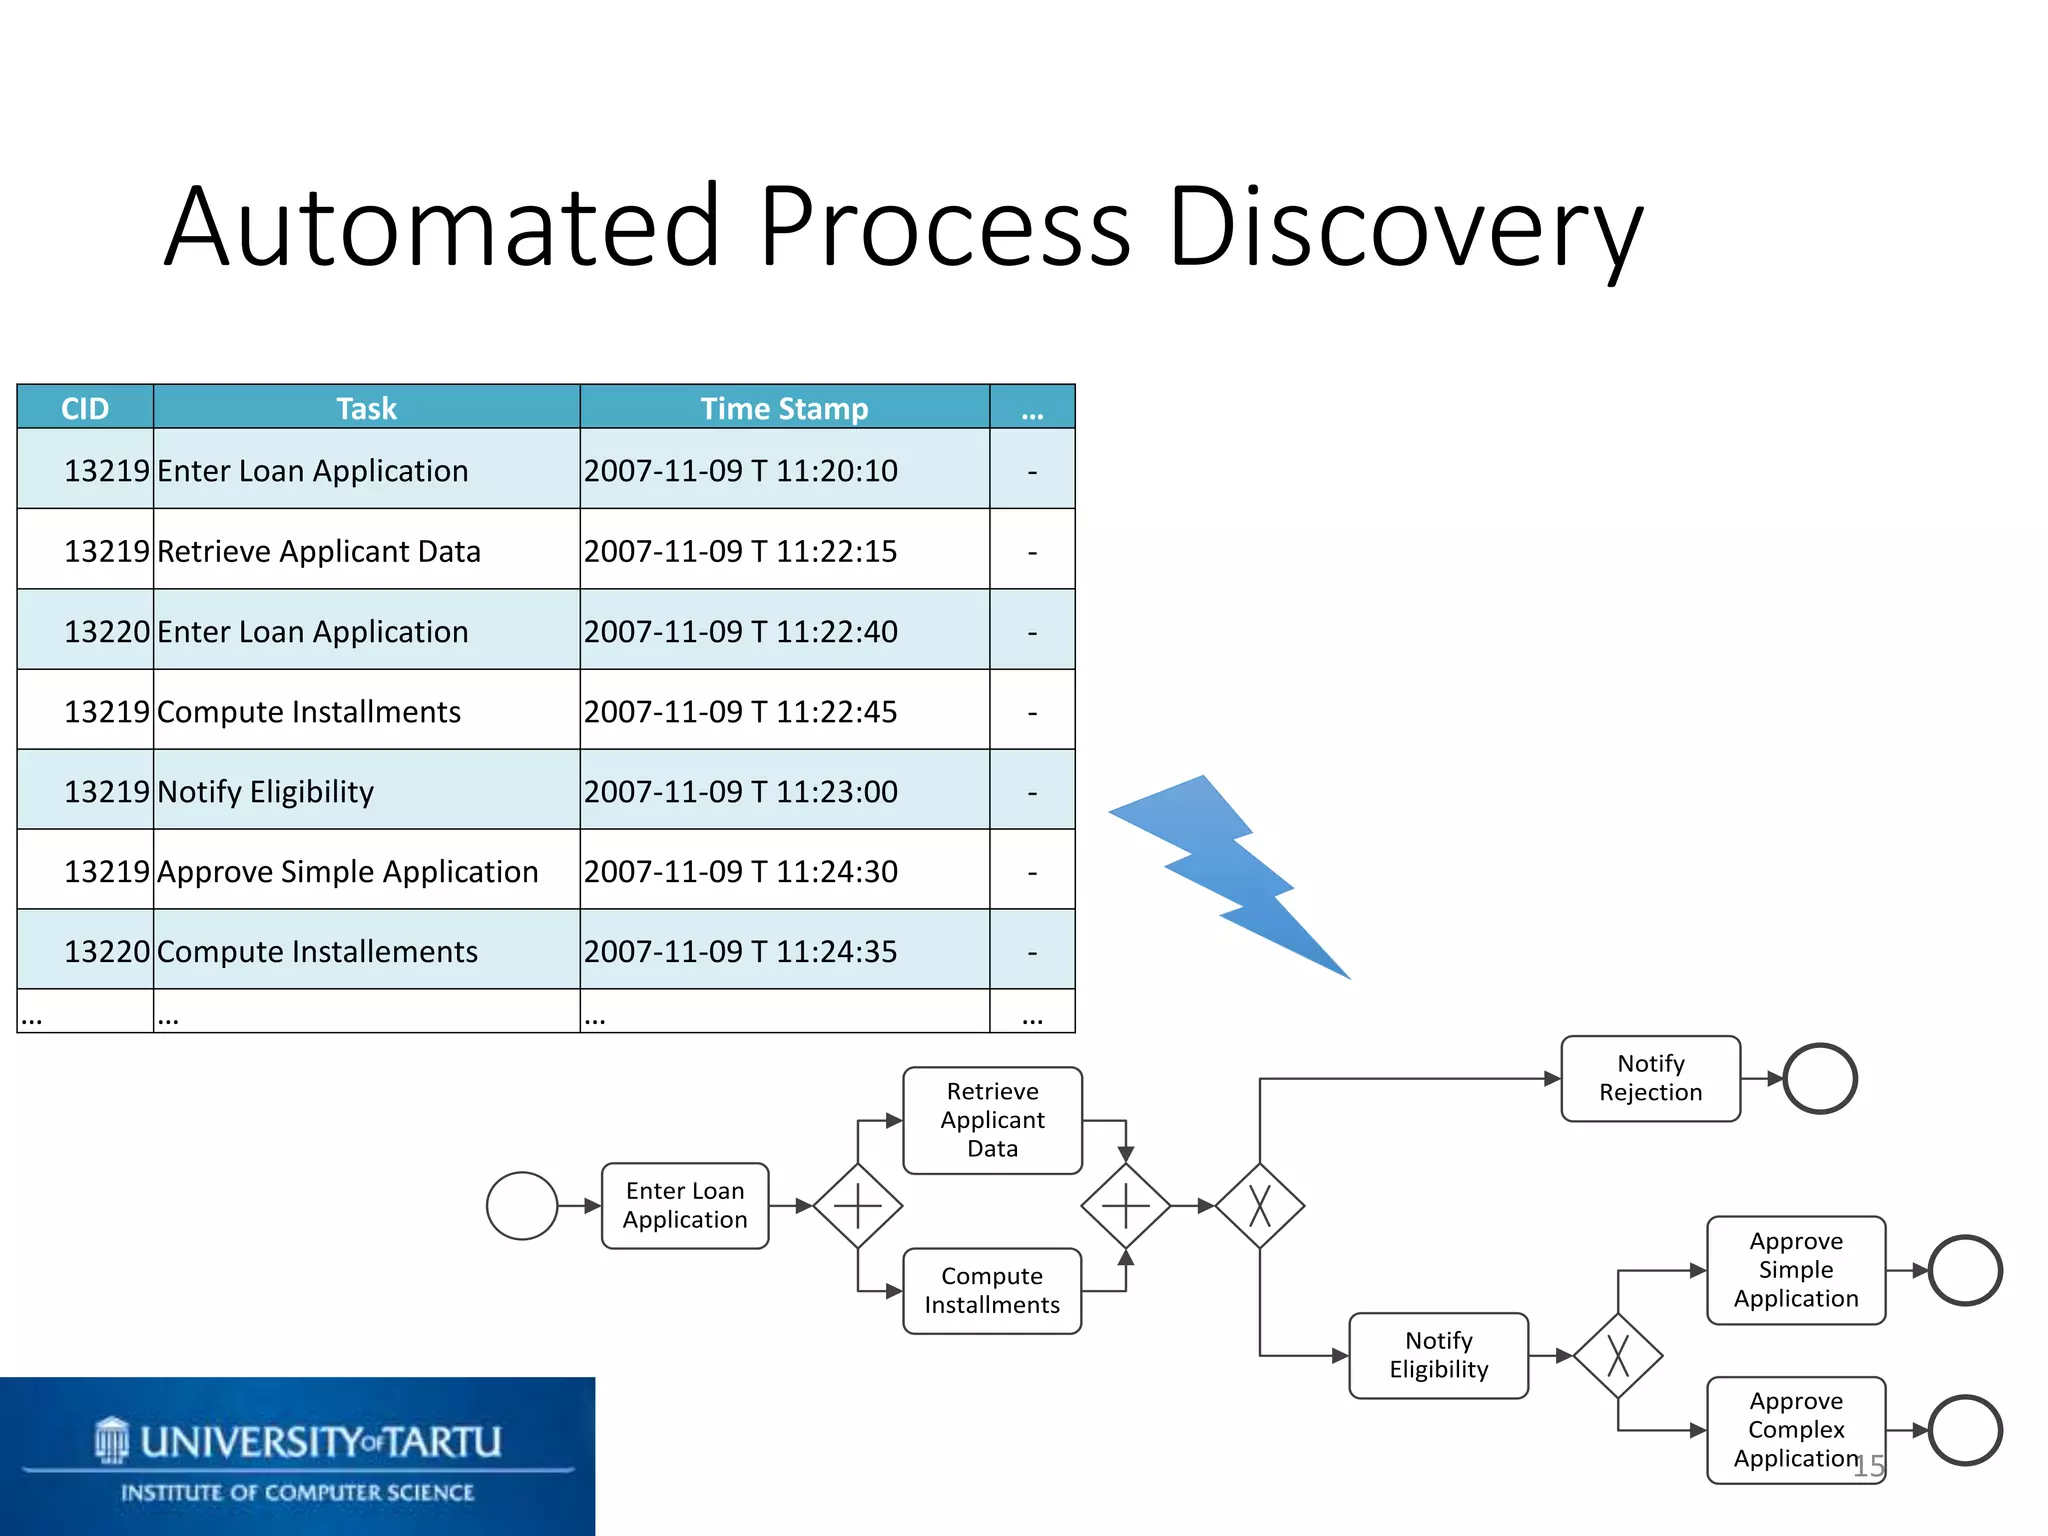
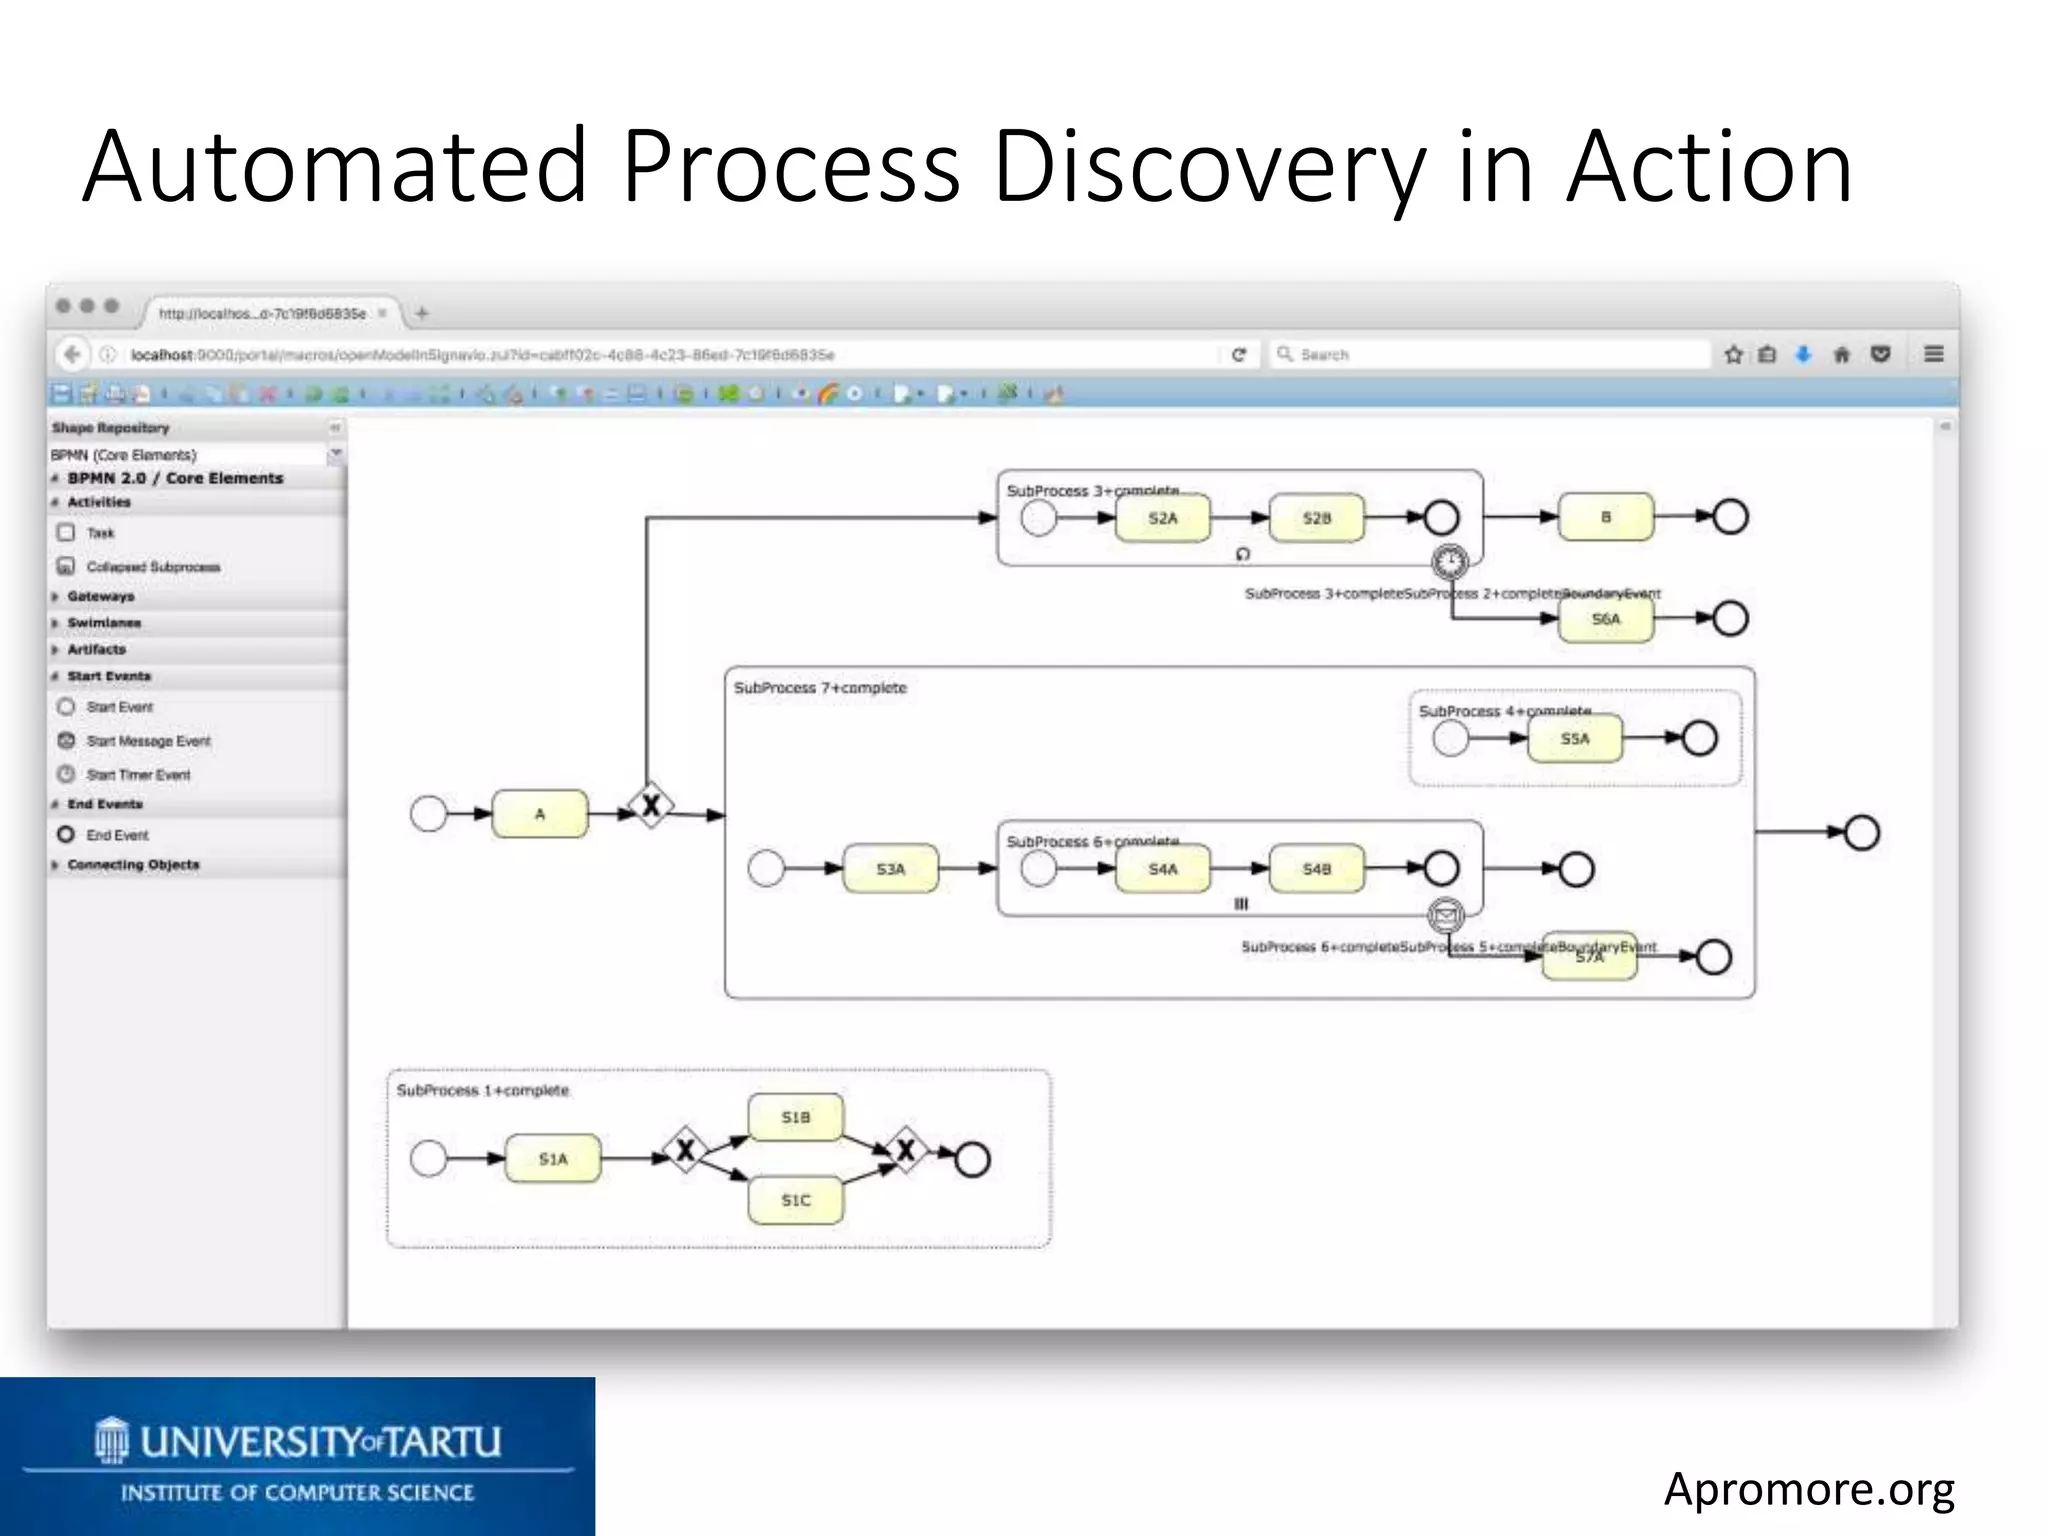
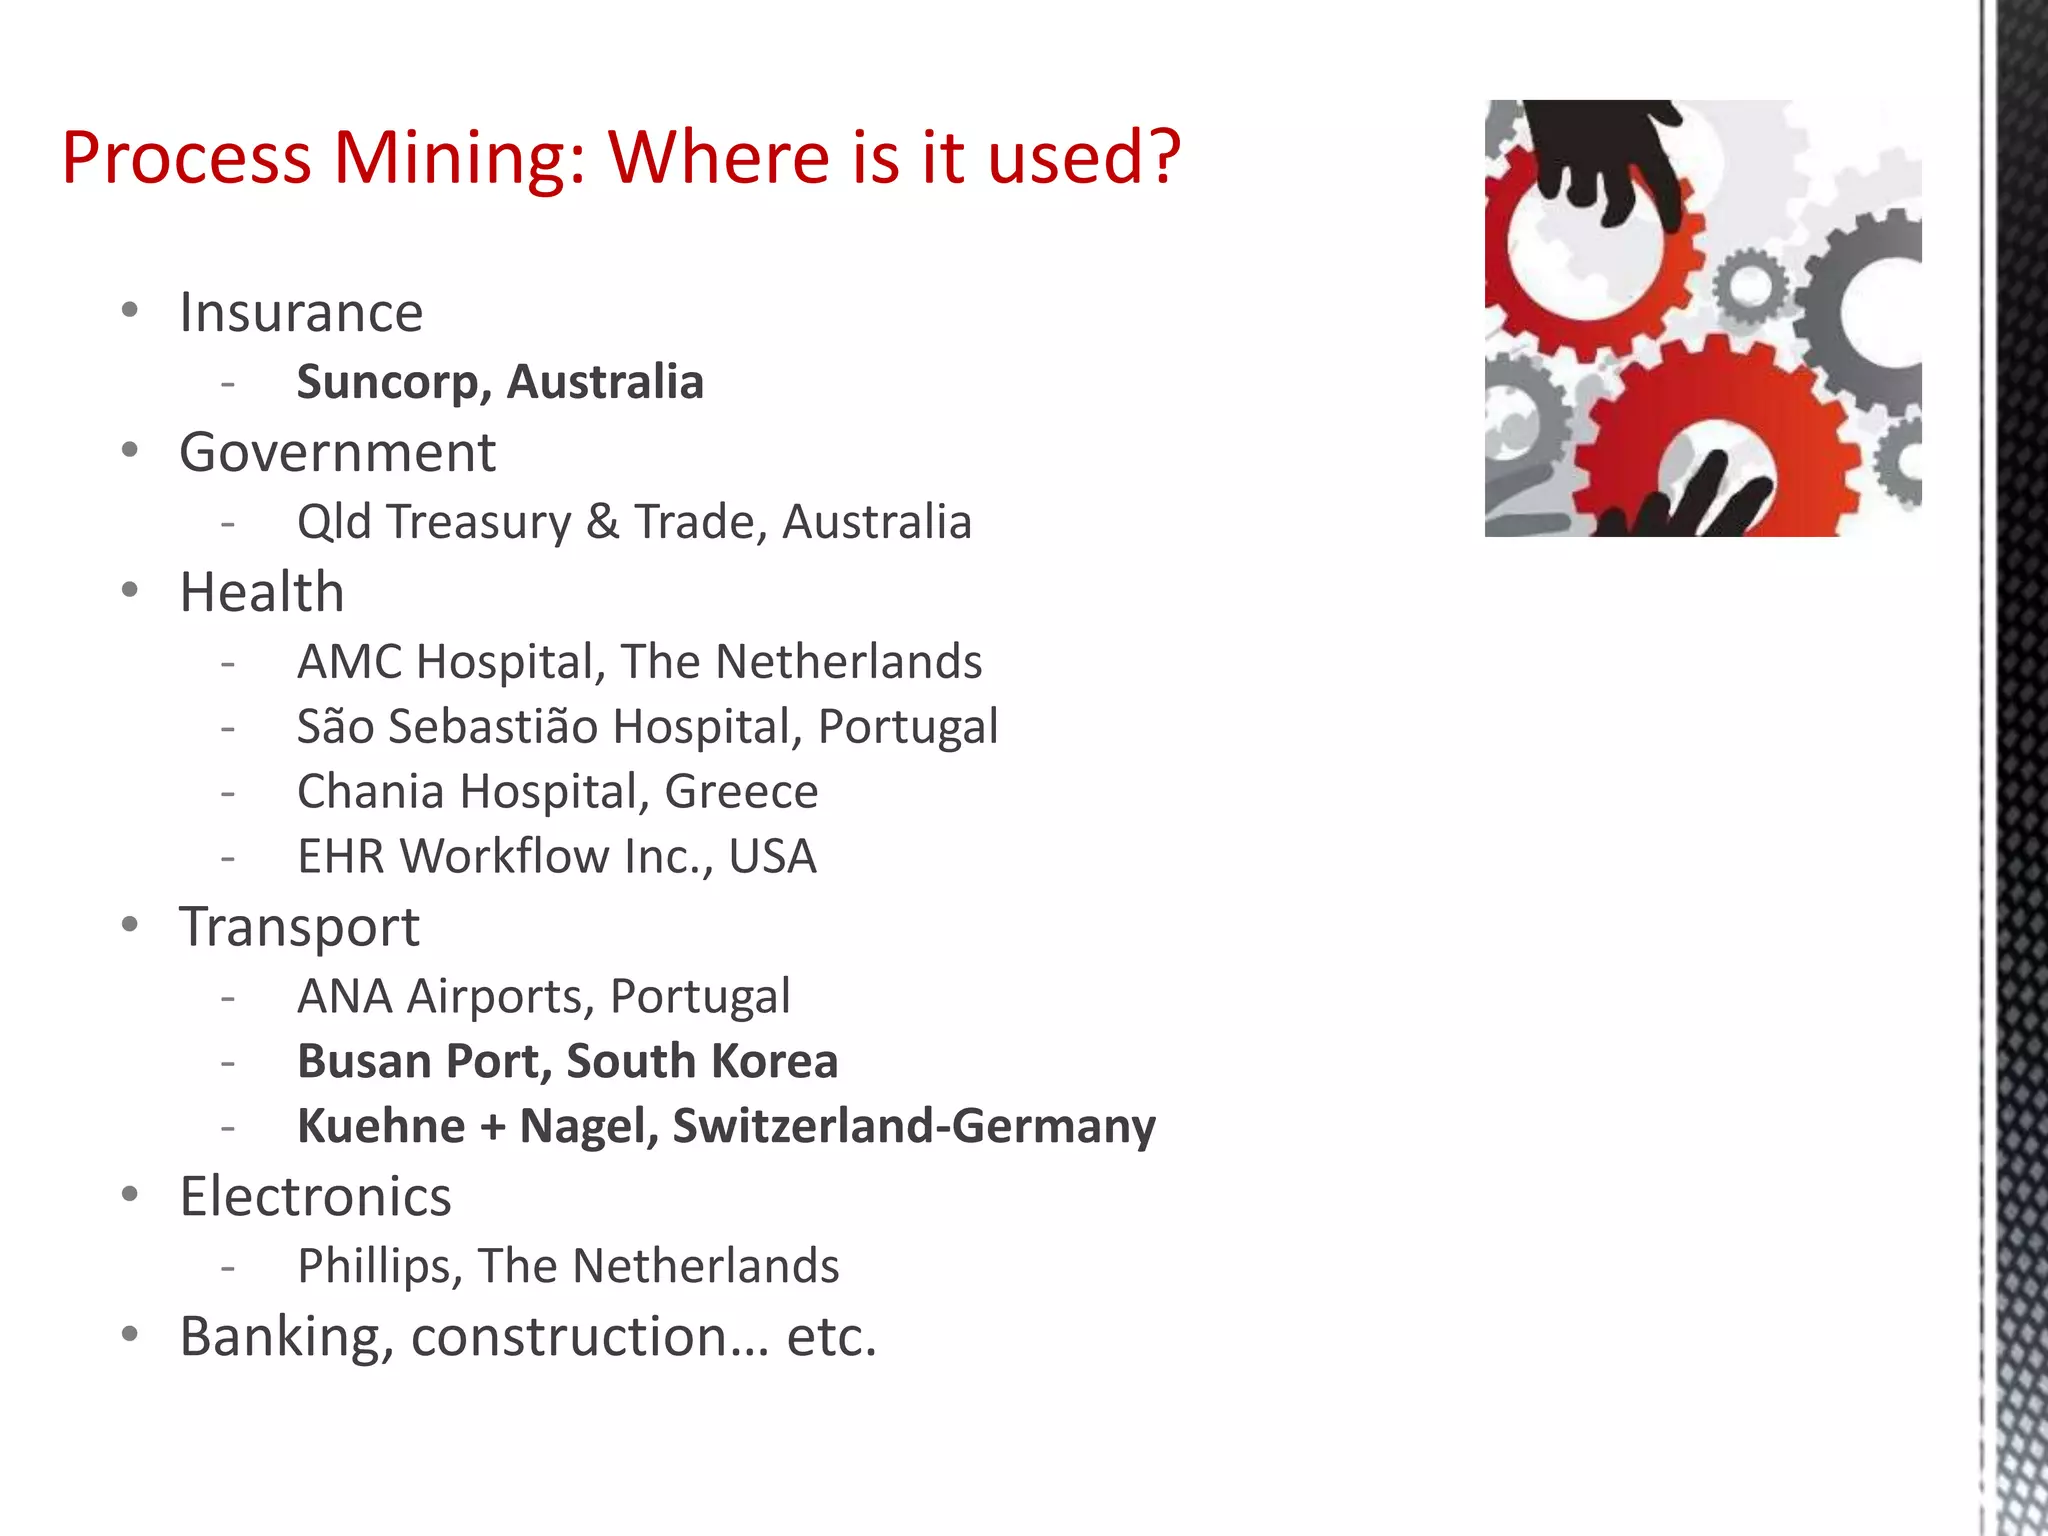

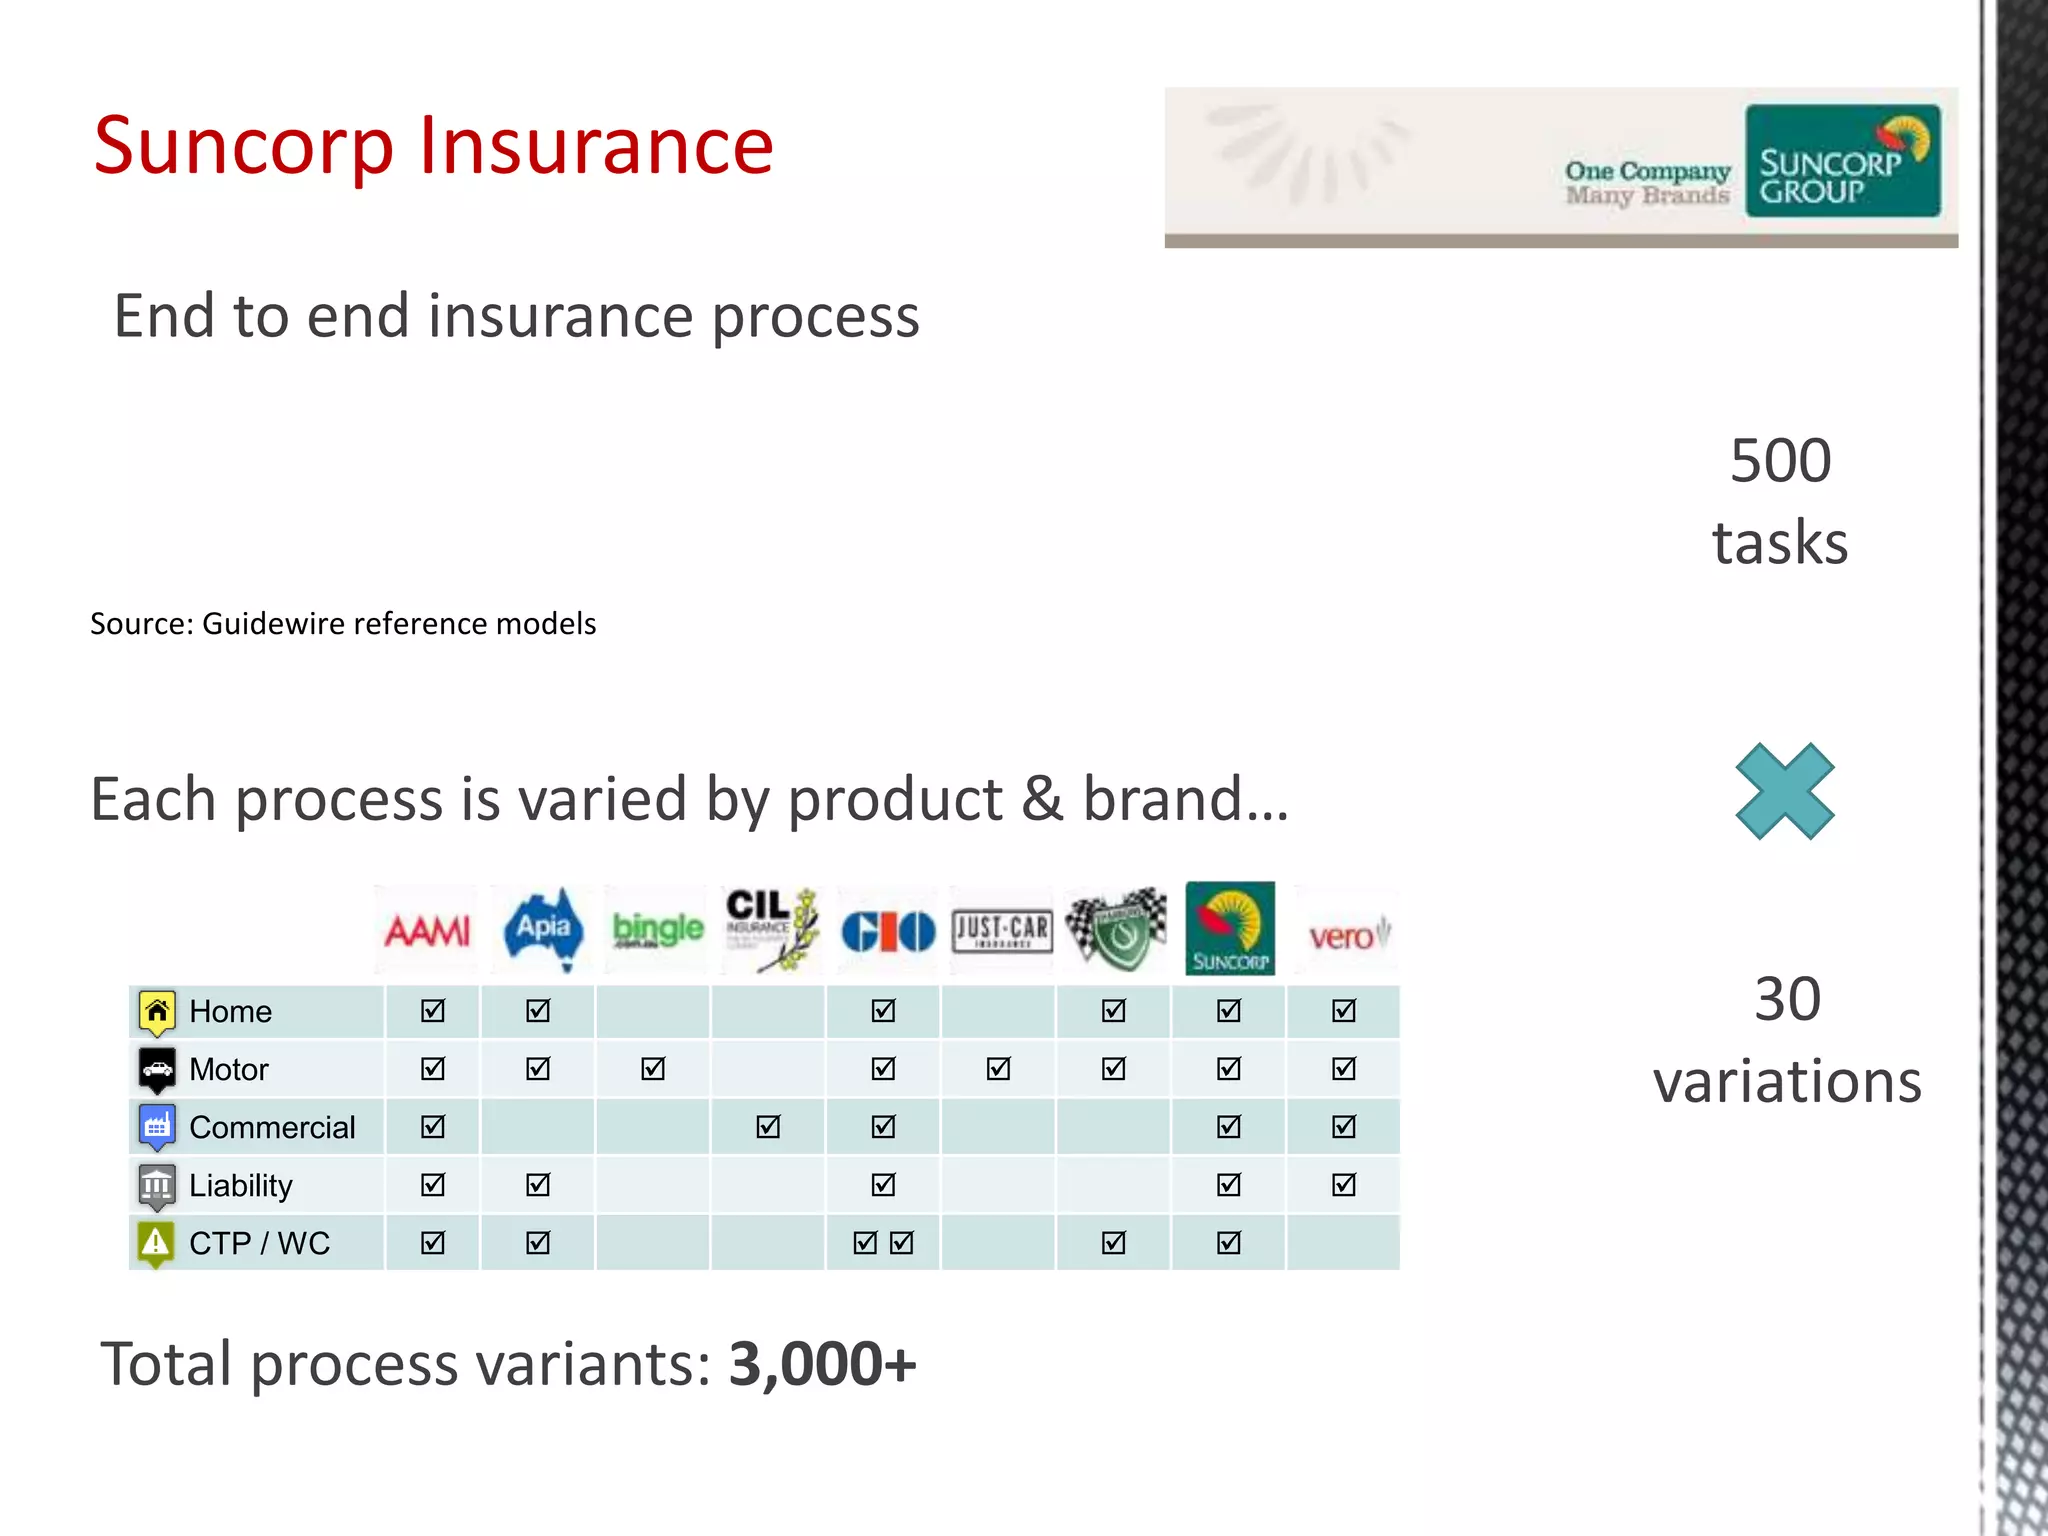


This document discusses process mining and predictive process monitoring, detailing types of dashboards used to monitor business processes and improve performance. It outlines methodologies for data collection and analysis, and presents case studies illustrating the application of process mining in various industries such as insurance and healthcare. Additionally, it introduces predictive monitoring techniques to forecast process outcomes and improve decision-making.