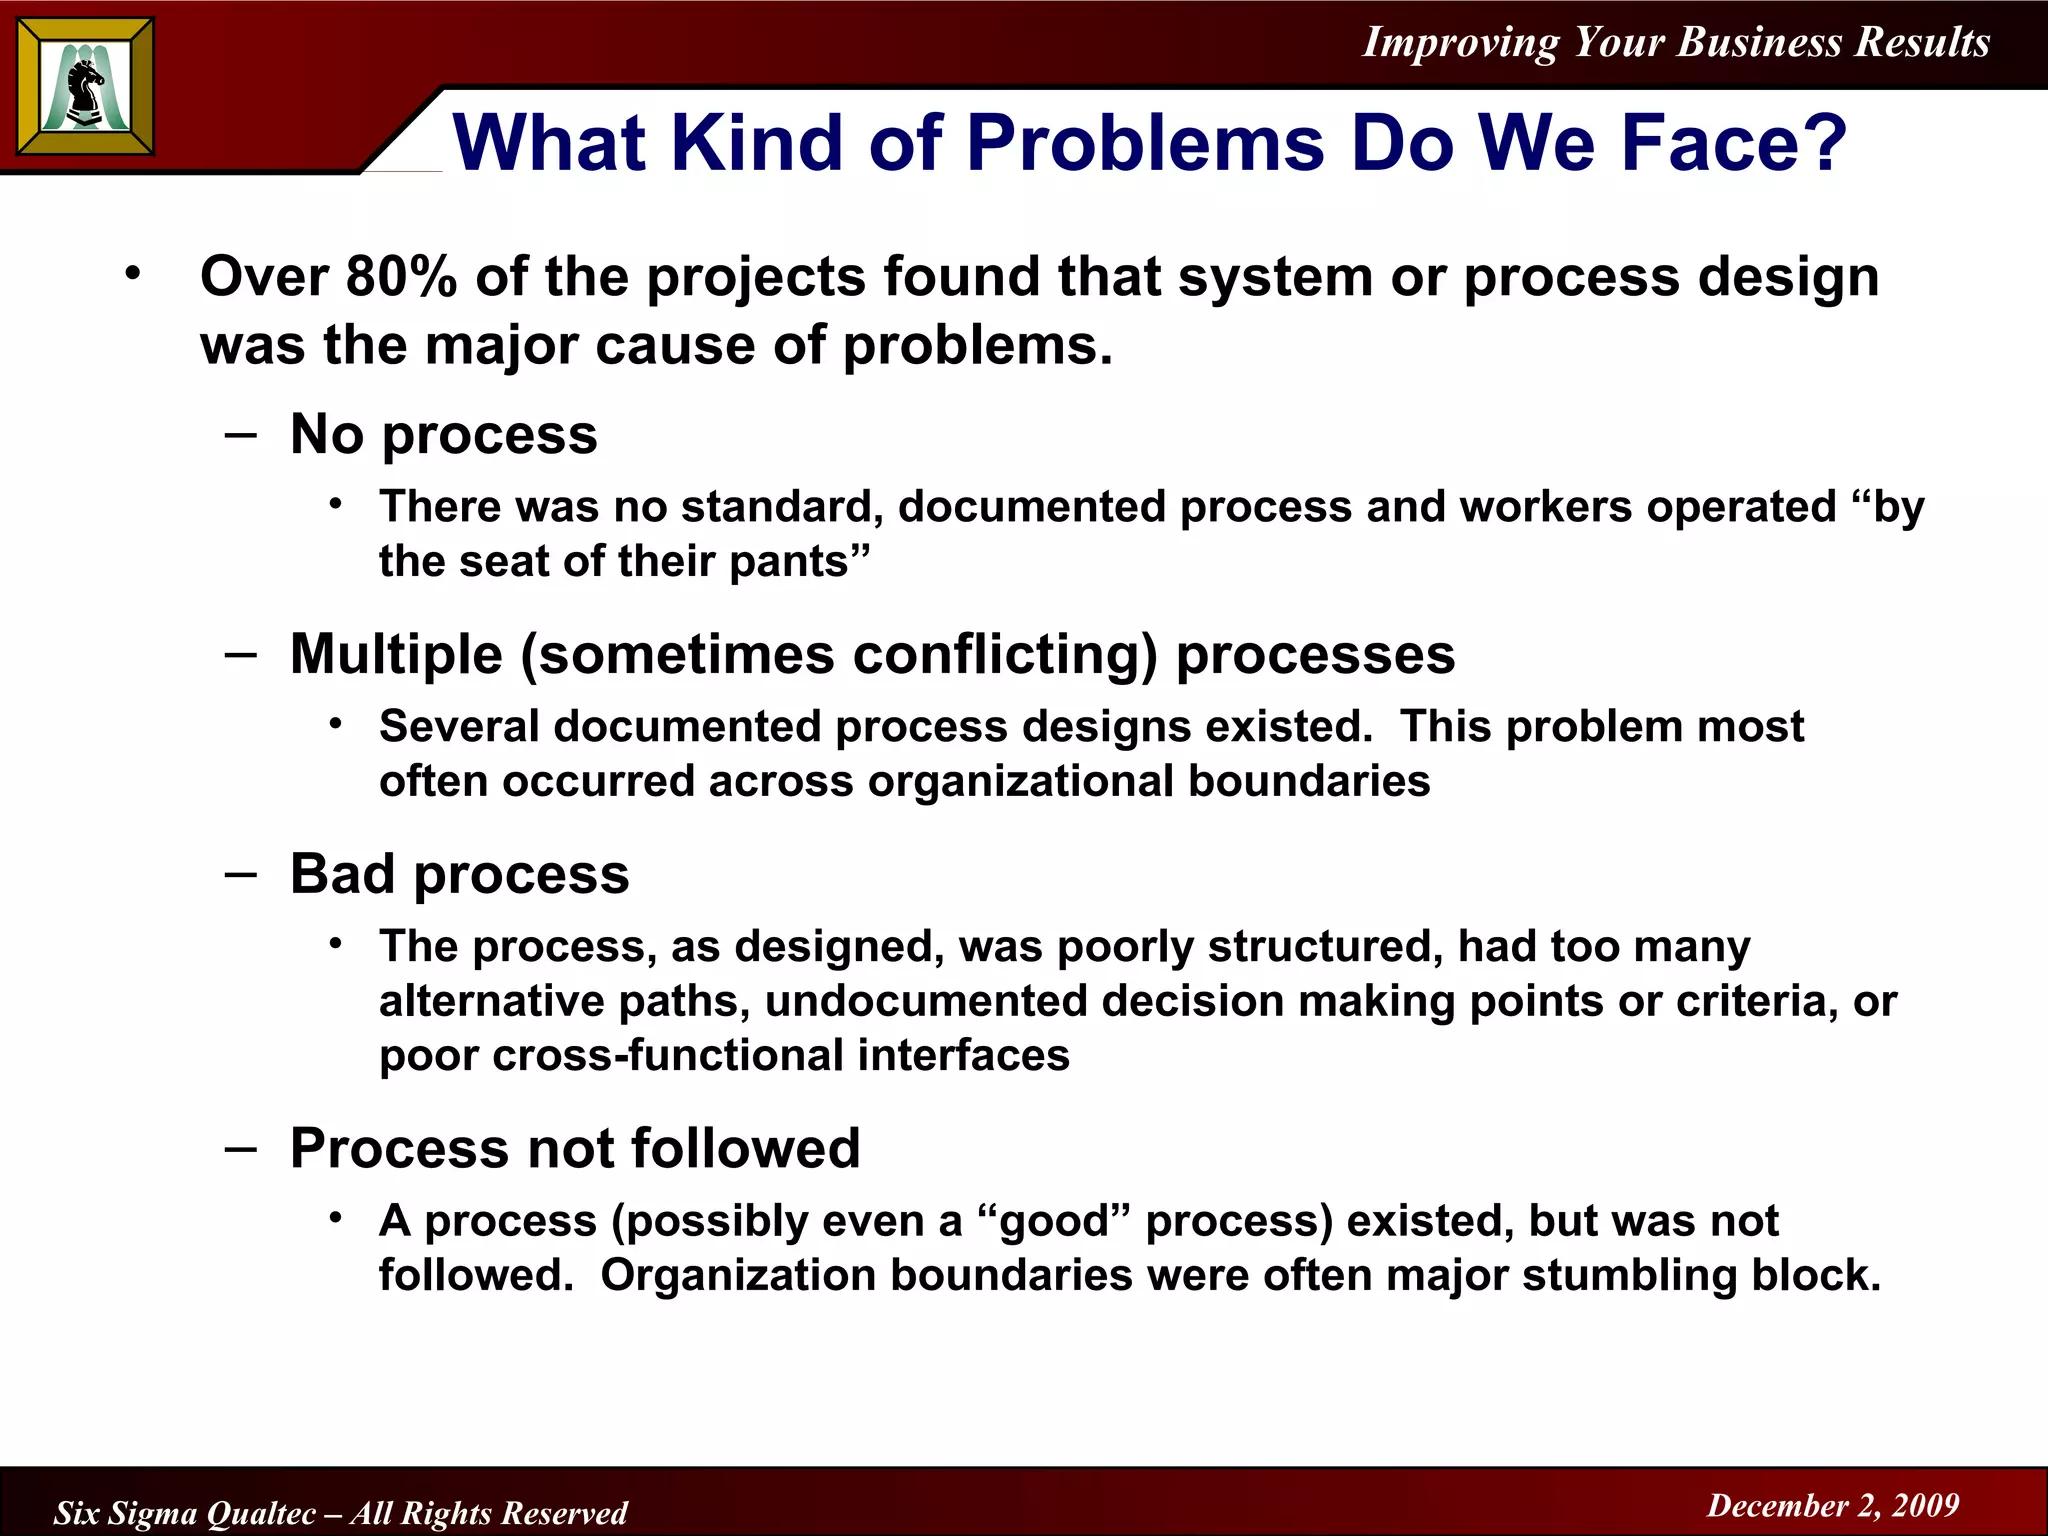
1. Transactional Black Belts often face different challenges than manufacturing Black Belts as processes are less defined and changes are harder to reverse in human-centered environments.
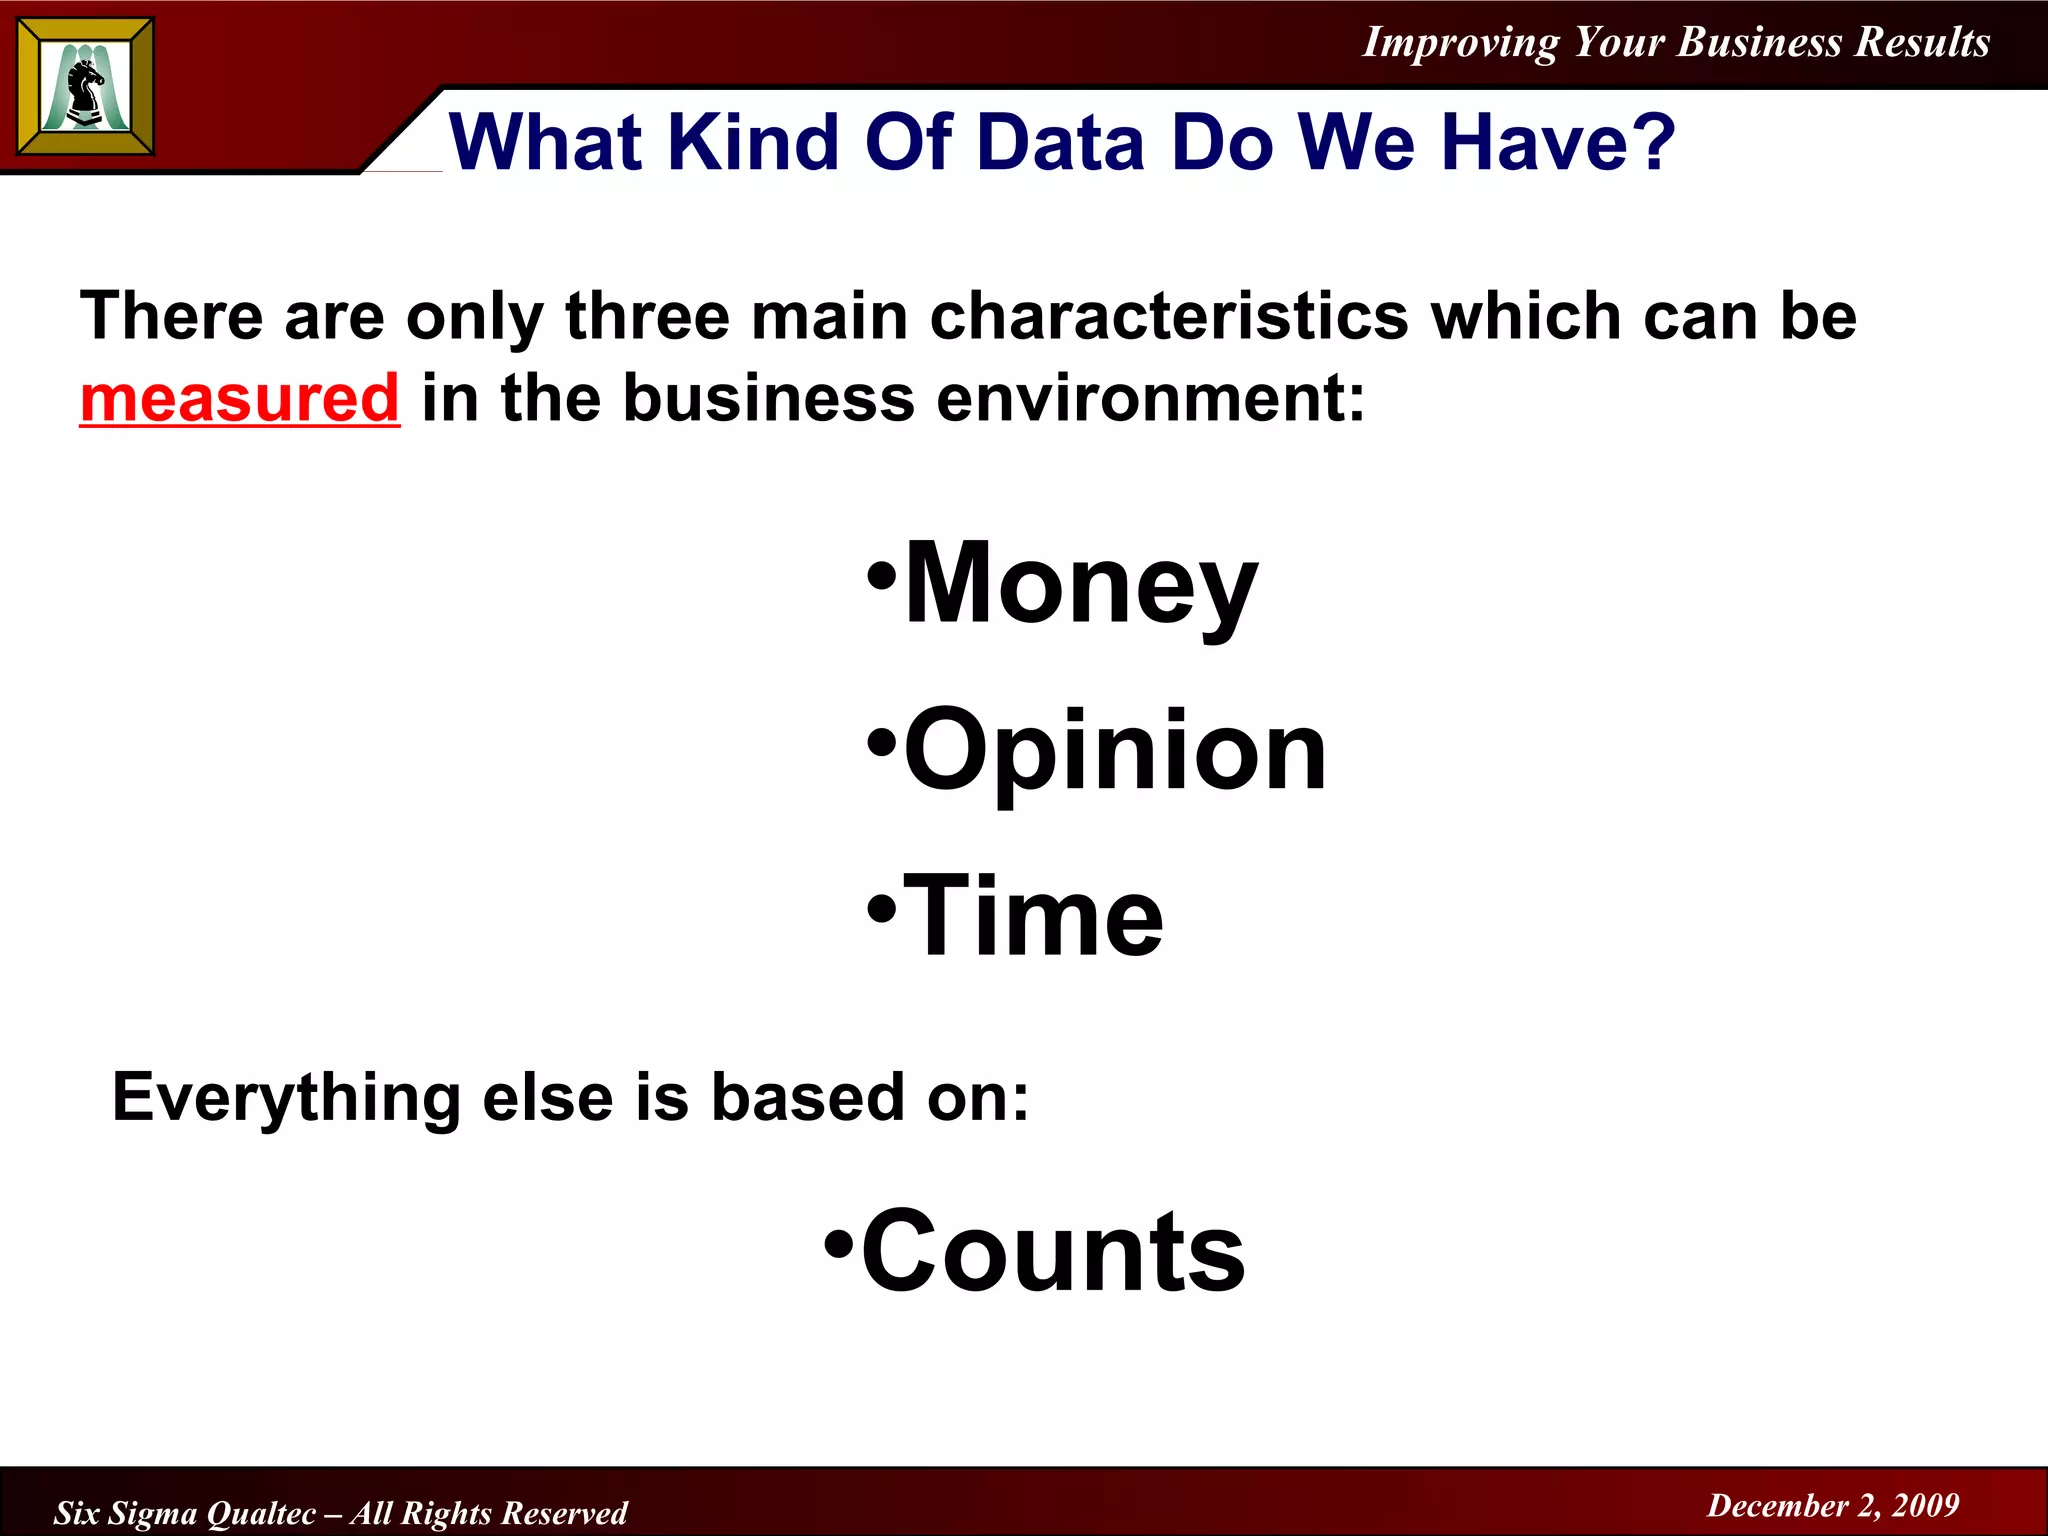
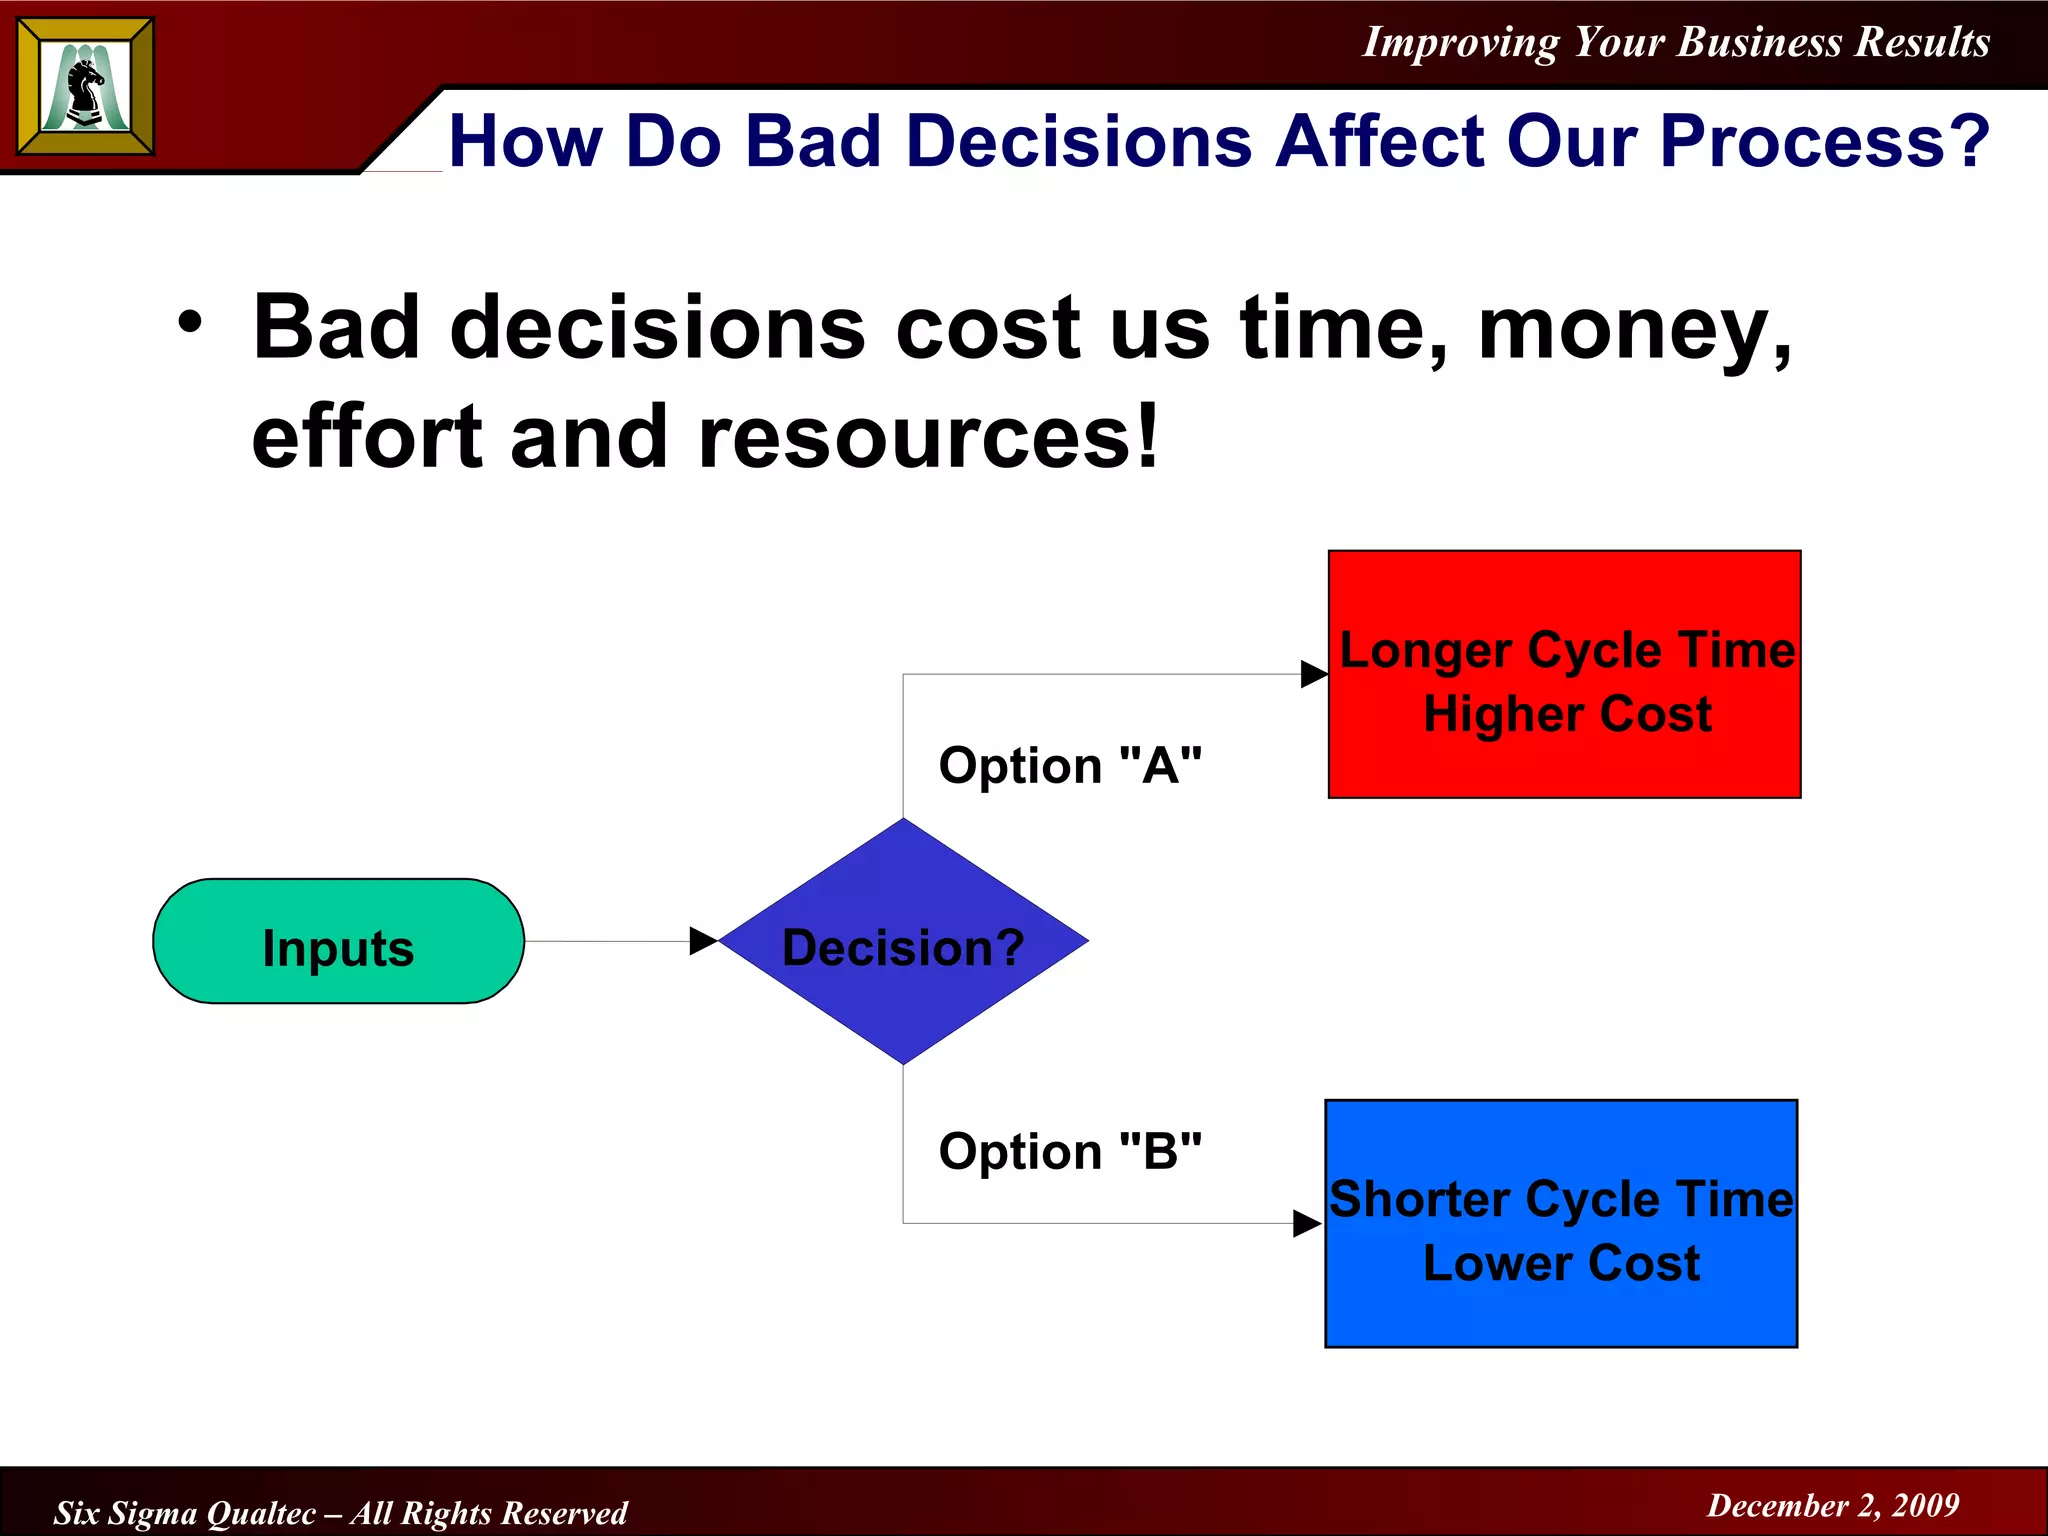
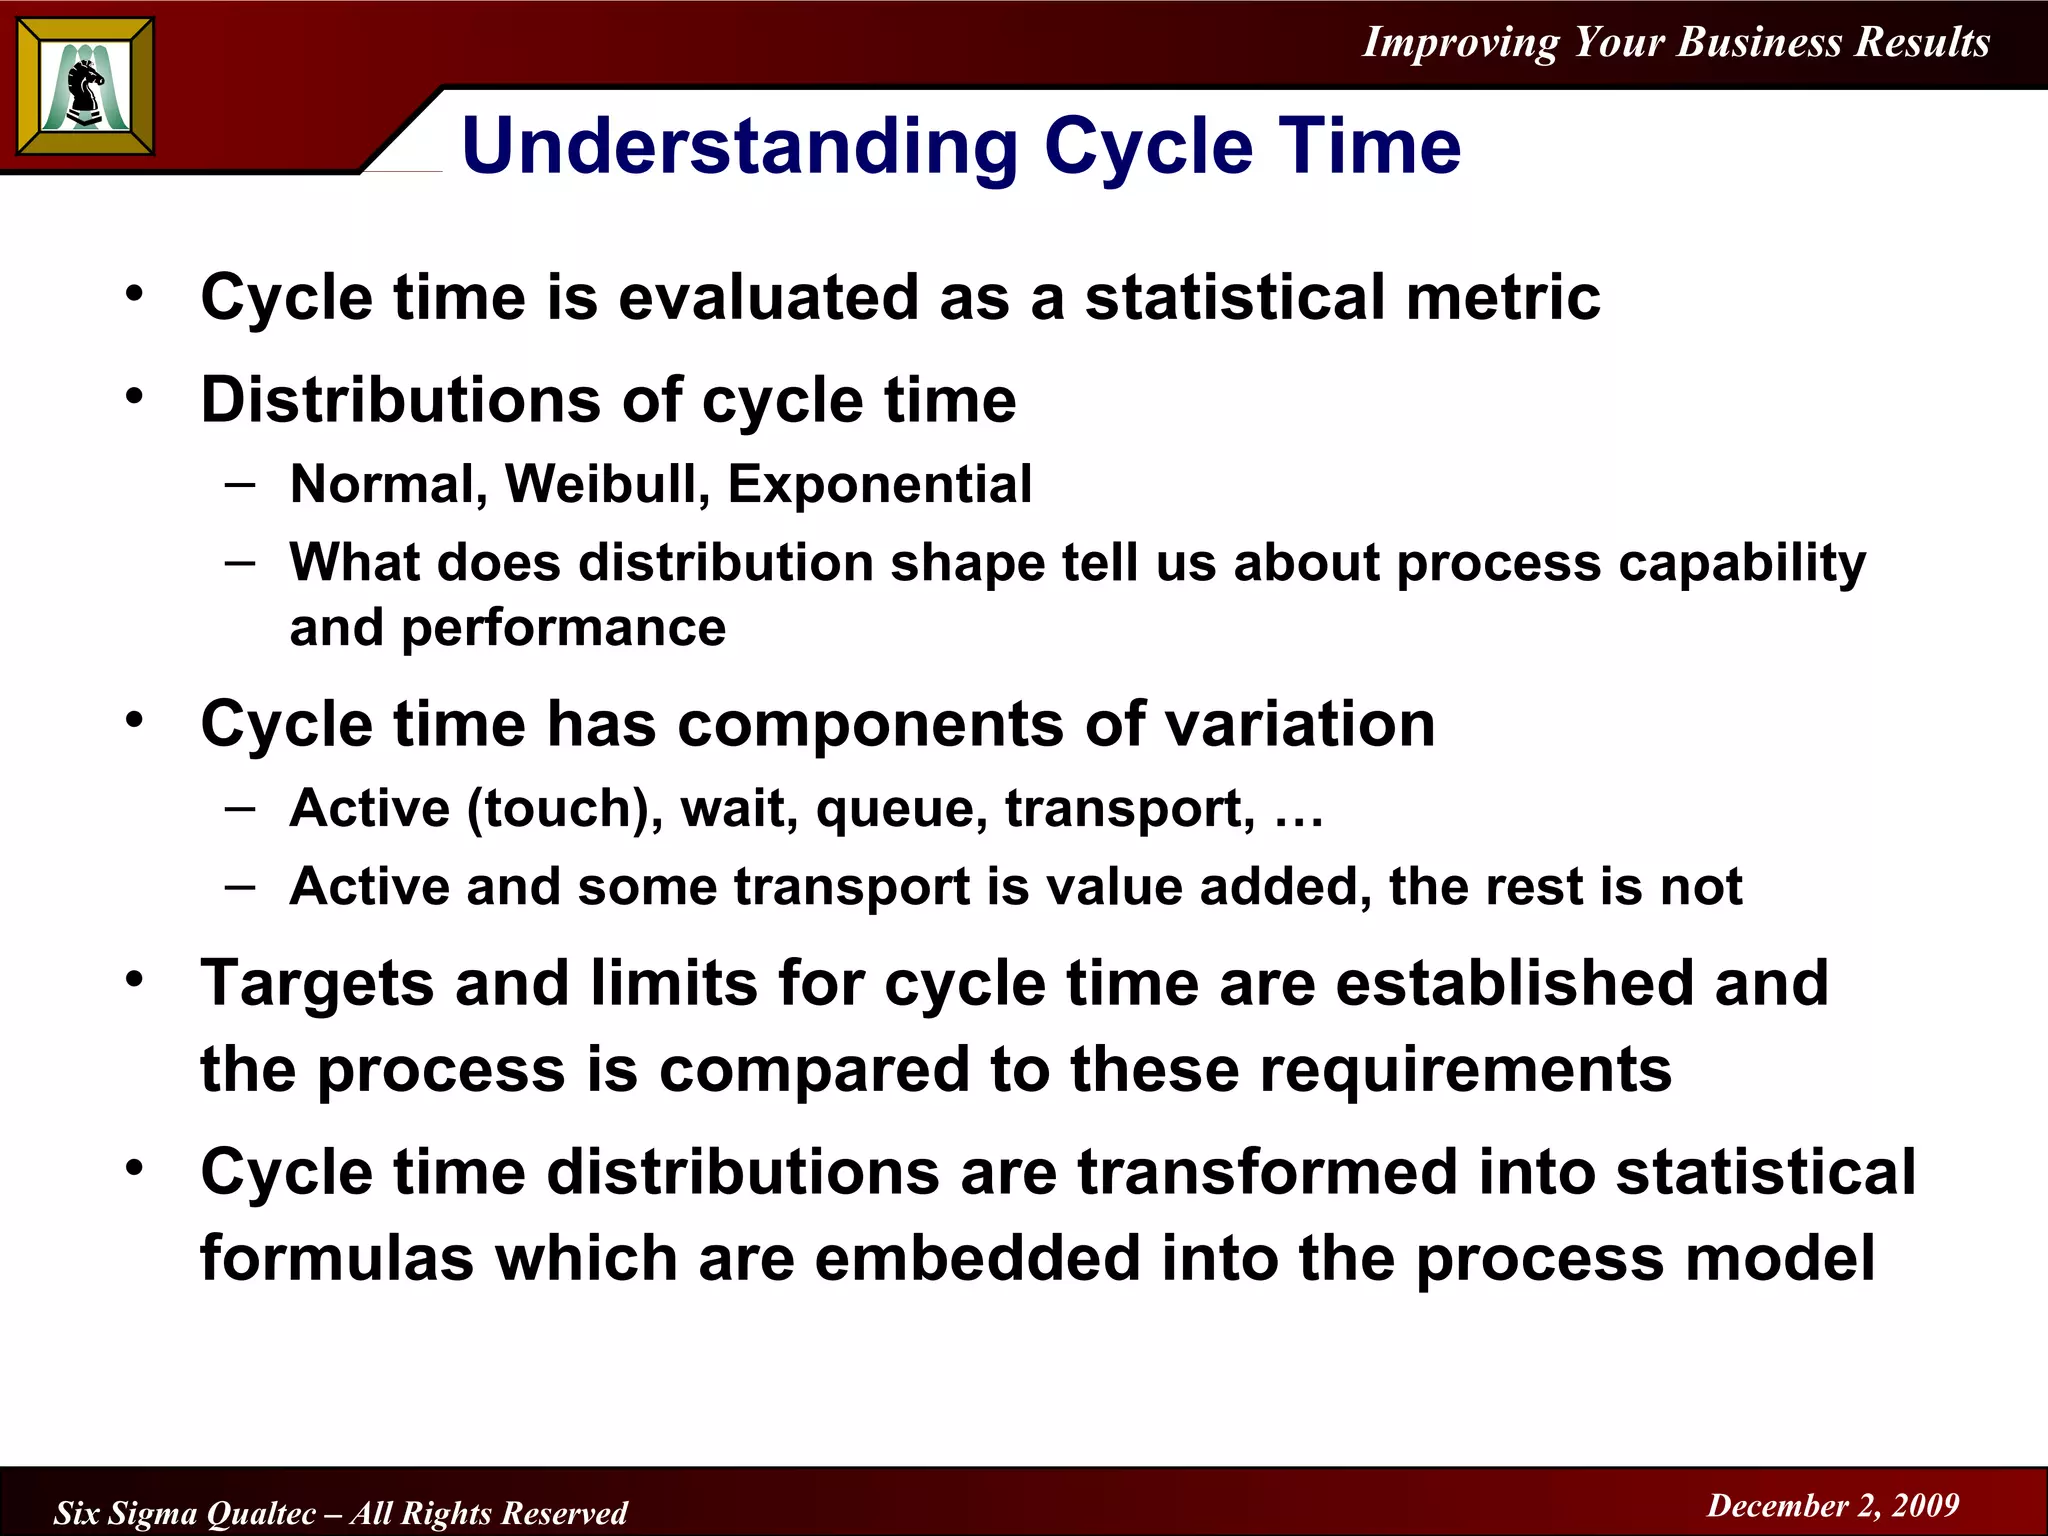
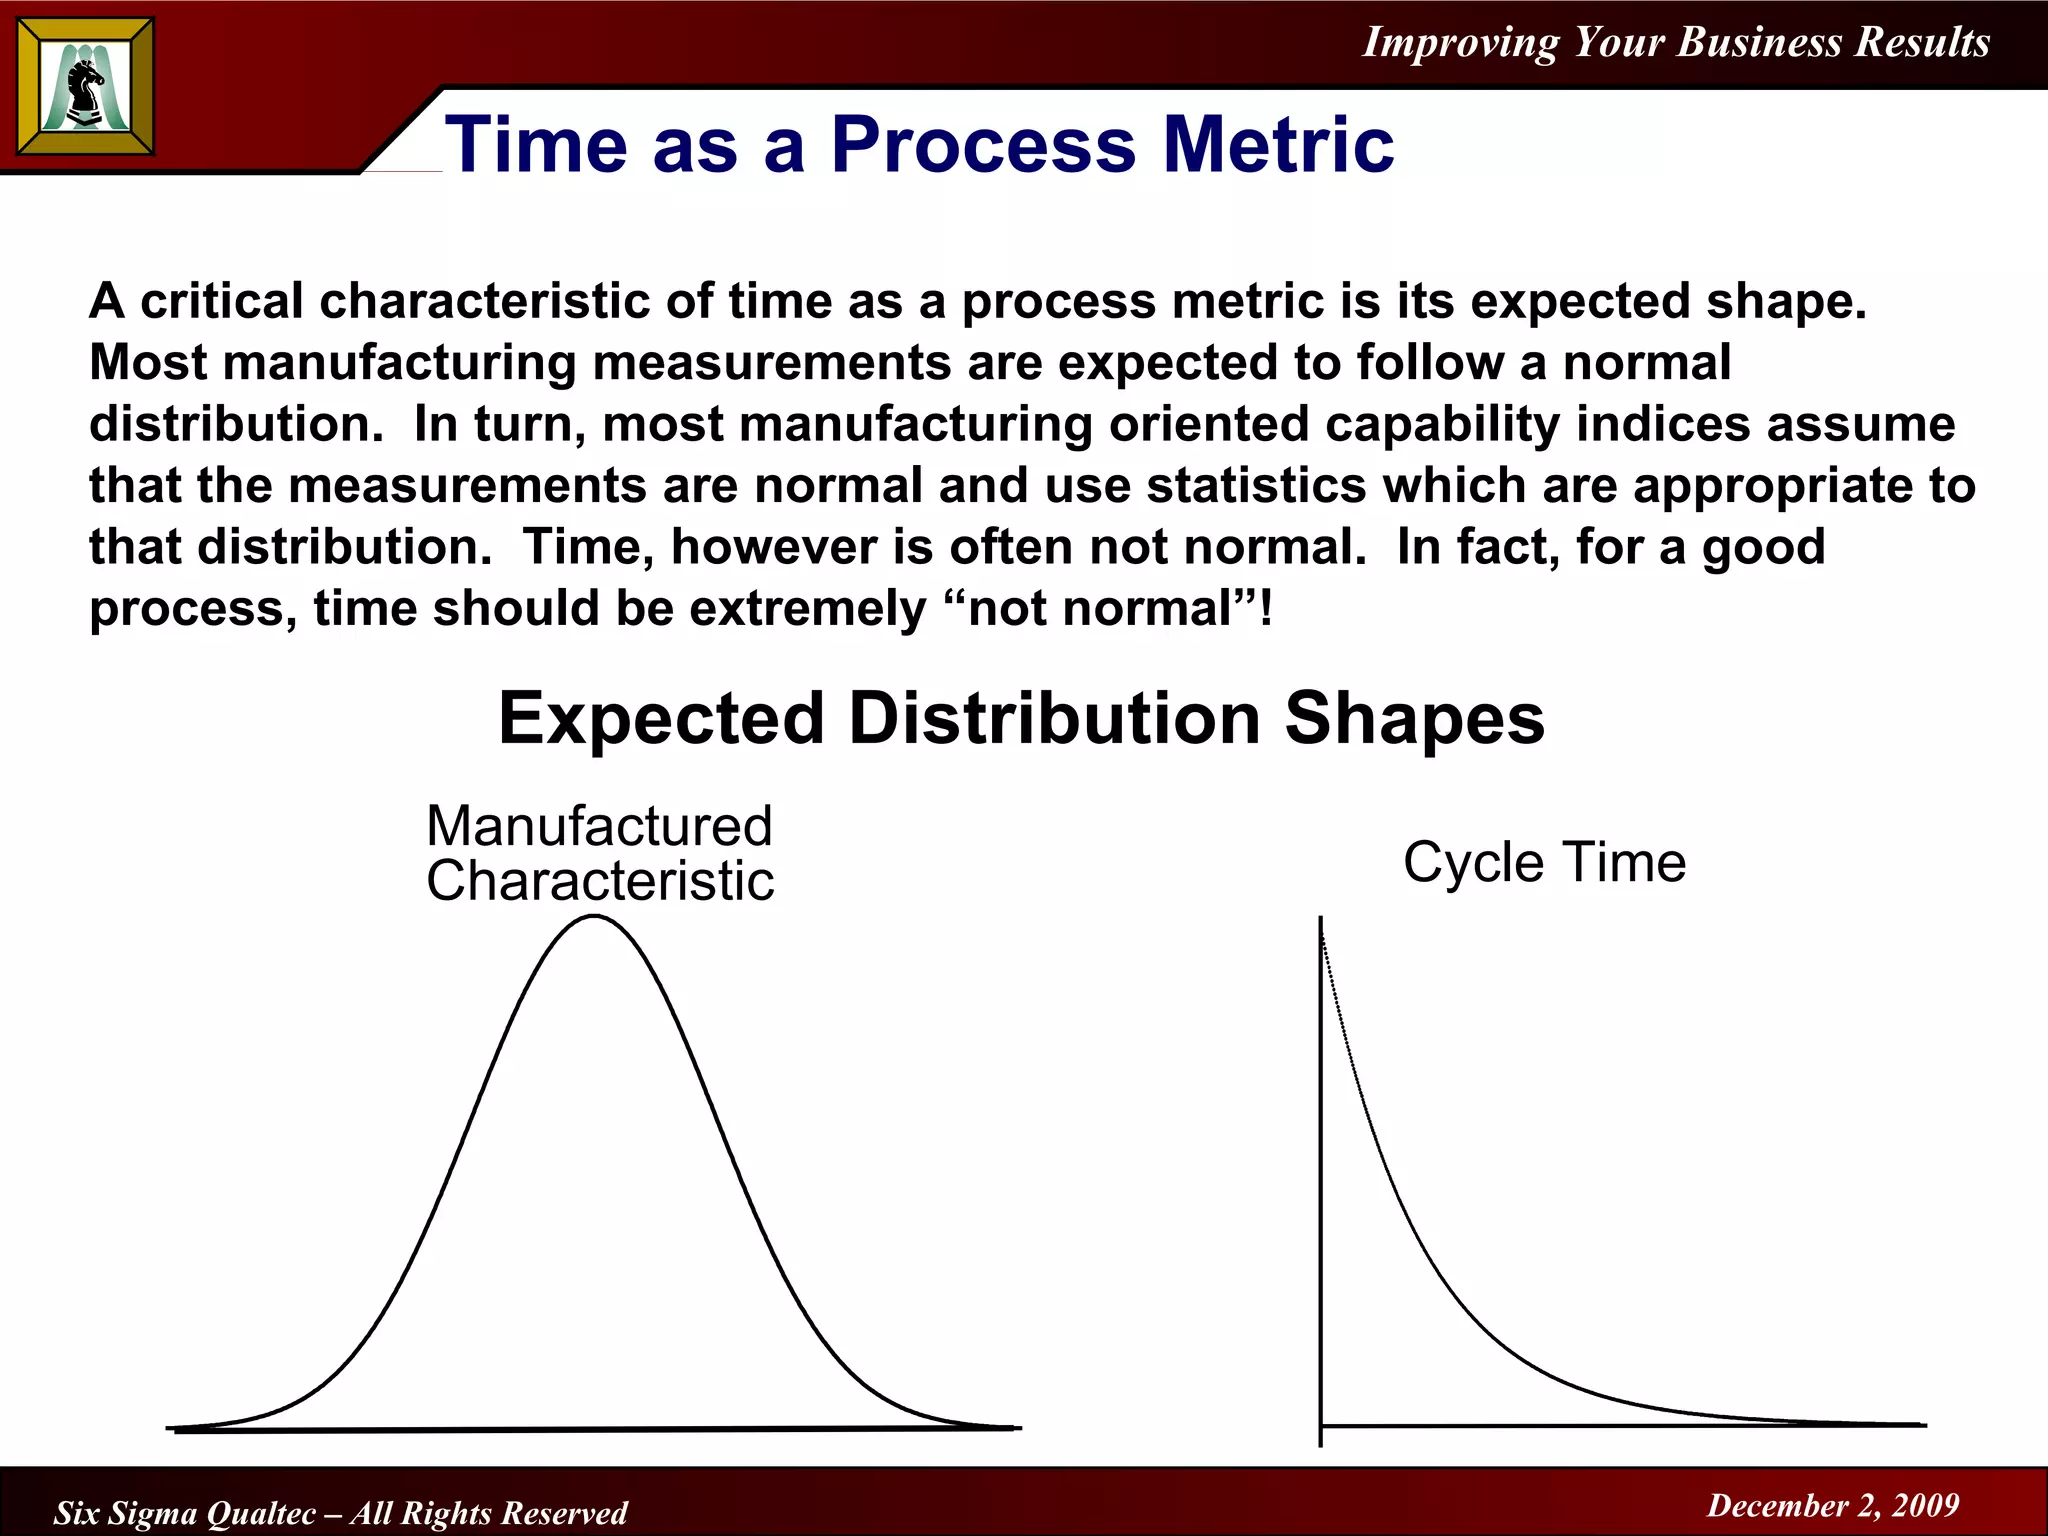
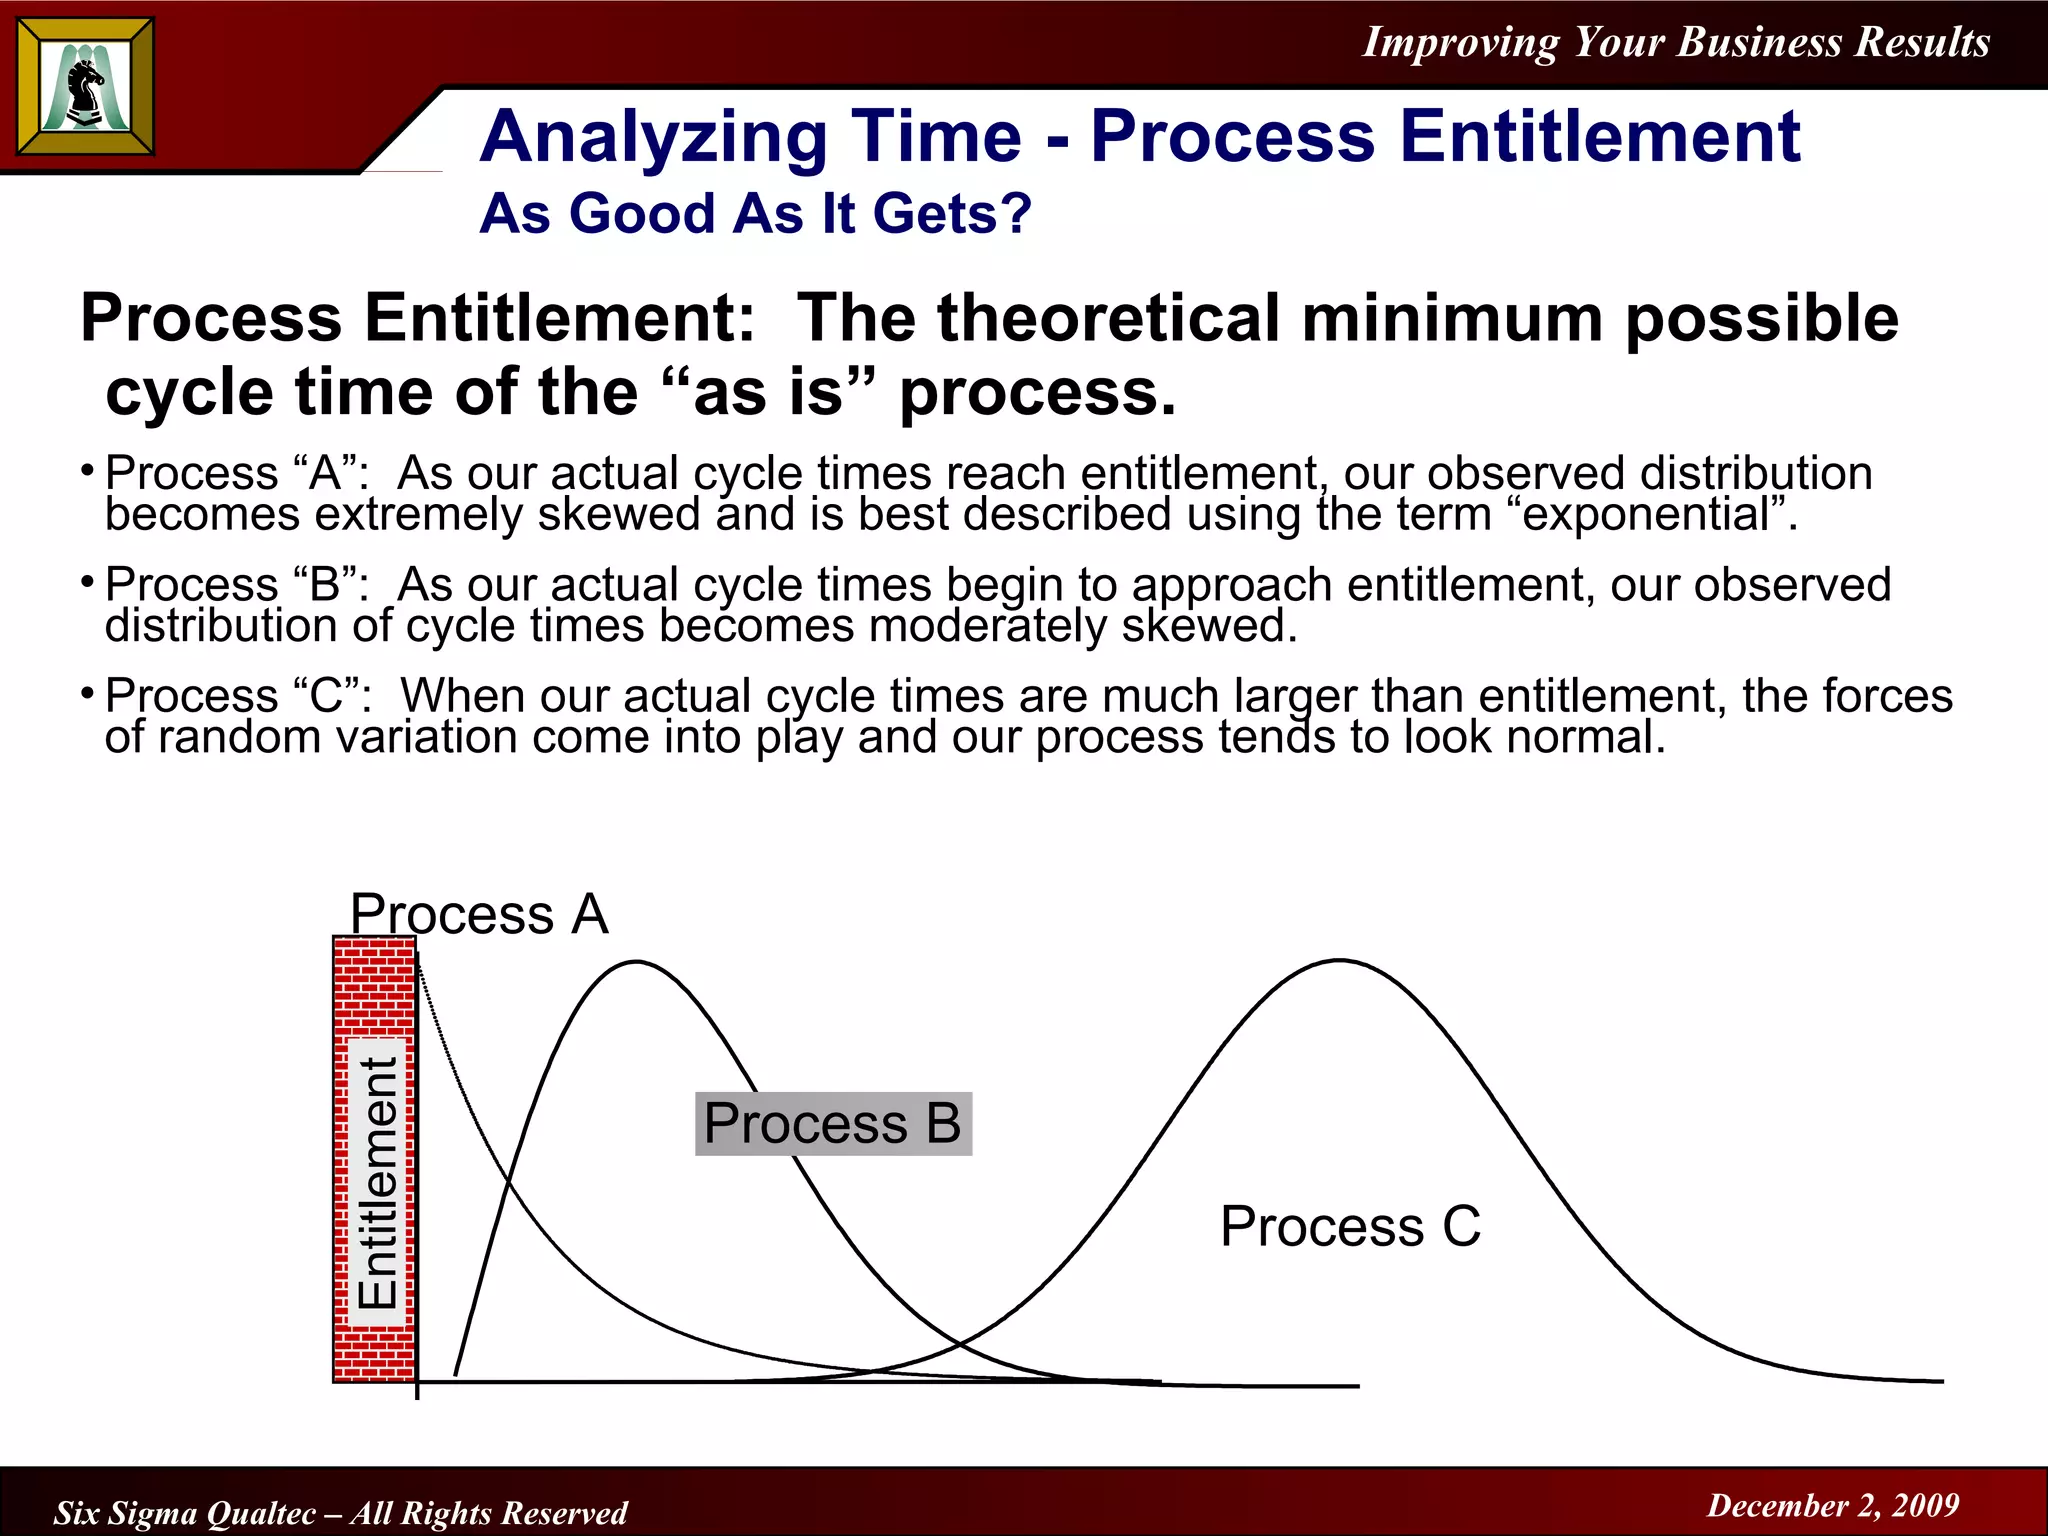
2. A key difference is that cycle time is a more useful overall measure than defect count for selecting projects in service/transaction environments where establishing a baseline process is often needed.
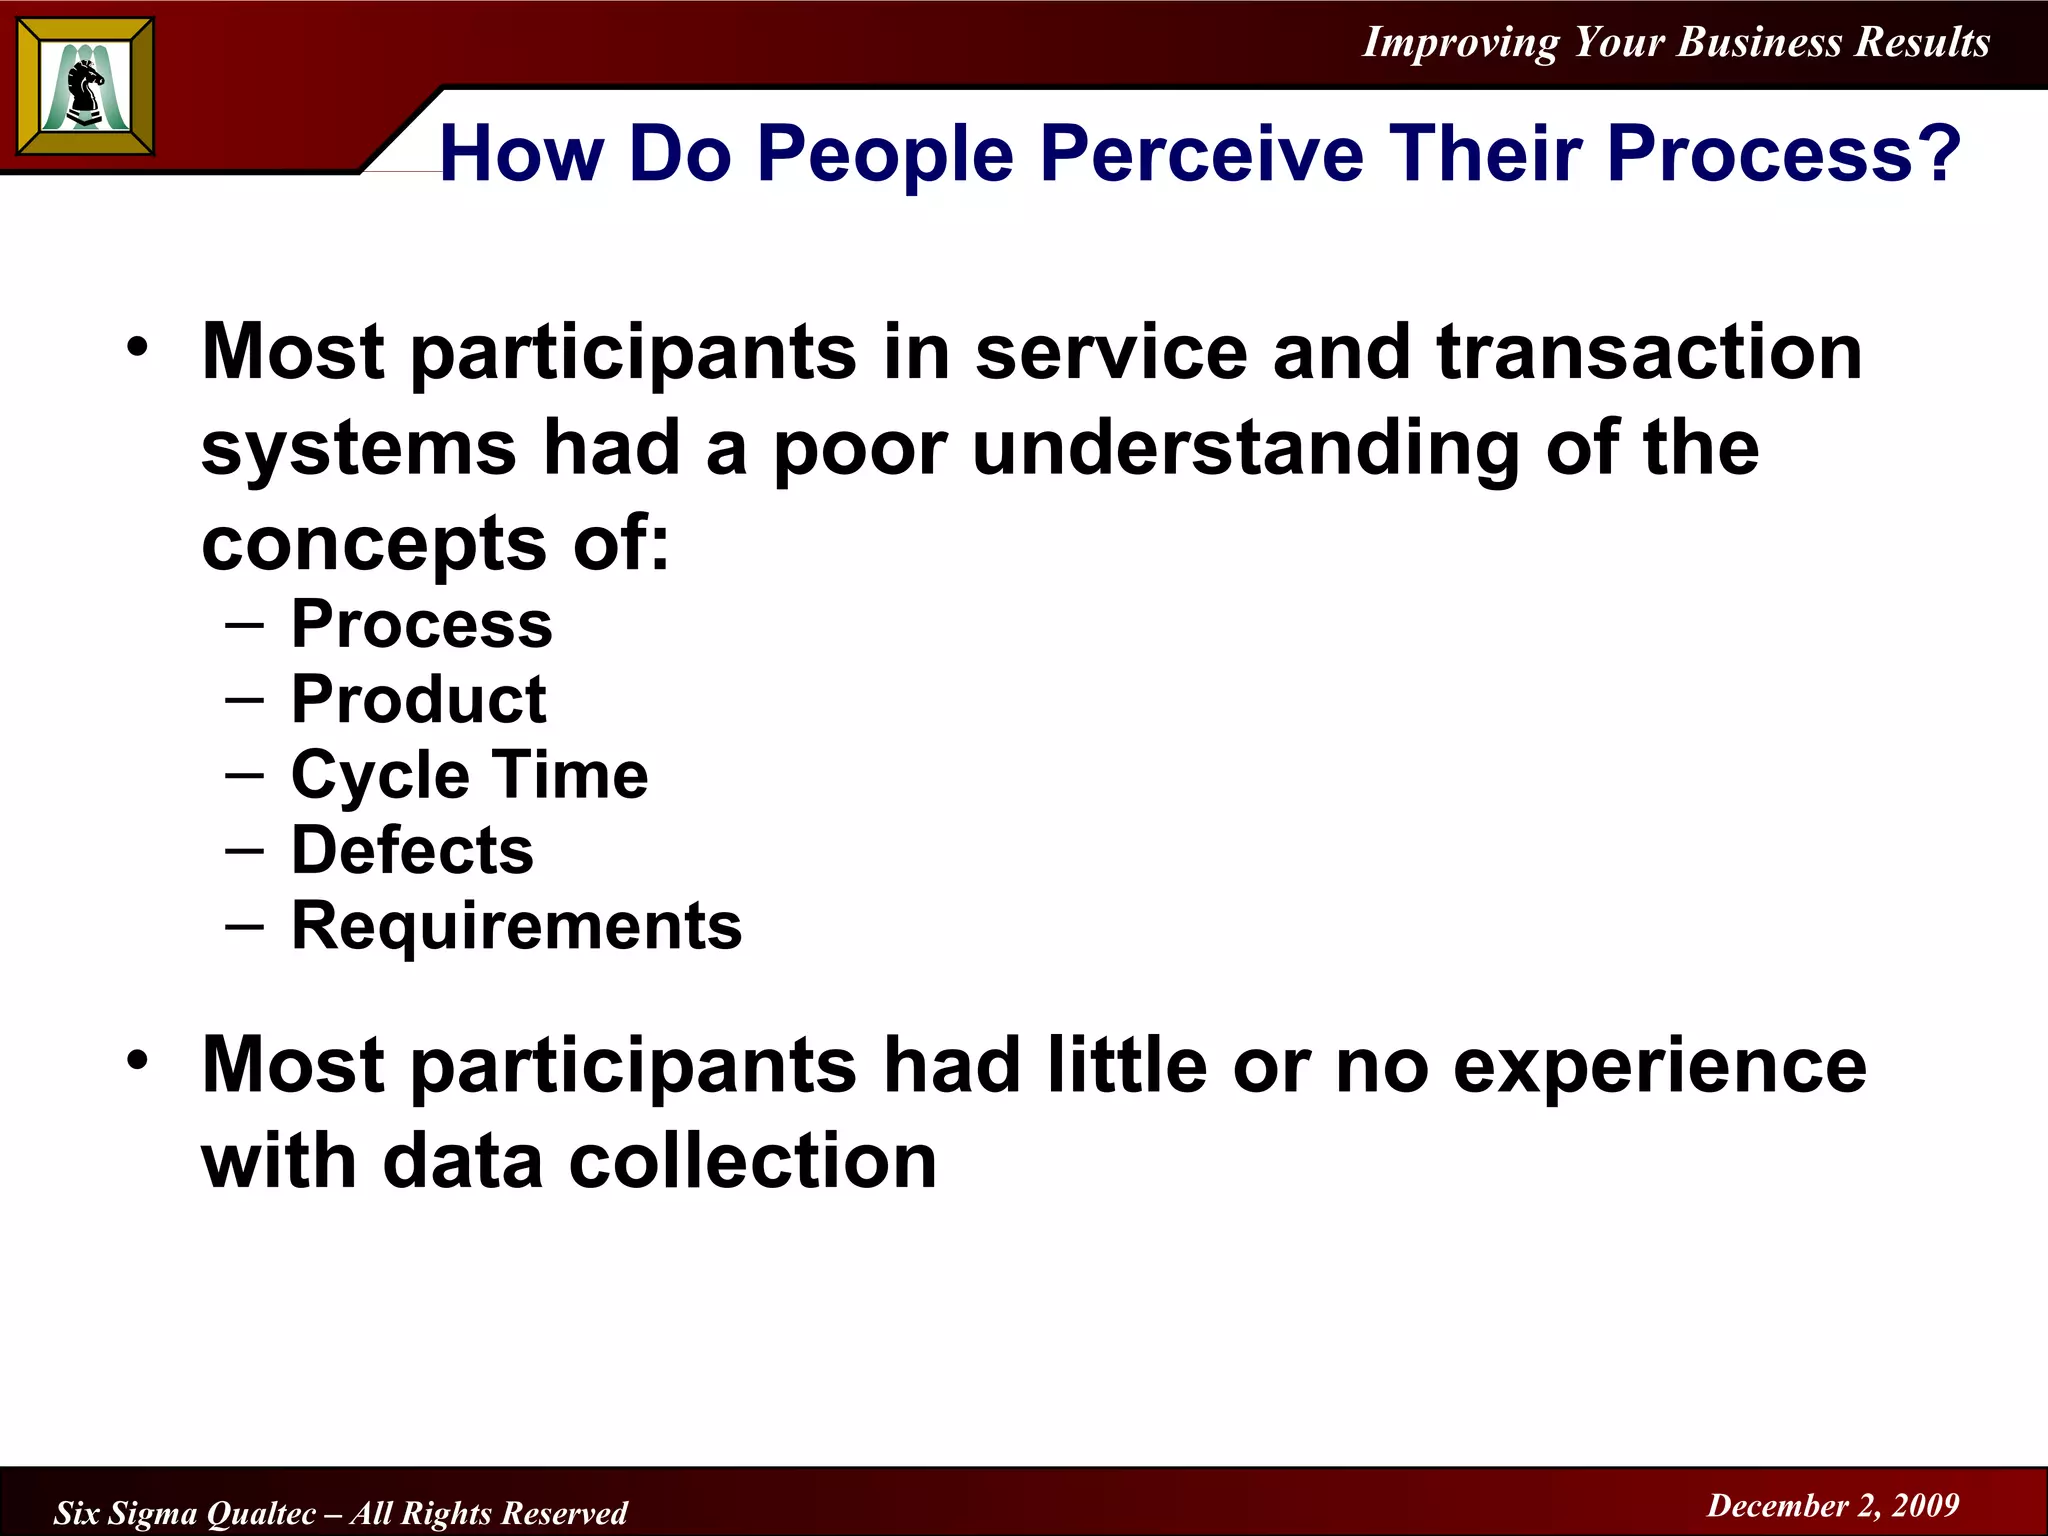
3. The training presented teaches how to model service and transaction processes, understand decision-making reliability, measure and improve cycle time, and manage change to achieve greater process efficiency.