Download to read offline

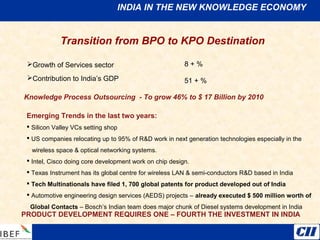
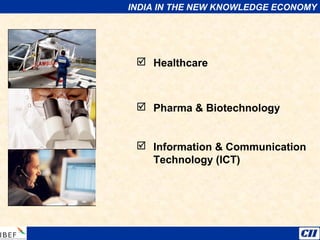

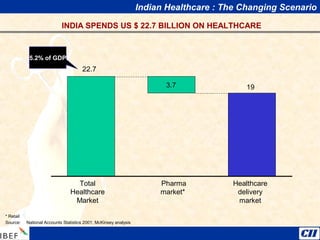


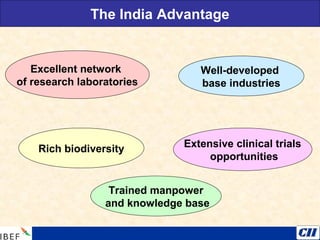
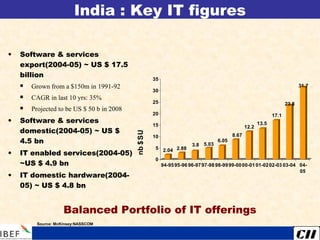
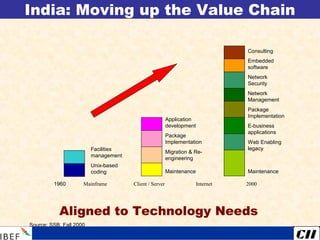


India is transitioning to a knowledge economy, with growth in knowledge process outsourcing (KPO) expected to reach $17 billion by 2010. The healthcare, pharmaceutical, biotechnology, and information and communication technology sectors are emerging as growth industries. India offers a highly skilled, low-cost workforce for product development and research and development activities, with investments in these sectors requiring one-fourth the funding as in other countries.


