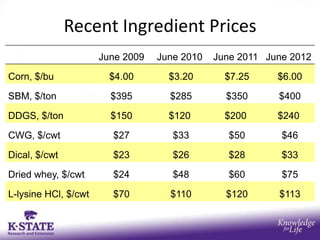
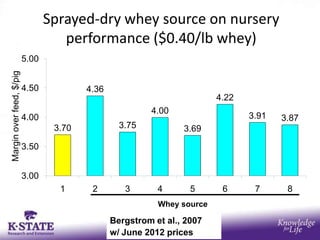
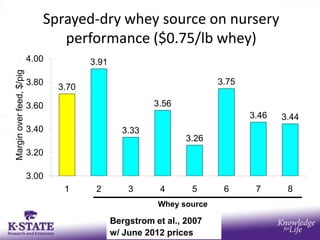
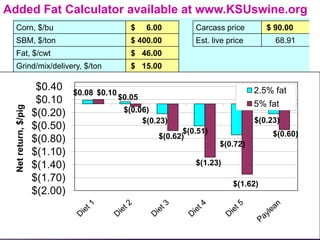
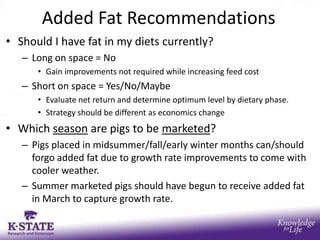
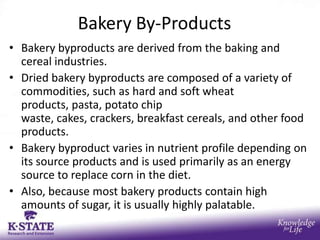
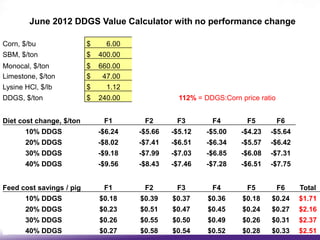
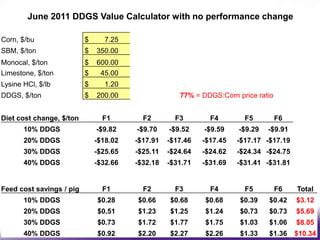
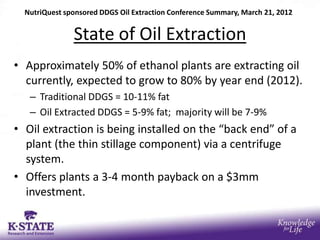
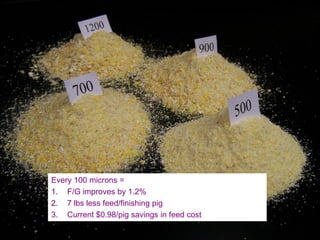
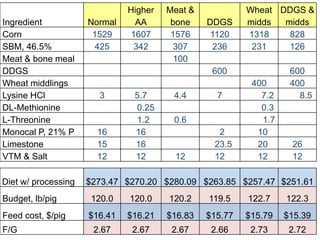
Ingredient Cost Update


Joel DeRouchey, Mike Tokach, Bob Goodband, Steve Dritz,
                   and Jim Nelssen


             WWW.KSUswine.org
Presentation Outline
• Ingredients
   – Spray Dried Whey (lactose sources)
   – Added liquid fat
   – Bakery by-products
   – DDGS
• Feed processing and feeder type
• Current diet cost examples
Recent Ingredient Prices
                      June 2009   June 2010   June 2011 June 2012

Corn, $/bu              $4.00       $3.20       $7.25     $6.00

SBM, $/ton              $395        $285        $350      $400

DDGS, $/ton             $150        $120        $200      $240

CWG, $/cwt              $27          $33         $50       $46

Dical, $/cwt            $23          $26         $28       $33

Dried whey, $/cwt       $24          $48         $60       $75

L-lysine HCl, $/cwt     $70         $110        $120      $113
Sprayed-dry whey source on nursery
            performance (Day 5 to 19 after weaning)
          0.85                                                              SE = 0.03
                                                                            ab = P < 0.05
          0.80
                           0.77 b                                  0.77 b
          0.75                                     ab                               ab
                                               0.72                          0.72               a
ADG, lb


                                           a                   a                         0.70
          0.70                      0.68                0.68
                  0.65 a
          0.65

          0.60

          0.55
                 Control    A        B         C      D             E         F           G
                                               Whey source

                                    Bergstrom et al., 2007
Sprayed-dry whey source on nursery
                                    performance ($0.40/lb whey)
                          5.00
Margin over feed, $/pig


                          4.50           4.36
                                                                         4.22
                                                         4.00
                          4.00                                                  3.91   3.87
                                  3.70            3.75           3.69

                          3.50


                          3.00
                                   1      2        3       4       5      6      7      8
                                                           Whey source

                                                Bergstrom et al., 2007
                                                w/ June 2012 prices
Sprayed-dry whey source on nursery
                                performance ($0.75/lb whey)
                          4.00          3.91
Margin over feed, $/pig


                          3.80                                          3.75
                                 3.70

                          3.60                           3.56
                                                                               3.46   3.44
                          3.40                   3.33
                                                                 3.26
                          3.20

                          3.00
                                  1      2         3       4      5      6      7      8
                                                          Whey source

                                               Bergstrom et al., 2007
                                               w/ June 2012 prices
Added Fat Calculator available at www.KSUswine.org
  Corn, $/bu                                     $    6.00        Carcass price        $ 90.00
  SBM, $/ton                                     $ 400.00         Est. live price        68.91
  Fat, $/cwt                                     $ 46.00
  Grind/mix/delivery, $/ton                      $ 15.00

                       $0.40    $0.08 $0.10                                         2.5% fat
                       $0.10                  $0.05
                                                                                    5% fat
  Net return, $/pig


                      $(0.20)                  $(0.06)
                                                    $(0.23)                         $(0.23)
                      $(0.50)                                  $(0.51)
                                                         $(0.62)                         $(0.60)
                      $(0.80)                                            $(0.72)
                      $(1.10)
                      $(1.40)                                     $(1.23)
                      $(1.70)                                                $(1.62)
                      $(2.00)
Added Fat Recommendations
• Should I have fat in my diets currently?
   – Long on space = No
      • Gain improvements not required while increasing feed cost
   – Short on space = Yes/No/Maybe
      • Evaluate net return and determine optimum level by dietary phase.
      • Strategy should be different as economics change
• Which season are pigs to be marketed?
   – Pigs placed in midsummer/fall/early winter months can/should
     forgo added fat due to growth rate improvements to come with
     cooler weather.
   – Summer marketed pigs should have begun to receive added fat
     in March to capture growth rate.
Using added fat for dust control
• A common request is to reduce dust by using 1%
  added fat (currently $0.46/lb)
  – F/G could improve by 0.04 from higher energy
  – ADG very minor to have measurable effect
• Current feed cost increase (F/G improvement
  accounted for) for dust control in finishing is
  $1.23 / pig from 50 to 250 lbs!
• Can not afford dust control in finishing diets
Bakery By-Products
• Bakery byproducts are derived from the baking and
  cereal industries.
• Dried bakery byproducts are composed of a variety of
  commodities, such as hard and soft wheat
  products, pasta, potato chip
  waste, cakes, crackers, breakfast cereals, and other food
  products.
• Bakery byproduct varies in nutrient profile depending on
  its source products and is used primarily as an energy
  source to replace corn in the diet.
• Also, because most bakery products contain high
  amounts of sugar, it is usually highly palatable.
Bakery By-Products
• Things to recognize:
• Bakery products can vary in fat content which directly
  affects the assigned energy value.
   – NRC, 1998
      • Bakery = 11.3% fat, 1,678 kcal/lb ME (+8% ME vs. corn)
      • Corn =    3.9% fat, 1,551 kcal/lb ME
• However, many bakery products contain lower levels of
  fat then past book values (7-10% is typical). Recent
  analysis from a Midwest commercial mill using bakery:
      • Bakery = 6.4% Fat, Calculated ME value was 92% of corn
June 2012 DDGS Value Calculator with no performance change

Corn, $/bu                $     6.00
SBM, $/ton                $   400.00
Monocal, $/ton            $   660.00
Limestone, $/ton          $    47.00
Lysine HCl, $/lb          $     1.12
DDGS, $/ton               $   240.00              112% = DDGS:Corn price ratio


Diet cost change, $/ton        F1       F2       F3        F4        F5          F6
       10% DDGS               -$6.24   -$5.66   -$5.12    -$5.00    -$4.23   -$5.64
       20% DDGS               -$8.02   -$7.41   -$6.51    -$6.34    -$5.57   -$6.42
       30% DDGS               -$9.18   -$7.99   -$7.03    -$6.85    -$6.08   -$7.31
       40% DDGS               -$9.56   -$8.43   -$7.46    -$7.28    -$6.51   -$7.75


Feed cost savings / pig        F1       F2       F3        F4        F5          F6   Total
       10% DDGS               $0.18    $0.39    $0.37     $0.36     $0.18    $0.24    $1.71
       20% DDGS               $0.23    $0.51    $0.47     $0.45     $0.24    $0.27    $2.16
       30% DDGS               $0.26    $0.55    $0.50     $0.49     $0.26    $0.31    $2.37
       40% DDGS               $0.27    $0.58    $0.54     $0.52     $0.28    $0.33    $2.51
June 2011 DDGS Value Calculator with no performance change

Corn, $/bu                $     7.25
SBM, $/ton                $   350.00
Monocal, $/ton            $   600.00
Limestone, $/ton          $    45.00
Lysine HCl, $/lb          $     1.20
DDGS, $/ton               $   200.00                 77% = DDGS:Corn price ratio


Diet cost change, $/ton         F1        F2        F3        F4        F5         F6
       10% DDGS               -$9.82    -$9.70    -$9.52    -$9.59    -$9.29   -$9.91
       20% DDGS               -$18.02   -$17.91   -$17.46   -$17.45   -$17.17 -$17.19
       30% DDGS               -$25.65   -$25.11   -$24.64   -$24.62   -$24.34 -$24.75
       40% DDGS               -$32.66   -$32.18   -$31.71   -$31.69   -$31.41 -$31.81


Feed cost savings / pig         F1        F2        F3        F4        F5         F6   Total
       10% DDGS               $0.28     $0.66     $0.68     $0.68     $0.39    $0.42    $3.12
       20% DDGS               $0.51     $1.23     $1.25     $1.24     $0.73    $0.73    $5.69
       30% DDGS               $0.73     $1.72     $1.77     $1.75     $1.03    $1.06    $8.05
       40% DDGS               $0.92     $2.20     $2.27     $2.26     $1.33    $1.36    $10.34
NutriQuest sponsored DDGS Oil Extraction Conference Summary, March 21, 2012


               State of Oil Extraction
• Approximately 50% of ethanol plants are extracting oil
  currently, expected to grow to 80% by year end (2012).
   – Traditional DDGS = 10-11% fat
   – Oil Extracted DDGS = 5-9% fat; majority will be 7-9%
• Oil extraction is being installed on the ā€œback endā€ of a
  plant (the thin stillage component) via a centrifuge
  system.
• Offers plants a 3-4 month payback on a $3mm
  investment.
NutriQuest sponsored DDGS Oil Extraction Conference Summary, March 21, 2012


   Impact on DDGS Value for Swine
• Research presented by Shurson and Kerr –
  – Each 1% reduction in oil results in a decrease of 30-50 kcal/kg
    ME; however this measurement may understate
  – There are other significant variables (e.g., each 25 point
    reduction in particle size results in an increase of 13.5 kcal/kg
    ME (particle size not impacted by oil extraction)).
  – The impact since oil content is not significant in the ME
    measurement equation (but fiber is).
NutriQuest sponsored DDGS Oil Extraction Conference Summary, March 21, 2012


    Impact on DDGS Value for Swine
• From 2002 to present, variation of components has increased
  (particularly energy levels – metabolizable energy (ME) and
  digestible energy (DE)).
• Ethanol plants do not always communicate to all customers
  when processes change (e.g. oil extraction) which creates a
  significant problem for producers.
• As ethanol plants increasingly need to gain efficiencies to be
  profitable (with the blender’s credit having expired and the
  blend wall reached), it is likely that there will be further
  technologies implemented to improve earnings
Feed Processing and Management
Every 100 microns =
1. F/G improves by 1.2%
2. 7 lbs less feed/finishing pig
3. Current $0.98/pig savings in feed cost
Grain Particle Size
• F/G decreases or increases with particle size change
• Lack of research in high co-product diets
   – Less corn in rations – true response less known in high co-
     product diets that contain less corn
   – DDGS grinding – data is mixed, more data is needed
   – Whole diet grinding – currently being evaluated
   – Grind it fine then pellet for flow ability
• Takes more time/energy to grind finer, however, less
  total tonnage is manufactured by the mill.
Pelleting for Commercial Finishing Pigs

• Feeding a pelleted diet improved ADG:
   – Exp. 1 = 7.0%
   – Exp. 2 = 4.5%
• Feeding a pelleted diet improved G:F:
   – Exp. 1 = 5.4%
   – Exp. 2 = 2.1
• Diet formulation did affect pellet quality, which may
  explain differences between the experiments (Exp. 2
  higher co-product)

                     Barnes et al., 2010
Wet Dry Feeder Meta Analysis
Items                           Dry       Wet-dry           SEM    P - value
Initial wt, kg                  33.7        33.7            2.68     0.27
Final wt, kg                   103.7       107.0            6.27    <0.01

ADG, kg/d                       0.87        0.91       0.021        <0.01
ADFI, kg/d                      2.31        2.43       0.101        <0.01
G:F                            0.386       0.386       0.0150        0.93

Yield, %                       75.8         75.6            0.26     0.57
HCW, kg                        91.5         94.4            0.93    <0.01
BF, mm                         16.7         18.1            0.23    <0.01
Loin, mm                       62.2         61.6            0.68     0.14
Lean, %                        51.4         50.8            0.85    <0.01

Water disappearance, L/pig/d    6.4         5.0             0.34     0.02

                                Nitikanchana et al., 2012
Example Diets with Alternatives
• Phase = 125 – 170 lb of body weight
• Corn = $6.00/bu
• SBM, 46.5% = $400/ton
• DDGS = $240/ton
• Wheat midds = $200/ton
• Meat and Bone = $567/ton
• Moncal P, 21% = $660/ton
• L-Lysine = $1.12/lb
Higher   Meat &           Wheat DDGS &
Ingredient           Normal     AA      bone    DDGS    midds  midds
Corn                  1529     1607     1576     1120   1318    828
SBM, 46.5%             425     342      307      236     231    126
Meat & bone meal                        100
DDGS                                             600            600
Wheat middlings                                         400     400
Lysine HCl             3       5.7      4.4       7       7.2     8.5
DL-Methionine                  0.25                       0.3
L-Threonine                    1.2      0.6               1.7
Monocal P, 21% P      16       16                 2      10
Limestone             15       16                23.5    20      26
VTM & Salt            12       12       12       12      12      12
SID Lys:ME, g/Mcal    2.55    2.55     2.55     2.55    2.55    2.55
SID Lys               0.85    0.85     0.85     0.86    0.83    0.84
SID Met & cys:lys      60      56       57       70      57       71
SID Thr:lys            62      62       62       64      62       62
SID Trp:lys           19.1    16.5     16.5     16.5    16.5    16.5
ME, kcal/lb          1,515    1,515    1,513    1,522   1,483   1,487
CP, %                 16.5    15.1     16.6     18.7    14.6    18.2
Available P, %        0.23    0.23     0.28     0.23    0.23    0.27
Higher   Meat &            Wheat DDGS &
Ingredient           Normal     AA      bone    DDGS     midds  midds
Corn                  1529     1607     1576     1120    1318    828
SBM, 46.5%            425      342      307      236      231    126
Meat & bone meal                        100
DDGS                                             600               600
Wheat middlings                                           400      400
Lysine HCl             3       5.7      4.4       7         7.2      8.5
DL-Methionine                  0.25                         0.3
L-Threonine                    1.2      0.6                 1.7
Monocal P, 21% P       16      16                 2        10
Limestone              15      16                23.5      20      26
VTM & Salt             12      12       12       12        12      12

Diet w/ processing   $273.47 $270.20 $280.09 $263.85 $257.47 $251.61
Budget, lb/pig        120.0   120.0    120.2    119.5    122.7    122.3
Feed cost, $/pig     $16.41   $16.21   $16.83   $15.77   $15.79   $15.39
F/G                   2.67     2.67     2.67     2.66     2.73     2.72
Feed Efficiency
                   Feed Efficiency

  High feed
   High feed
                          Low ADG               Other factors
disappearance              Low ADG              Other factors
disappearance
            Genetics                 Disease              Particle size

          Feed wastage               Genetics              Diet form

           Temperature          Feed availability

             Mortality          Water availability

          Feed delivery          Diet deficiency

           Amino acid
                                  Temperature
           deficiency

         Low Energy diets
K-State Web Resources
           www.ksuswine.org
• DDGS Calculator
• Synthetic Amino Acid Calculator
• Fat Analysis Calculator
• Feed Budget Calculator
• Feeder Adjustment Cards
• Particle Size Information
• Marketing Calculators
• Gestation Feeding Tools
Thank you!

       K-STATE
        RESEARCH
           and
        EXTENSION

WWW.KSUswine.org

Dr. Joel DeRouchey - Ingredient availability and cost

  • 1.
    Ingredient Cost Update JoelDeRouchey, Mike Tokach, Bob Goodband, Steve Dritz, and Jim Nelssen WWW.KSUswine.org
  • 2.
    Presentation Outline • Ingredients – Spray Dried Whey (lactose sources) – Added liquid fat – Bakery by-products – DDGS • Feed processing and feeder type • Current diet cost examples
  • 3.
    Recent Ingredient Prices June 2009 June 2010 June 2011 June 2012 Corn, $/bu $4.00 $3.20 $7.25 $6.00 SBM, $/ton $395 $285 $350 $400 DDGS, $/ton $150 $120 $200 $240 CWG, $/cwt $27 $33 $50 $46 Dical, $/cwt $23 $26 $28 $33 Dried whey, $/cwt $24 $48 $60 $75 L-lysine HCl, $/cwt $70 $110 $120 $113
  • 4.
    Sprayed-dry whey sourceon nursery performance (Day 5 to 19 after weaning) 0.85 SE = 0.03 ab = P < 0.05 0.80 0.77 b 0.77 b 0.75 ab ab 0.72 0.72 a ADG, lb a a 0.70 0.70 0.68 0.68 0.65 a 0.65 0.60 0.55 Control A B C D E F G Whey source Bergstrom et al., 2007
  • 5.
    Sprayed-dry whey sourceon nursery performance ($0.40/lb whey) 5.00 Margin over feed, $/pig 4.50 4.36 4.22 4.00 4.00 3.91 3.87 3.70 3.75 3.69 3.50 3.00 1 2 3 4 5 6 7 8 Whey source Bergstrom et al., 2007 w/ June 2012 prices
  • 6.
    Sprayed-dry whey sourceon nursery performance ($0.75/lb whey) 4.00 3.91 Margin over feed, $/pig 3.80 3.75 3.70 3.60 3.56 3.46 3.44 3.40 3.33 3.26 3.20 3.00 1 2 3 4 5 6 7 8 Whey source Bergstrom et al., 2007 w/ June 2012 prices
  • 7.
    Added Fat Calculatoravailable at www.KSUswine.org Corn, $/bu $ 6.00 Carcass price $ 90.00 SBM, $/ton $ 400.00 Est. live price 68.91 Fat, $/cwt $ 46.00 Grind/mix/delivery, $/ton $ 15.00 $0.40 $0.08 $0.10 2.5% fat $0.10 $0.05 5% fat Net return, $/pig $(0.20) $(0.06) $(0.23) $(0.23) $(0.50) $(0.51) $(0.62) $(0.60) $(0.80) $(0.72) $(1.10) $(1.40) $(1.23) $(1.70) $(1.62) $(2.00)
  • 8.
    Added Fat Recommendations •Should I have fat in my diets currently? – Long on space = No • Gain improvements not required while increasing feed cost – Short on space = Yes/No/Maybe • Evaluate net return and determine optimum level by dietary phase. • Strategy should be different as economics change • Which season are pigs to be marketed? – Pigs placed in midsummer/fall/early winter months can/should forgo added fat due to growth rate improvements to come with cooler weather. – Summer marketed pigs should have begun to receive added fat in March to capture growth rate.
  • 9.
    Using added fatfor dust control • A common request is to reduce dust by using 1% added fat (currently $0.46/lb) – F/G could improve by 0.04 from higher energy – ADG very minor to have measurable effect • Current feed cost increase (F/G improvement accounted for) for dust control in finishing is $1.23 / pig from 50 to 250 lbs! • Can not afford dust control in finishing diets
  • 10.
    Bakery By-Products • Bakerybyproducts are derived from the baking and cereal industries. • Dried bakery byproducts are composed of a variety of commodities, such as hard and soft wheat products, pasta, potato chip waste, cakes, crackers, breakfast cereals, and other food products. • Bakery byproduct varies in nutrient profile depending on its source products and is used primarily as an energy source to replace corn in the diet. • Also, because most bakery products contain high amounts of sugar, it is usually highly palatable.
  • 11.
    Bakery By-Products • Thingsto recognize: • Bakery products can vary in fat content which directly affects the assigned energy value. – NRC, 1998 • Bakery = 11.3% fat, 1,678 kcal/lb ME (+8% ME vs. corn) • Corn = 3.9% fat, 1,551 kcal/lb ME • However, many bakery products contain lower levels of fat then past book values (7-10% is typical). Recent analysis from a Midwest commercial mill using bakery: • Bakery = 6.4% Fat, Calculated ME value was 92% of corn
  • 12.
    June 2012 DDGSValue Calculator with no performance change Corn, $/bu $ 6.00 SBM, $/ton $ 400.00 Monocal, $/ton $ 660.00 Limestone, $/ton $ 47.00 Lysine HCl, $/lb $ 1.12 DDGS, $/ton $ 240.00 112% = DDGS:Corn price ratio Diet cost change, $/ton F1 F2 F3 F4 F5 F6 10% DDGS -$6.24 -$5.66 -$5.12 -$5.00 -$4.23 -$5.64 20% DDGS -$8.02 -$7.41 -$6.51 -$6.34 -$5.57 -$6.42 30% DDGS -$9.18 -$7.99 -$7.03 -$6.85 -$6.08 -$7.31 40% DDGS -$9.56 -$8.43 -$7.46 -$7.28 -$6.51 -$7.75 Feed cost savings / pig F1 F2 F3 F4 F5 F6 Total 10% DDGS $0.18 $0.39 $0.37 $0.36 $0.18 $0.24 $1.71 20% DDGS $0.23 $0.51 $0.47 $0.45 $0.24 $0.27 $2.16 30% DDGS $0.26 $0.55 $0.50 $0.49 $0.26 $0.31 $2.37 40% DDGS $0.27 $0.58 $0.54 $0.52 $0.28 $0.33 $2.51
  • 13.
    June 2011 DDGSValue Calculator with no performance change Corn, $/bu $ 7.25 SBM, $/ton $ 350.00 Monocal, $/ton $ 600.00 Limestone, $/ton $ 45.00 Lysine HCl, $/lb $ 1.20 DDGS, $/ton $ 200.00 77% = DDGS:Corn price ratio Diet cost change, $/ton F1 F2 F3 F4 F5 F6 10% DDGS -$9.82 -$9.70 -$9.52 -$9.59 -$9.29 -$9.91 20% DDGS -$18.02 -$17.91 -$17.46 -$17.45 -$17.17 -$17.19 30% DDGS -$25.65 -$25.11 -$24.64 -$24.62 -$24.34 -$24.75 40% DDGS -$32.66 -$32.18 -$31.71 -$31.69 -$31.41 -$31.81 Feed cost savings / pig F1 F2 F3 F4 F5 F6 Total 10% DDGS $0.28 $0.66 $0.68 $0.68 $0.39 $0.42 $3.12 20% DDGS $0.51 $1.23 $1.25 $1.24 $0.73 $0.73 $5.69 30% DDGS $0.73 $1.72 $1.77 $1.75 $1.03 $1.06 $8.05 40% DDGS $0.92 $2.20 $2.27 $2.26 $1.33 $1.36 $10.34
  • 14.
    NutriQuest sponsored DDGSOil Extraction Conference Summary, March 21, 2012 State of Oil Extraction • Approximately 50% of ethanol plants are extracting oil currently, expected to grow to 80% by year end (2012). – Traditional DDGS = 10-11% fat – Oil Extracted DDGS = 5-9% fat; majority will be 7-9% • Oil extraction is being installed on the ā€œback endā€ of a plant (the thin stillage component) via a centrifuge system. • Offers plants a 3-4 month payback on a $3mm investment.
  • 15.
    NutriQuest sponsored DDGSOil Extraction Conference Summary, March 21, 2012 Impact on DDGS Value for Swine • Research presented by Shurson and Kerr – – Each 1% reduction in oil results in a decrease of 30-50 kcal/kg ME; however this measurement may understate – There are other significant variables (e.g., each 25 point reduction in particle size results in an increase of 13.5 kcal/kg ME (particle size not impacted by oil extraction)). – The impact since oil content is not significant in the ME measurement equation (but fiber is).
  • 16.
    NutriQuest sponsored DDGSOil Extraction Conference Summary, March 21, 2012 Impact on DDGS Value for Swine • From 2002 to present, variation of components has increased (particularly energy levels – metabolizable energy (ME) and digestible energy (DE)). • Ethanol plants do not always communicate to all customers when processes change (e.g. oil extraction) which creates a significant problem for producers. • As ethanol plants increasingly need to gain efficiencies to be profitable (with the blender’s credit having expired and the blend wall reached), it is likely that there will be further technologies implemented to improve earnings
  • 17.
  • 18.
    Every 100 microns= 1. F/G improves by 1.2% 2. 7 lbs less feed/finishing pig 3. Current $0.98/pig savings in feed cost
  • 19.
    Grain Particle Size •F/G decreases or increases with particle size change • Lack of research in high co-product diets – Less corn in rations – true response less known in high co- product diets that contain less corn – DDGS grinding – data is mixed, more data is needed – Whole diet grinding – currently being evaluated – Grind it fine then pellet for flow ability • Takes more time/energy to grind finer, however, less total tonnage is manufactured by the mill.
  • 20.
    Pelleting for CommercialFinishing Pigs • Feeding a pelleted diet improved ADG: – Exp. 1 = 7.0% – Exp. 2 = 4.5% • Feeding a pelleted diet improved G:F: – Exp. 1 = 5.4% – Exp. 2 = 2.1 • Diet formulation did affect pellet quality, which may explain differences between the experiments (Exp. 2 higher co-product) Barnes et al., 2010
  • 21.
    Wet Dry FeederMeta Analysis Items Dry Wet-dry SEM P - value Initial wt, kg 33.7 33.7 2.68 0.27 Final wt, kg 103.7 107.0 6.27 <0.01 ADG, kg/d 0.87 0.91 0.021 <0.01 ADFI, kg/d 2.31 2.43 0.101 <0.01 G:F 0.386 0.386 0.0150 0.93 Yield, % 75.8 75.6 0.26 0.57 HCW, kg 91.5 94.4 0.93 <0.01 BF, mm 16.7 18.1 0.23 <0.01 Loin, mm 62.2 61.6 0.68 0.14 Lean, % 51.4 50.8 0.85 <0.01 Water disappearance, L/pig/d 6.4 5.0 0.34 0.02 Nitikanchana et al., 2012
  • 22.
    Example Diets withAlternatives • Phase = 125 – 170 lb of body weight • Corn = $6.00/bu • SBM, 46.5% = $400/ton • DDGS = $240/ton • Wheat midds = $200/ton • Meat and Bone = $567/ton • Moncal P, 21% = $660/ton • L-Lysine = $1.12/lb
  • 23.
    Higher Meat & Wheat DDGS & Ingredient Normal AA bone DDGS midds midds Corn 1529 1607 1576 1120 1318 828 SBM, 46.5% 425 342 307 236 231 126 Meat & bone meal 100 DDGS 600 600 Wheat middlings 400 400 Lysine HCl 3 5.7 4.4 7 7.2 8.5 DL-Methionine 0.25 0.3 L-Threonine 1.2 0.6 1.7 Monocal P, 21% P 16 16 2 10 Limestone 15 16 23.5 20 26 VTM & Salt 12 12 12 12 12 12 SID Lys:ME, g/Mcal 2.55 2.55 2.55 2.55 2.55 2.55 SID Lys 0.85 0.85 0.85 0.86 0.83 0.84 SID Met & cys:lys 60 56 57 70 57 71 SID Thr:lys 62 62 62 64 62 62 SID Trp:lys 19.1 16.5 16.5 16.5 16.5 16.5 ME, kcal/lb 1,515 1,515 1,513 1,522 1,483 1,487 CP, % 16.5 15.1 16.6 18.7 14.6 18.2 Available P, % 0.23 0.23 0.28 0.23 0.23 0.27
  • 24.
    Higher Meat & Wheat DDGS & Ingredient Normal AA bone DDGS midds midds Corn 1529 1607 1576 1120 1318 828 SBM, 46.5% 425 342 307 236 231 126 Meat & bone meal 100 DDGS 600 600 Wheat middlings 400 400 Lysine HCl 3 5.7 4.4 7 7.2 8.5 DL-Methionine 0.25 0.3 L-Threonine 1.2 0.6 1.7 Monocal P, 21% P 16 16 2 10 Limestone 15 16 23.5 20 26 VTM & Salt 12 12 12 12 12 12 Diet w/ processing $273.47 $270.20 $280.09 $263.85 $257.47 $251.61 Budget, lb/pig 120.0 120.0 120.2 119.5 122.7 122.3 Feed cost, $/pig $16.41 $16.21 $16.83 $15.77 $15.79 $15.39 F/G 2.67 2.67 2.67 2.66 2.73 2.72
  • 25.
    Feed Efficiency Feed Efficiency High feed High feed Low ADG Other factors disappearance Low ADG Other factors disappearance Genetics Disease Particle size Feed wastage Genetics Diet form Temperature Feed availability Mortality Water availability Feed delivery Diet deficiency Amino acid Temperature deficiency Low Energy diets
  • 26.
    K-State Web Resources www.ksuswine.org • DDGS Calculator • Synthetic Amino Acid Calculator • Fat Analysis Calculator • Feed Budget Calculator • Feeder Adjustment Cards • Particle Size Information • Marketing Calculators • Gestation Feeding Tools
  • 27.
    Thank you! K-STATE RESEARCH and EXTENSION WWW.KSUswine.org

Editor's Notes

  • #22Ā The result showed that pigs fed with WD feeders had greater ADG and ADFI compared with those fed with CD feeders. However, there was no benefit in feed efficiency.As a result of improved final body weight with no difference in yield, HCW of pigs fed with wet-dry feeder is 3.2 % greater than those fed with dry feeder. BF was greater and percentage lean was lower in pigs fed with WD feeders compared to those fed with CD feeders. loin depth was not different between feeder types. Water usage for pigs using WD feeders was 1.4 L/pig/d less than for pigs using CD feeders.